

Friday's session brought an increase above the upper border of the short-term declining trend channel. A positive event? Yes, but only if the buyers are strong enough to keep the levels gained. Unfortunately, the last session of the previous week was not as good for the bulls as one would expect. Why?
- EUR/USD: none
- GBP/USD: none
- USD/JPY: long (a stop-loss order at 111.11; the initial upside target at 113.40)
- USD/CAD: none
- USD/CHF: none
- AUD/USD: none
EUR/USD
On Friday, we wrote the following:
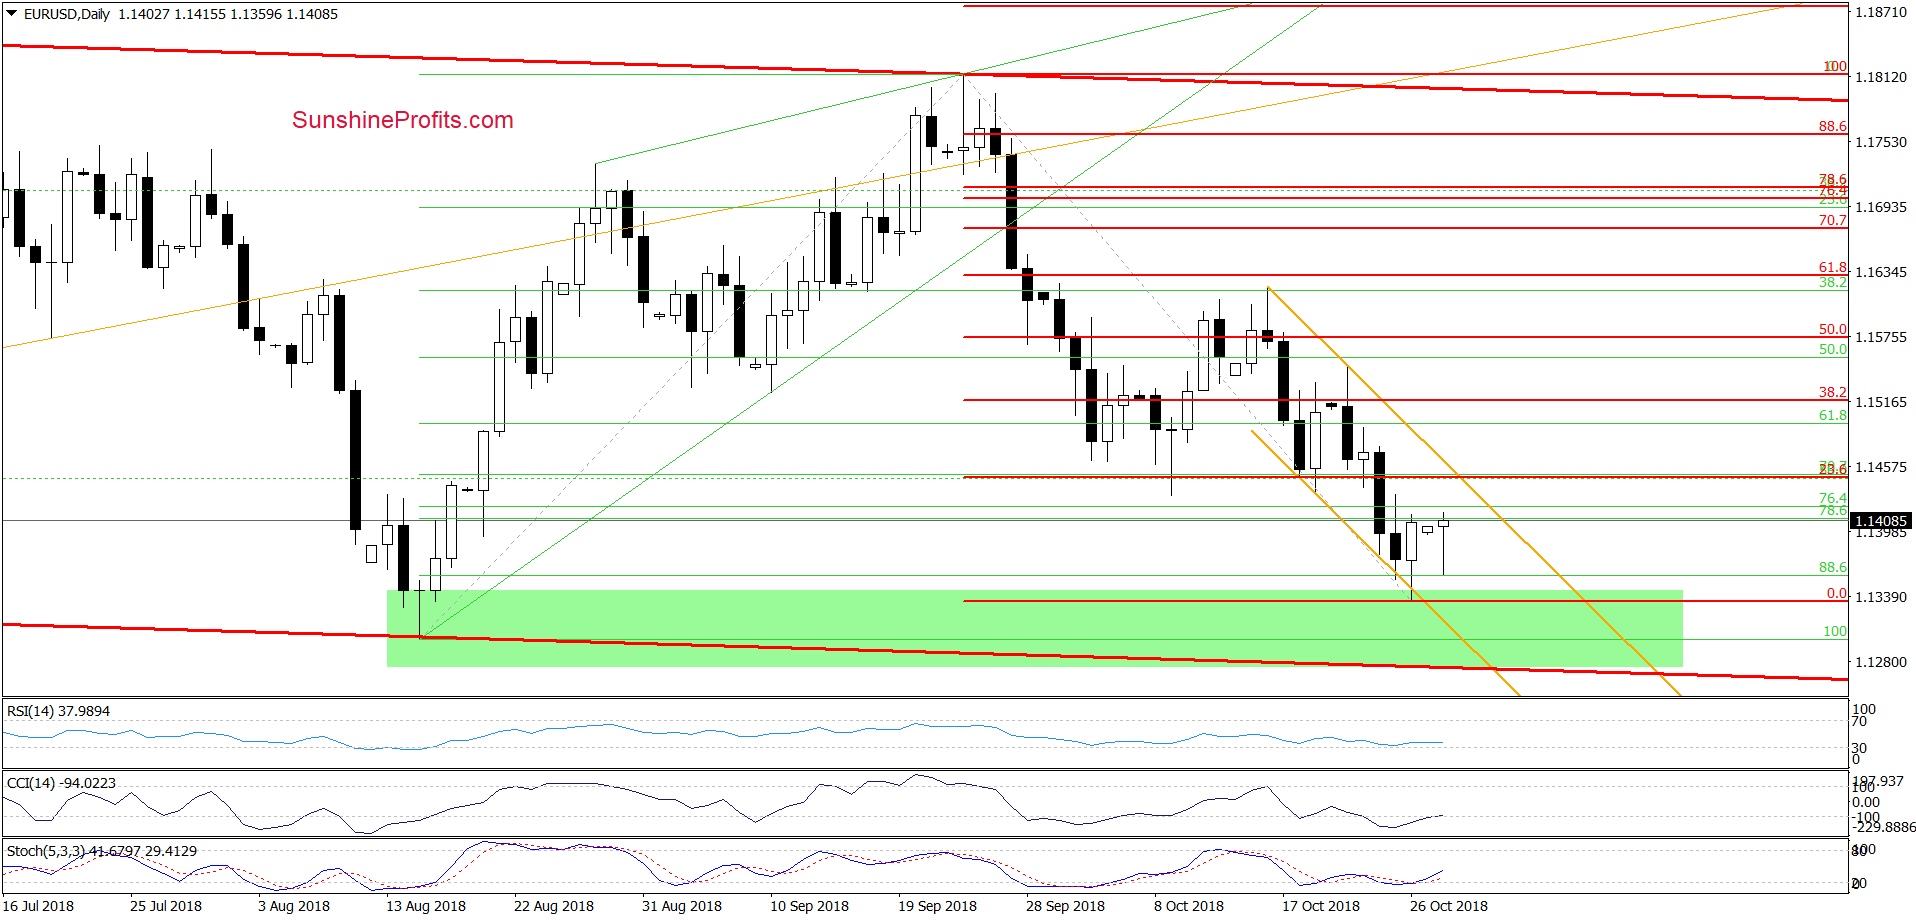
(…) currency bears pushed EUR/USD lower, which resulted in another test of the border of the very short-term orange declining trend channel earlier today.
Thanks to this drop, the pair also slipped to the green support zone based on August lows, which in combination with the lower border of the red declining trend channel (…) and the current position of the indicators suggests that the space for declines may be limited in the short term.
On the daily chart, we see that the combination of the above-mentioned supports encouraged currency bulls to fight on Friday. Their determination resulted in an invalidation of a tiny breakdown below the lower border of the orange trend channel, which together with the current position of the indicators (the Stochastic Oscillator generated a buy signal, while the CCI is very close to doing the same) suggests that we could see a test of the upper border of the formation in the very near future.
Nevertheless, we think that further improvement will be more likely and reliable if the exchange rate climbs above this first resistance in the following day(s). If we see such price action, we’ll consider opening long positions. Until this time, waiting at the sidelines is justified from the risk/reward perspective.
Trading position (short-term; our opinion): None positions are justified from the risk/reward perspective.
USD/CAD
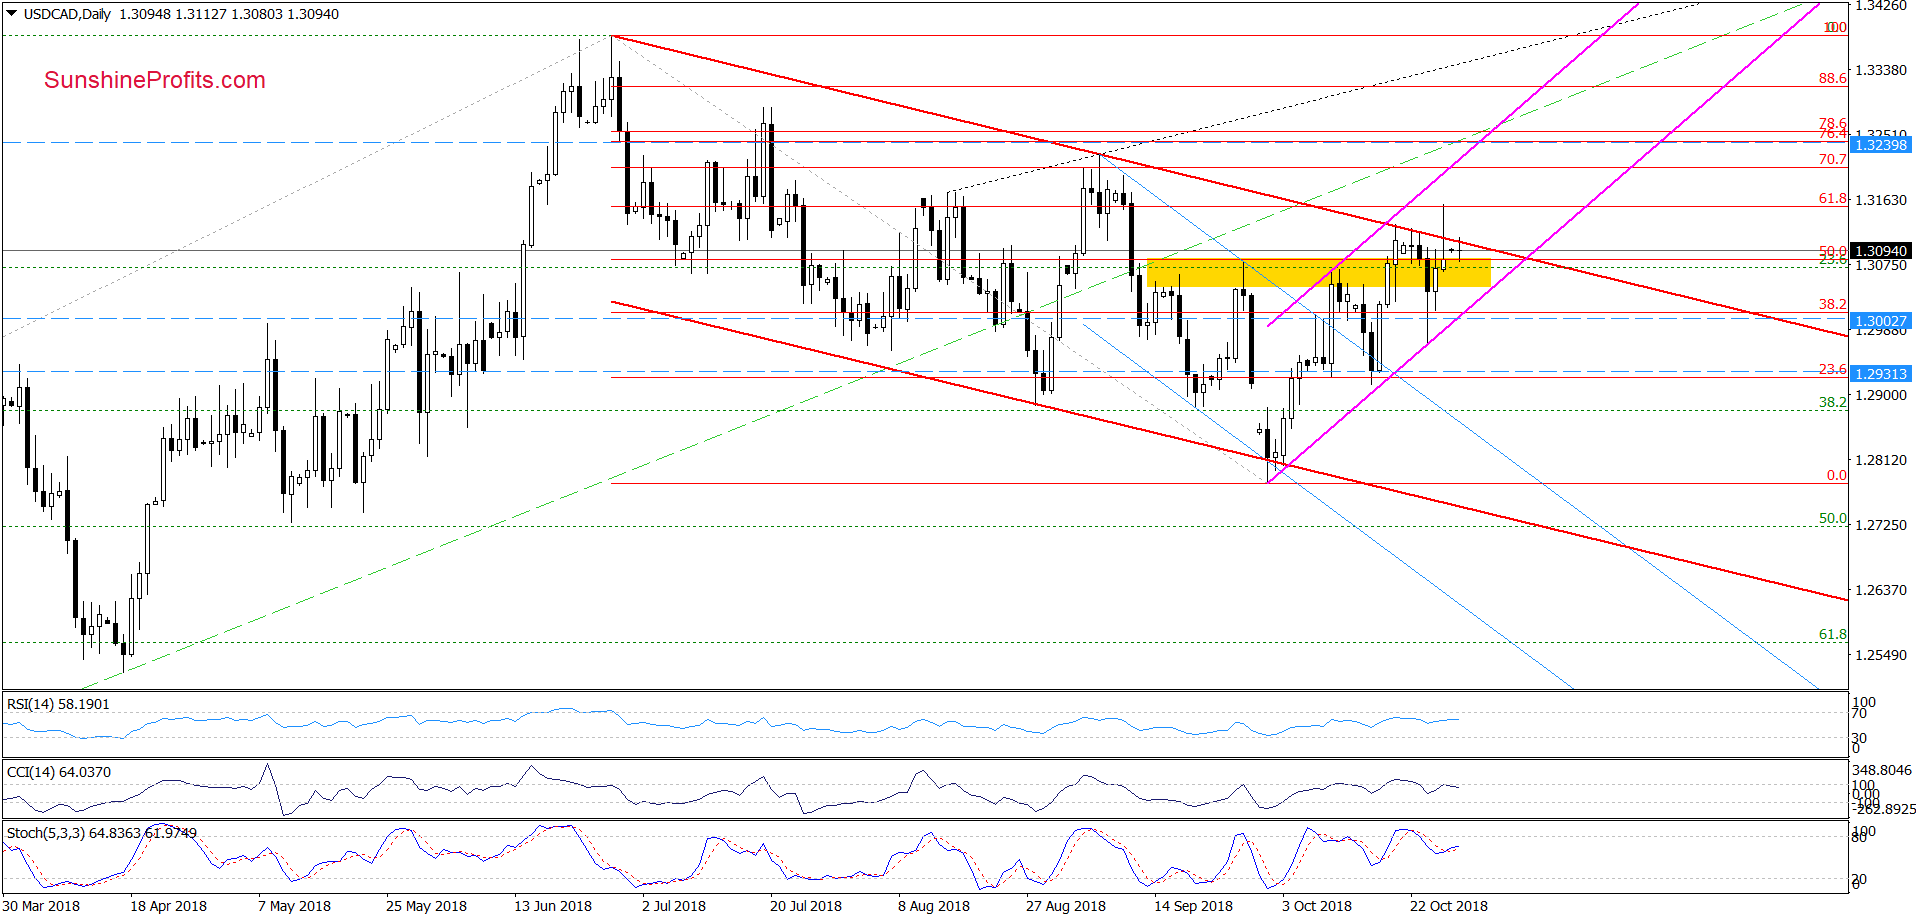
Looking at the daily chart, we see that although USD/CAD extended gains and broke above the upper border of the red declining trend channel on Friday, this improvement was very temporary as the 61.8% Fibonacci retracement stopped the buyers.
As a result, the exchange rate pulled back quite sharply before the session closure and created a pro-bearish candlestick formation – a shooting star, which together with Friday’s invalidation of the breakout, the proximity to the 61.8% Fibonacci retracement and the current position of the indicators suggests that further deterioration in the coming week is very likely.
How low could the exchange rate go?
In our opinion, the first downside target will be the lower border of the pink very short-term rising trend channel (currently around 1.3000). However, if it is broken, the way to the mid-October lows will be open.
Trading position (short-term; our opinion): None positions are justified from the risk/reward perspective, but if we see another unsuccessful attempt to go above the upper line of the red declining trend channel, we’ll consider opening short positions. As always, we’ll keep you - our subscribers - informed should anything change.
USD/CHF
In our Forex Trading Alert posted on Oct. 19, 2018, we wrote the following:
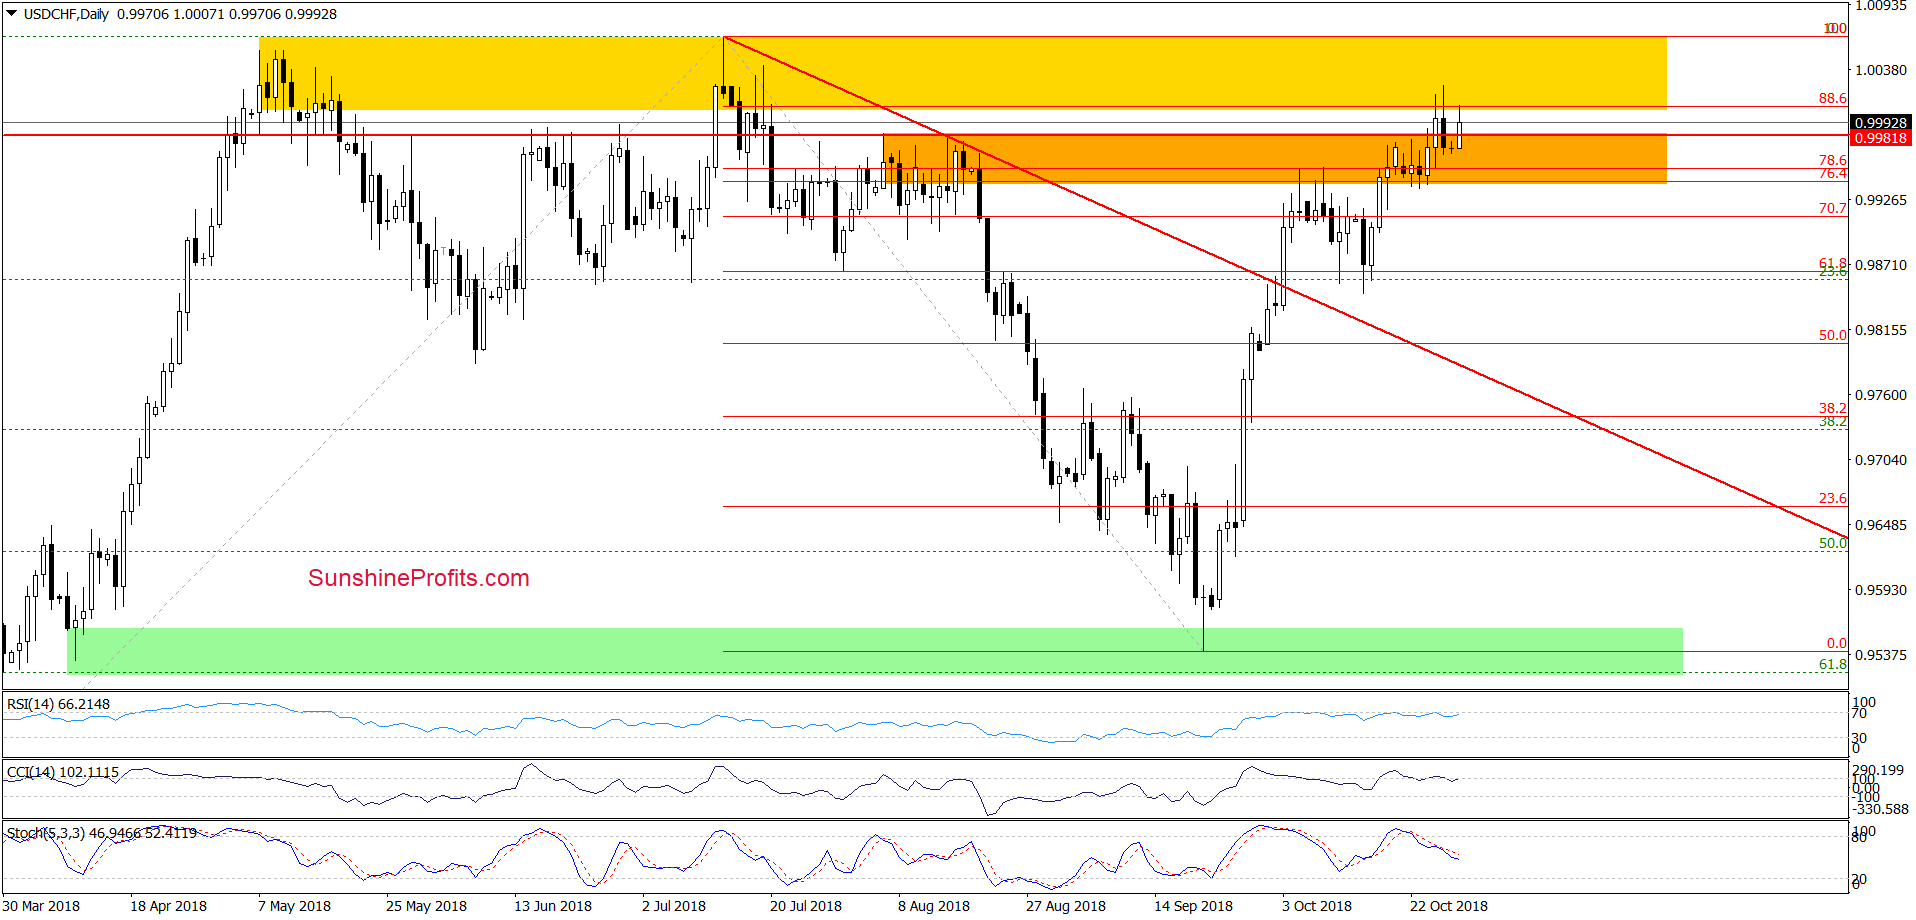
(…) it seems that currency bulls will try to push the pair higher in the very near future. (…) however, it is worth keeping in mind that slightly above the orange area the buyers will have to face another strong resistance zone (marked with yellow), which keeps gains in check since mid-July.
Therefore, in our opinion, another significant move to the upside will be more likely and reliable if we see USD/CHF above the yellow resistance zone. Until this time, another reversal from this area should not surprise us – especially if the daily indicators generate sell signals in the coming week.
From today’s point of view, we see that currency bulls took USD/CHF higher (as we had expected), but the above-mentioned yellow resistance zone stopped them on Friday once again, triggering a pullback.
Thanks to the sellers’ attack, the pair invalidated the earlier breakout above the orange resistance zone, which in combination with the sell signals generated by the daily indicators suggests that further deterioration may be just around the corner.
Nevertheless, before we see such price action, the buyers can try their hand again and test the Friday's peak before another move to the downside. If the situation develops in line with the above assumptions and currency bulls show weakness in the coming days, we’ll consider opening shot positions (especially if USD/CHF closes one more session below the upper border of the orange resistance zone). We will keep you informed should anything change, or should we see a confirmation/invalidation of the above.
Trading position (short-term; our opinion): No positions are justified from the risk/reward perspective, but if currency bulls show weakness in the coming days, we’ll consider opening shot positions.
Thank you.
Nadia Simmons
Forex & Oil Trading Strategist
Przemyslaw Radomski, CFA
Founder, Editor-in-chief, Gold & Silver Fund Manager
Gold & Silver Trading Alerts
Forex Trading Alerts
Oil Investment Updates
Oil Trading Alerts

