

During Friday’s session currency bulls pushed the U.S dollar against its Canadian counterpart to the highest level in 2018. Despite this improvement, their opponents used the strength of their long-term ally and stopped the rally, triggering a pullback. What does it mean for USD/CAD and our wallets?
In our opinion the following forex trading positions are justified - summary:
- EUR/USD: short (a stop-loss order at 1.2806; the initial downside target at 1.2186)
- GBP/USD: short (a stop-loss order at 1.4548; the next downside target at 1.3685)
- USD/JPY: long (a stop-loss order at 107.82; the initial upside target at 111.33)
- USD/CAD: none
- USD/CHF: none
- AUD/USD: short (a stop-loss order at 0.8222; the initial downside target at 0.7743)
EUR/USD
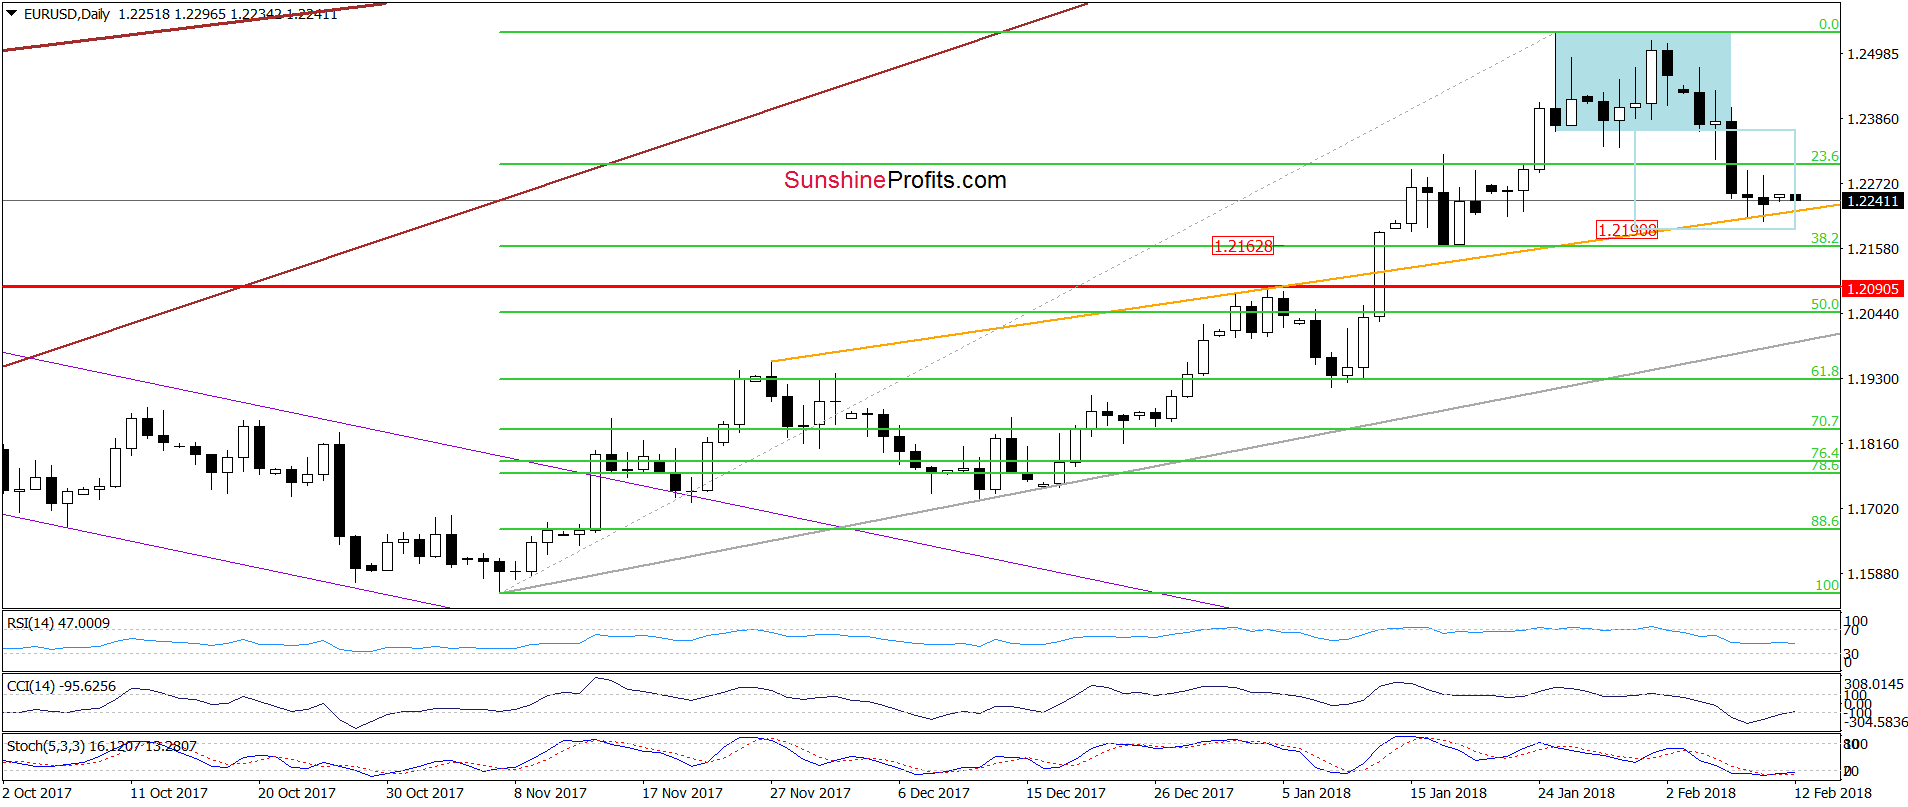
Quoting our Friday commentary on this currency pair:
(…) Although the exchange rate rebounded slightly (…), the sellers pushed the pair lower earlier today, which suggests that we’ll see a re-test of the orange line or even a drop to the 38.2% Fibonacci retracement based on the entire November-January upward move (around 1.2163) in the coming day(s).
From today’s point of view, we see that the situation developed in lime with the above scenario and EUR/USD slipped to our downside target. What’s next? The current position of the daily indicators suggests that reversal and higher values of the exchange rate are just around the corner.
However, when we zoom out our picture, we’ll see several bearish factors on the horizon, which indicate that (at least) one more downswing and a drop to our next target is still ahead of us.
Let’s take a look at the long-term chart below.
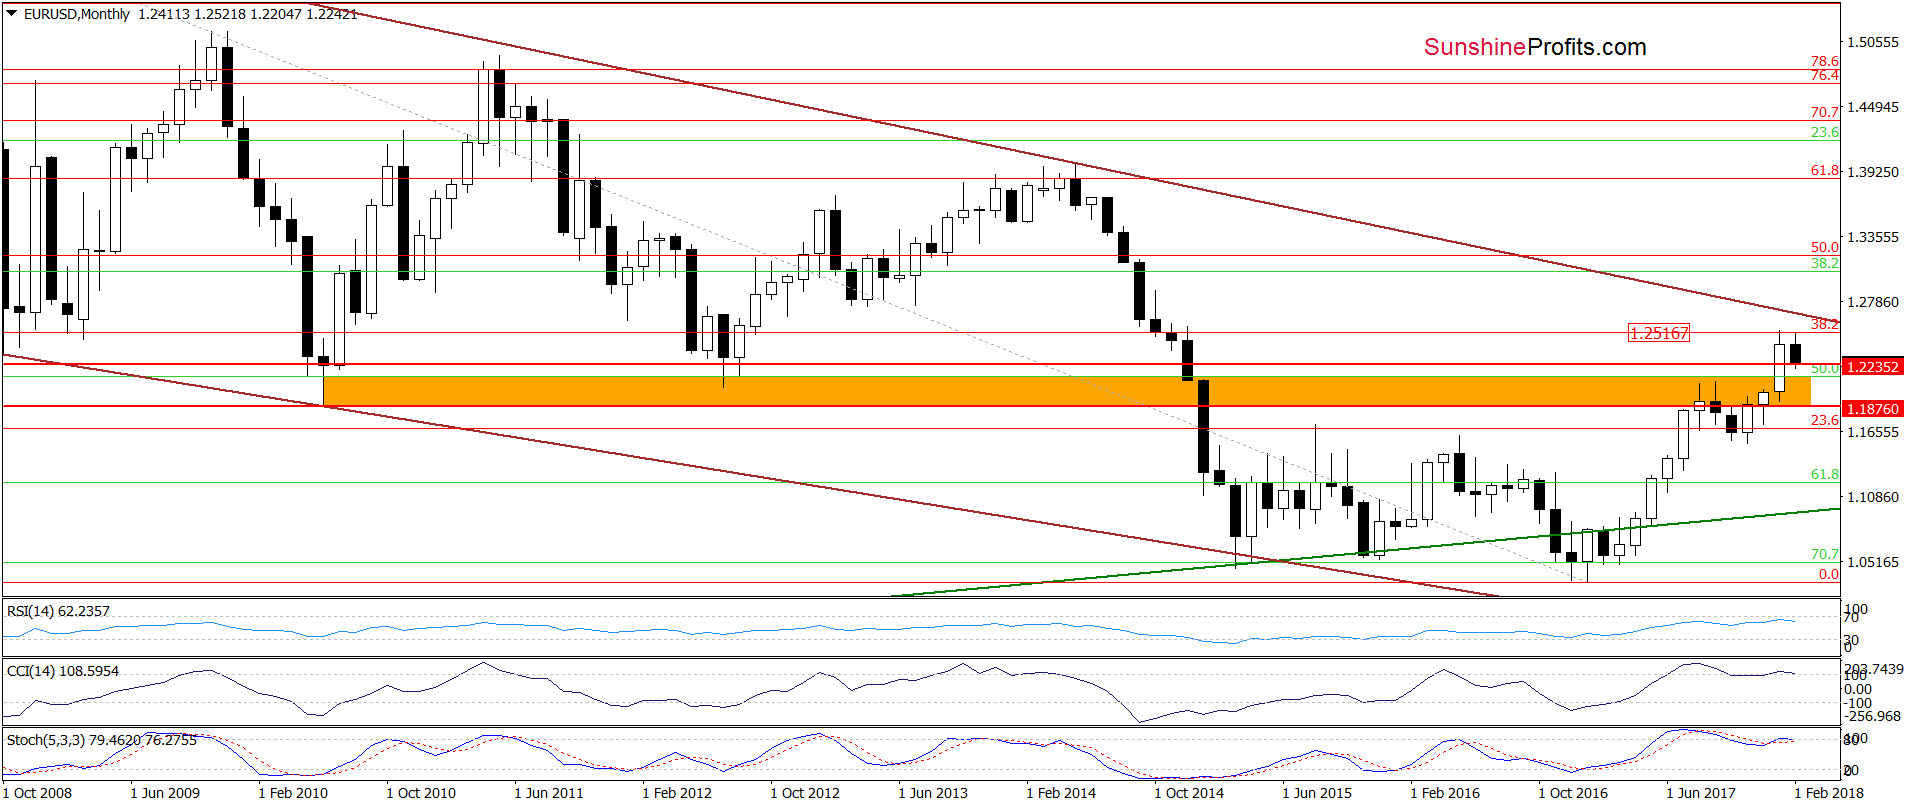
As you see on the monthly chart, EUR/USD invalidated the earlier tiny breakout above the 38.2% Fibonacci retracement, which together with the current position of the indicators (they are very close to generating the sell signals) increase the probability of further deterioration in the coming days.
Trading position (short-term; our opinion): Short positions (with a stop-loss order at 1.2806 and the initial downside target at 1.2186) are justified from the risk/reward perspective. We will keep you informed should anything change, or should we see a confirmation/invalidation of the above.
GBP/USD
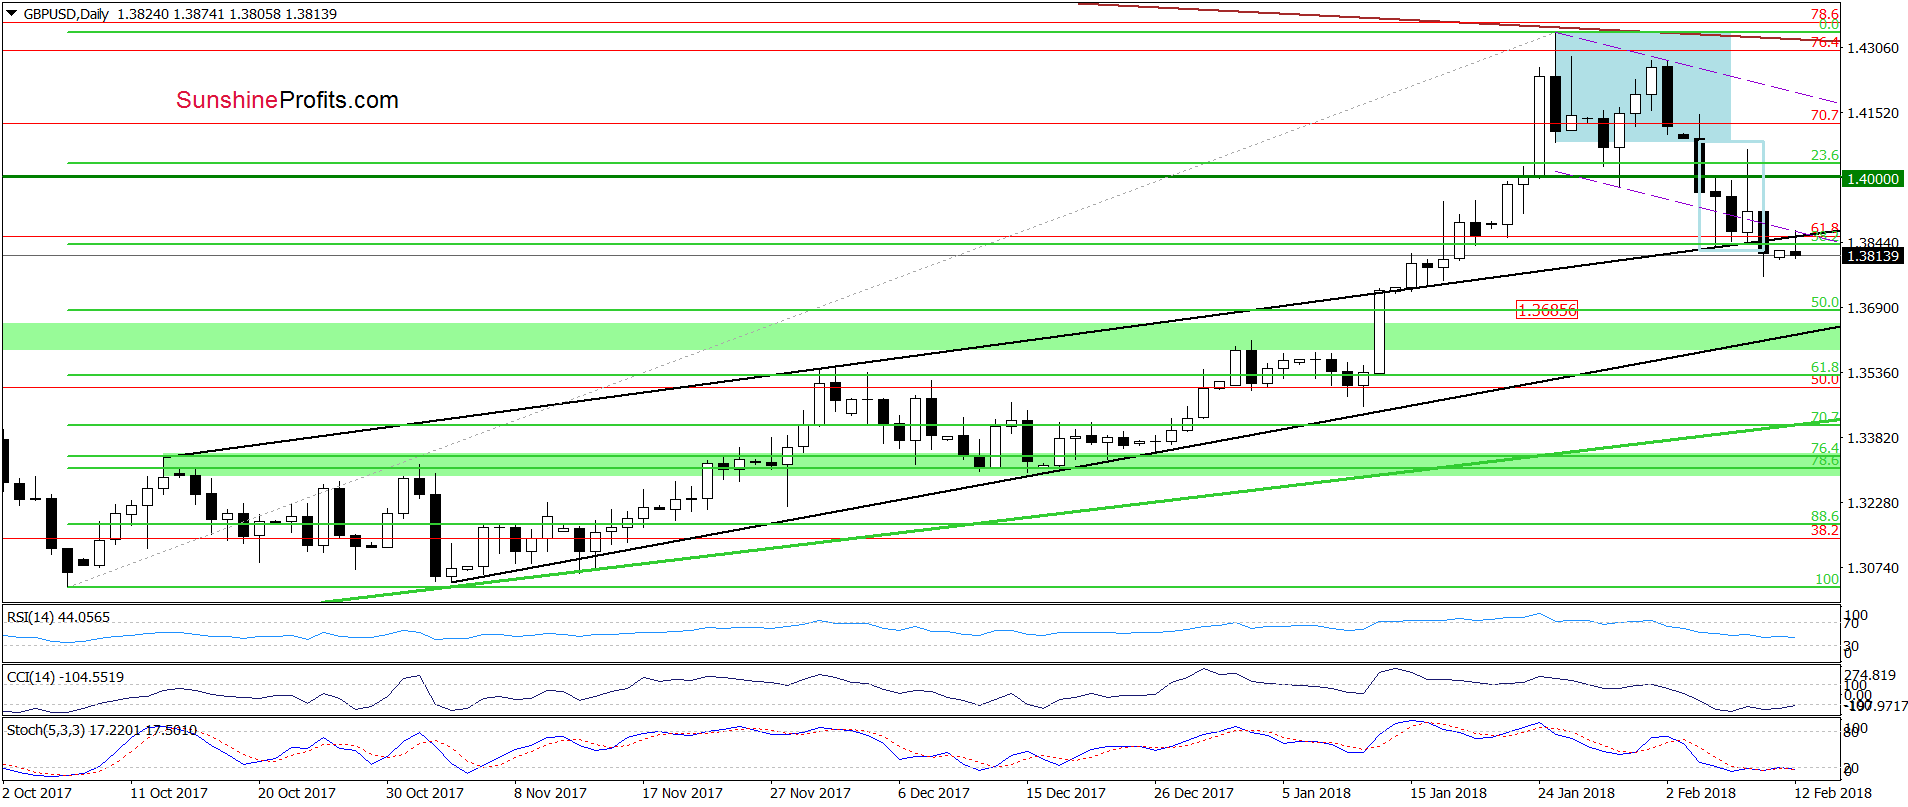
On Friday, we wrote:
(…) the pair reversed and erased most of the earlier increase. This bearish development together with the lack of the buy signals generated by the daily indicators triggered further deterioration earlier today. Thanks to today’s drop GBP/USD slipped under the (…) support area, which suggests lower values of the exchange rate in the coming day(s).
On the daily chart, we see that although currency bulls tried to push the pair higher earlier today, the upper border of the black rising trend channel stopped them, triggering a pullback. Such price action looks like a verification of Friday’s breakdown and suggests another attempt to move lower in the coming day(s).
How low could the pair go? We think that the best answer to this question will be the quote from our last commentary on this currency pair:
(…) If (…) the pair moves lower from current levels, the next downside target will be around 1.3685, where the 50% Fibonacci retracement (based on the entire October-January upward move) is.
Trading position (short-term; our opinion): Short positions (with a stop-loss order at 1.4548 and the next downside target at 1.3685) are justified from the risk/reward perspective. We will keep you informed should anything change, or should we see a confirmation/invalidation of the above.
USD/CAD
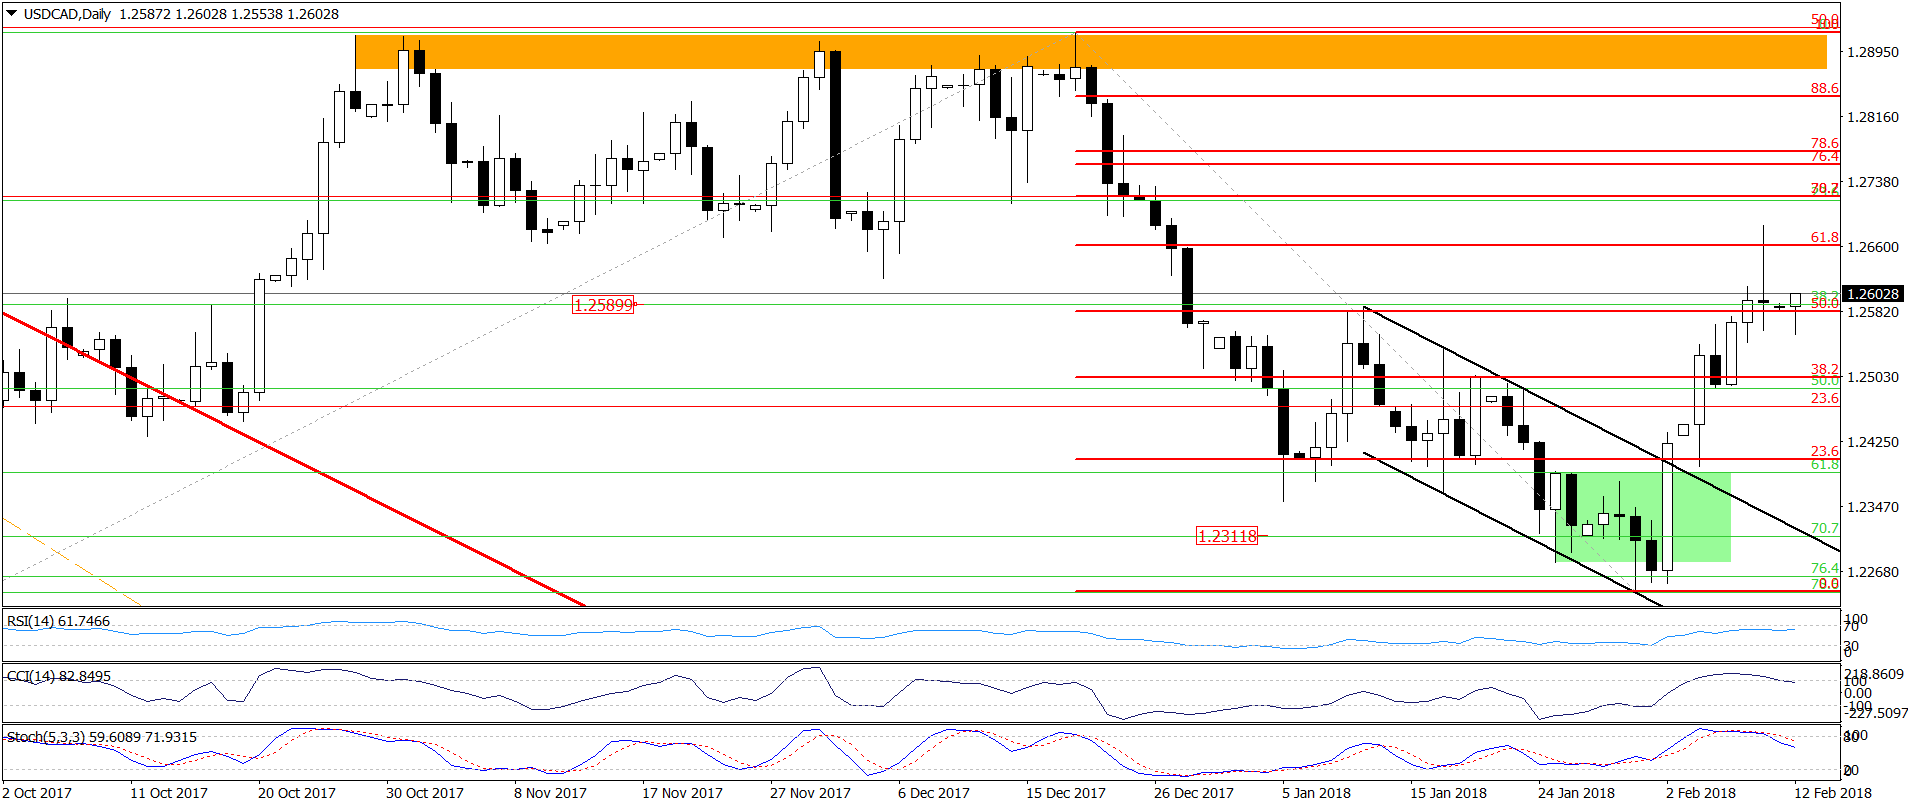
Quoting our Friday commentary on this currency pair:
(…) the exchange closed yesterday’s session above the January 11 peak, which (as we wrote yesterday) suggests further improvement and a test of the next retracement around1.2662. Nevertheless, the current levels of the indicators suggest that reversal is just around the corner.
Looking at the daily chart, we see that currency bulls pushed USD/CAD higher as we had expected, and the pair reached our next upside target. Nevertheless, all daily indicators generated the sell signals, suggesting further declines in the coming week.
This pro bearish scenario is also reinforced by the medium-term picture of the exchange rate. Why? Let’s analyze the chart below.
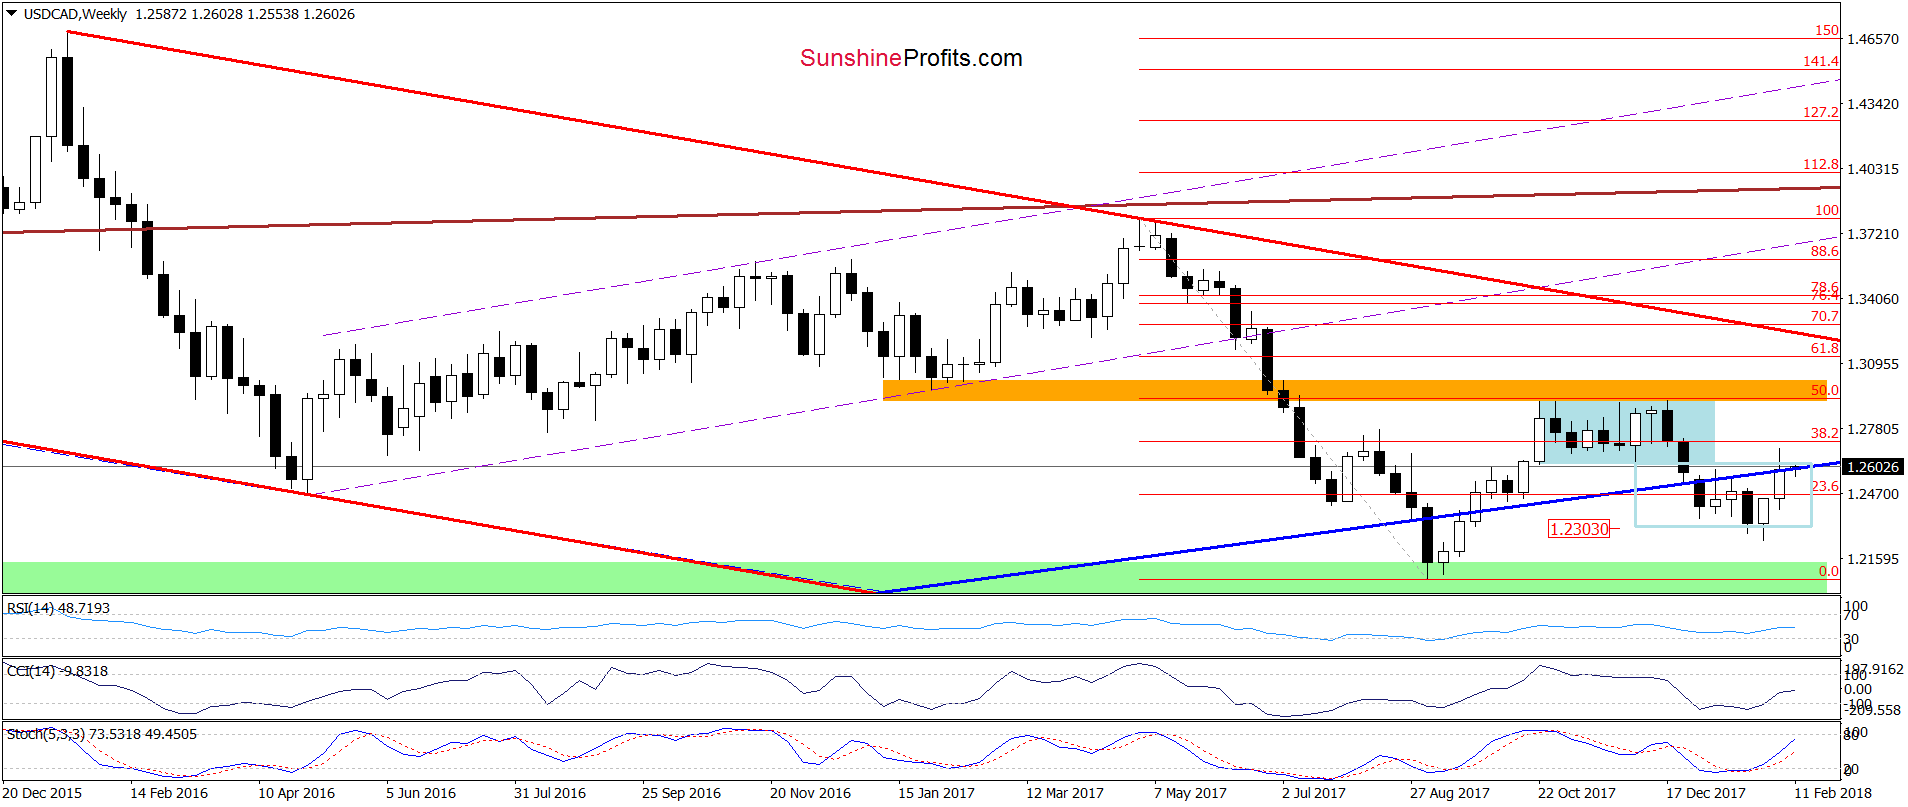
From this perspective, we see that the last week’s increase took USD/CAD to the previously-broken blue support/resistance line. When we take a closer look at the chart we see that this line was strong enough to stop currency bulls at the beginning of the previous month, which increases the probability that the history will repeat itself once again in the coming week(s).
Therefore, in our opinion, as long as there is no invalidation of the breakdown under the above-mentioned line all upswings will be nothing more than verifications of the earlier breakdown.
What does it mean for us? If we see a daily closure under the 50% Fibonacci retracement and the January peak (both seen on the daily chart), we’ll consider opening short positions.
Trading position (short-term; our opinion): no positions are justified from the risk/reward perspective now. We will keep you informed should anything change, or should we see a confirmation/invalidation of the above.
Thank you.
Nadia Simmons
Forex & Oil Trading Strategist
Przemyslaw Radomski, CFA
Founder, Editor-in-chief, Gold & Silver Fund Manager
Gold & Silver Trading Alerts
Forex Trading Alerts
Oil Investment Updates
Oil Trading Alerts

