

Thanks to the recent increases, the greenback hit a fresh 2018 high against the Canadian dollar in the previous week. But will the rally be continued in the coming days?
- EUR/USD: none
- GBP/USD: none
- USD/JPY: short (a stop-loss order at 114.68; the exit target at 112.34)
- USD/CAD:none
- USD/CHF: short (a stop loss order at 1.0192; the exit target at 0.9850)
- AUD/USD:none
EUR/USD
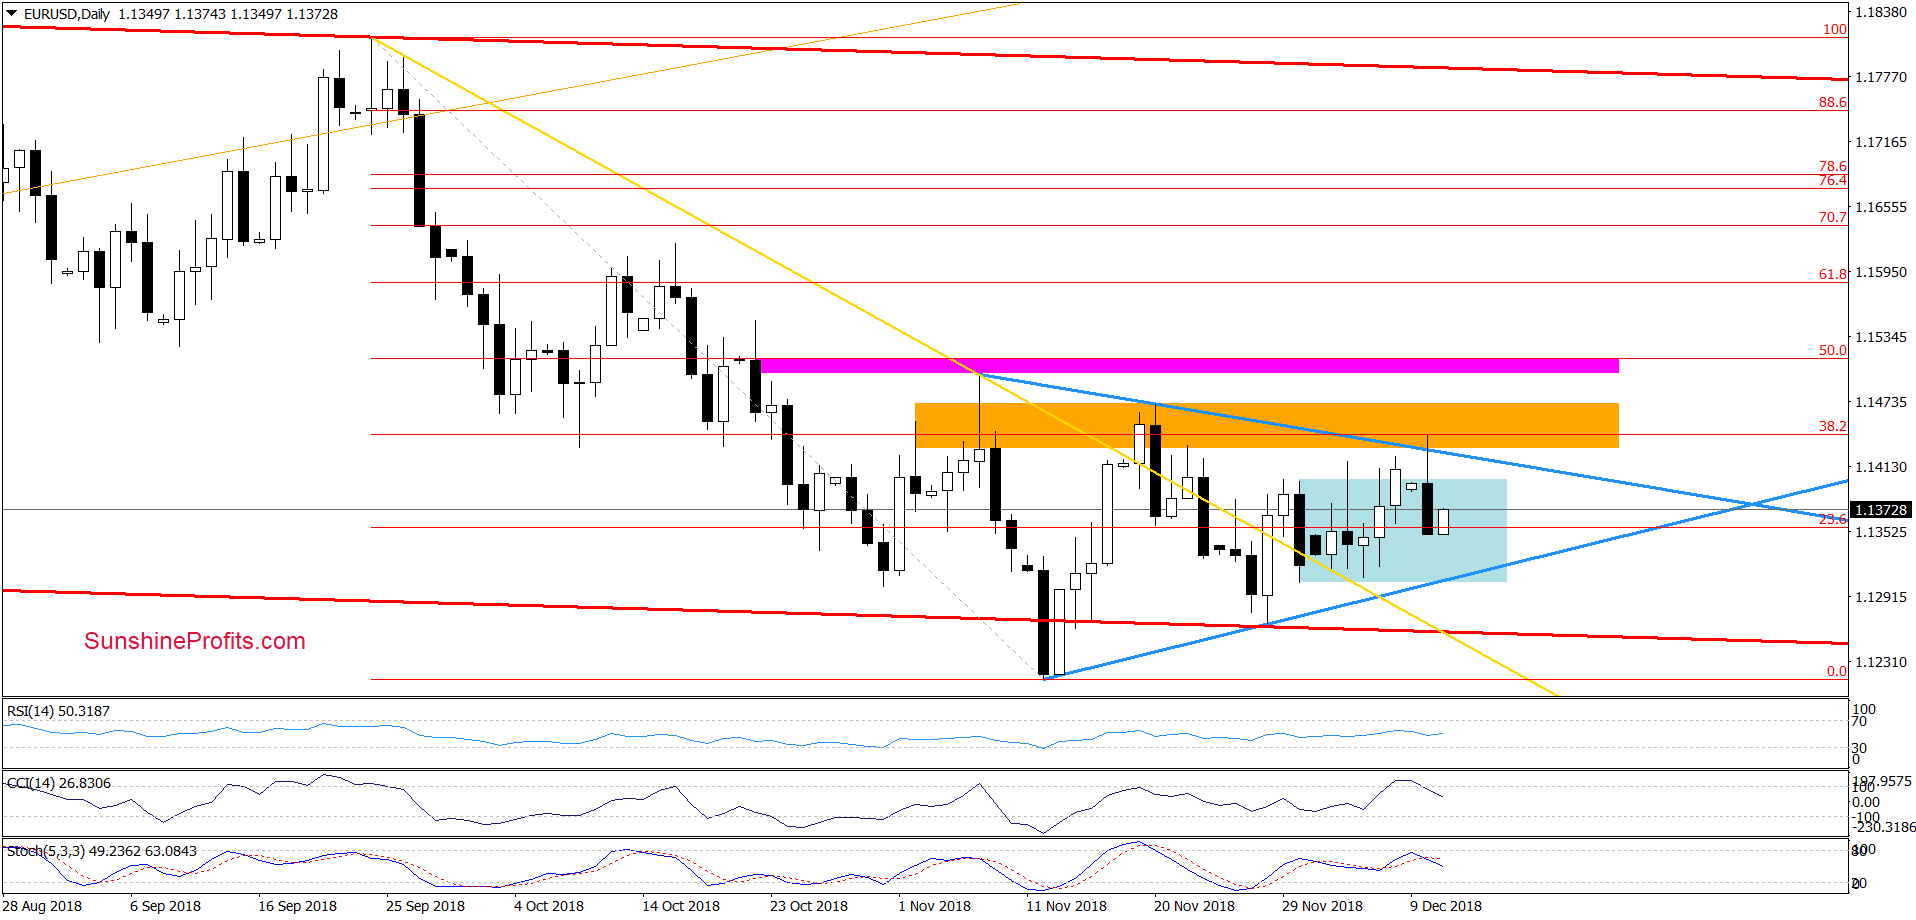
From today’s point of view, we see that the orange resistance zone (created by the previous highs and the 38.2% Fibonacci retracement) successfully stopped the bulls during yesterday’s session, triggering a quite sharp pullback.
Thanks to his drop EUR/USD invalidated two earlier breakouts: above the upper line of the blue triangle and the upper line of the blue consolidation and closed the day inside the blue consolidation. Additionally, the CCI and the Stochastic Oscillator generated sell signals, suggesting that further deterioration is just around the corner.
If this is the case and the exchange rate declines from current levels, we’ll see a test of the lower line of the consolidation and the lower border of the blue triangle in the coming days.
Finishing today’s commentary on this currency pair please keep in mind what we wrote a week ago:
(…) we continue to believe that as long as there is no breakout above the upper border of the triangle (or a breakdown under the lower line) another bigger move is not likely to be seen and short-lived moves in both directions should not surprise us in the coming days.
Trading position (short-term; our opinion): No positions are justified from the risk/reward perspective. We will keep you informed should anything change, or should we see a confirmation/invalidation of the above.
USD/CAD
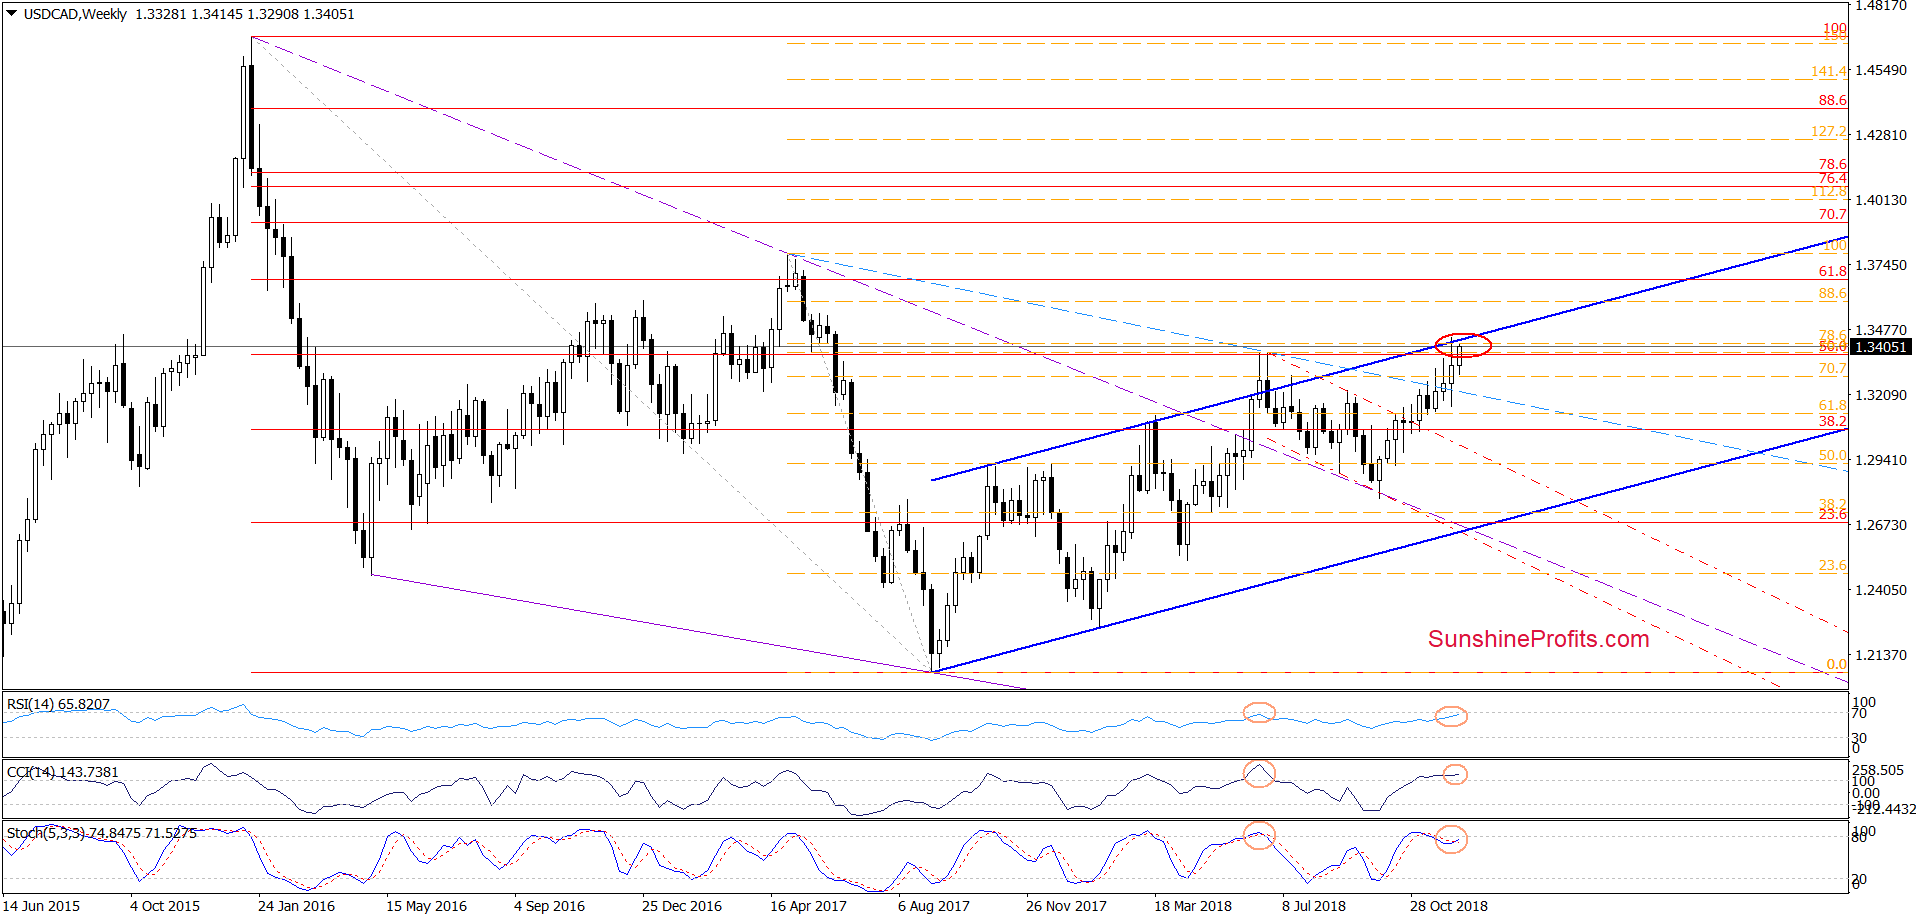
Looking at the medium-term chart, we see that USD/CAD climbed to a very important resistance area created by the 50% Fibonacci retracement based on the entire 2016-2017 downward move, the 76.4% and 78.6% Fibonacci retracements based on the late-April 2017- early-September 2017 declines and the upper border of the long-term blue rising trend channel (marked with the red ellipse).
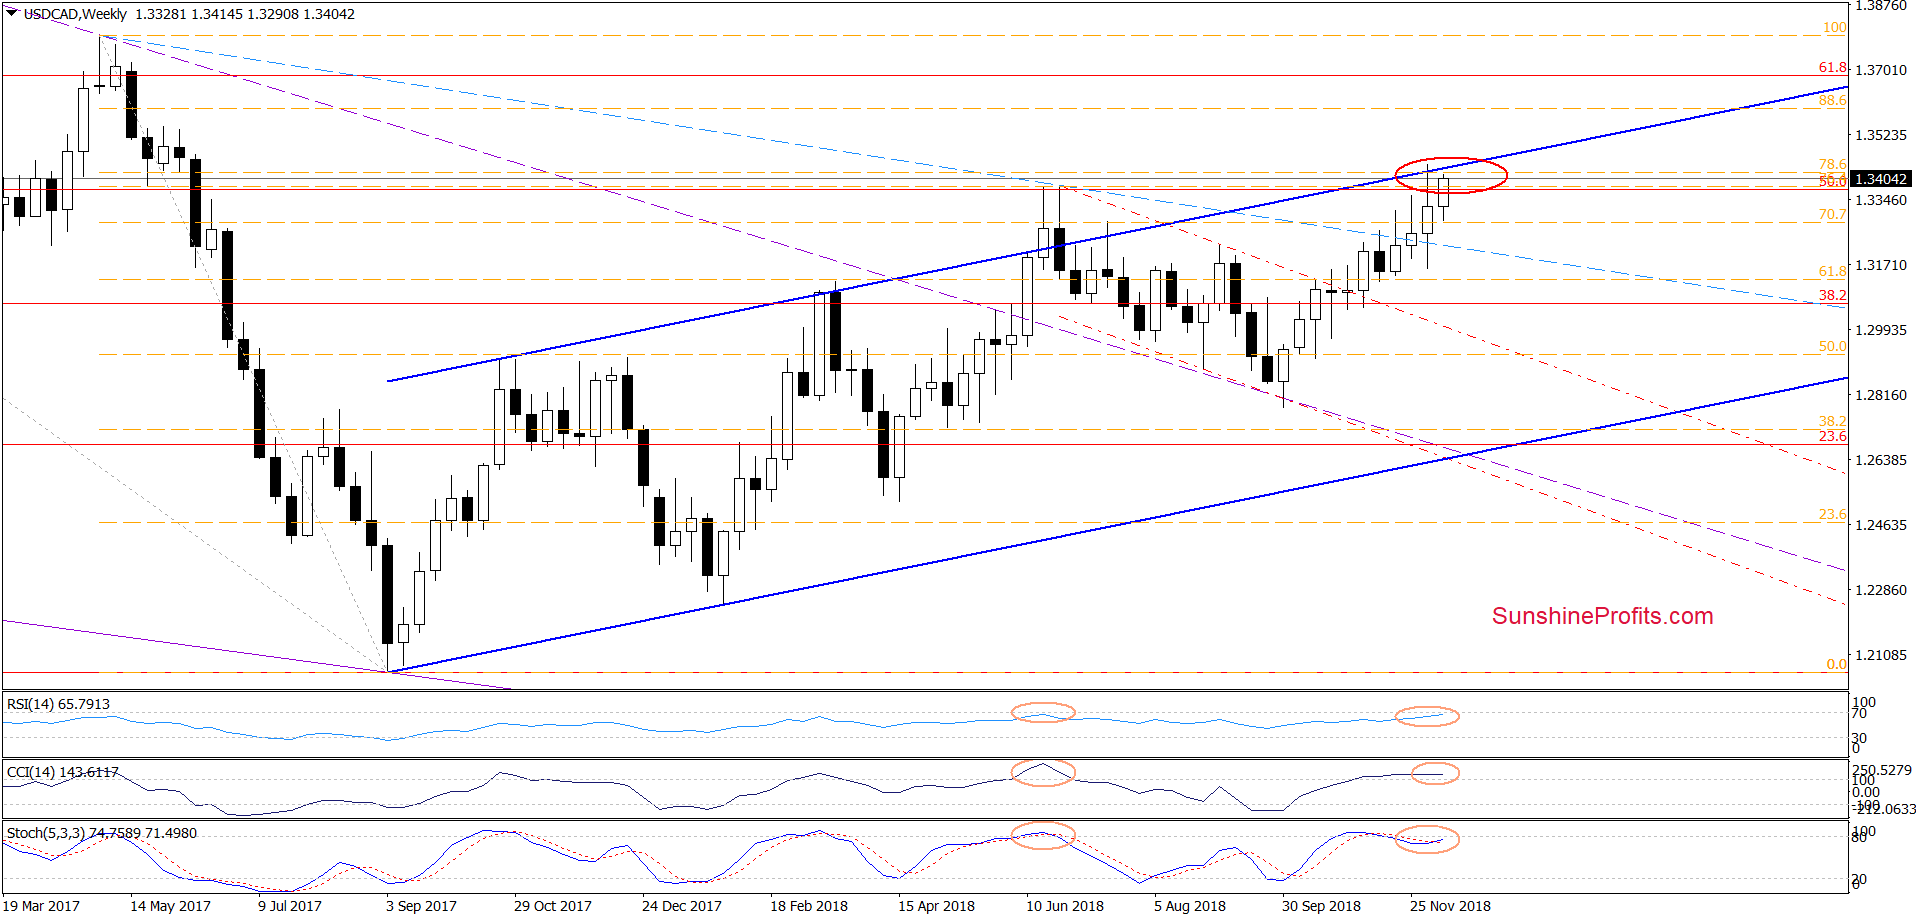
Additionally, this area is reinforced by the short-term resistances marked on the daily charts below.
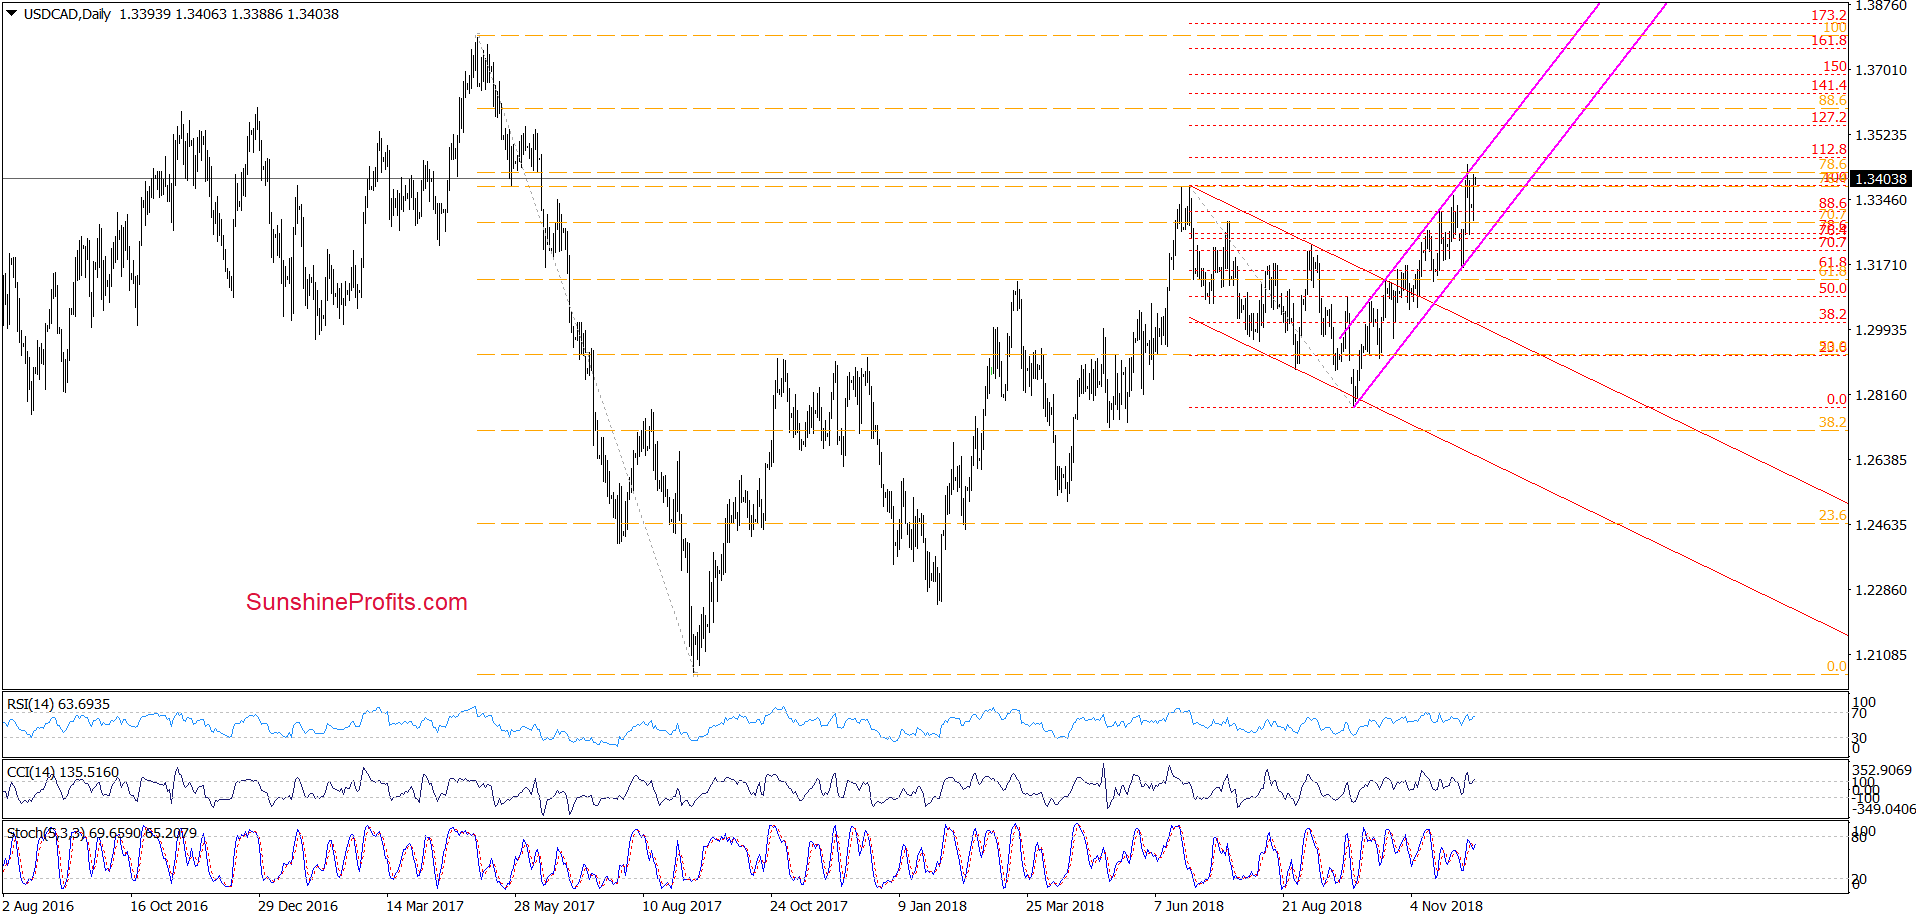
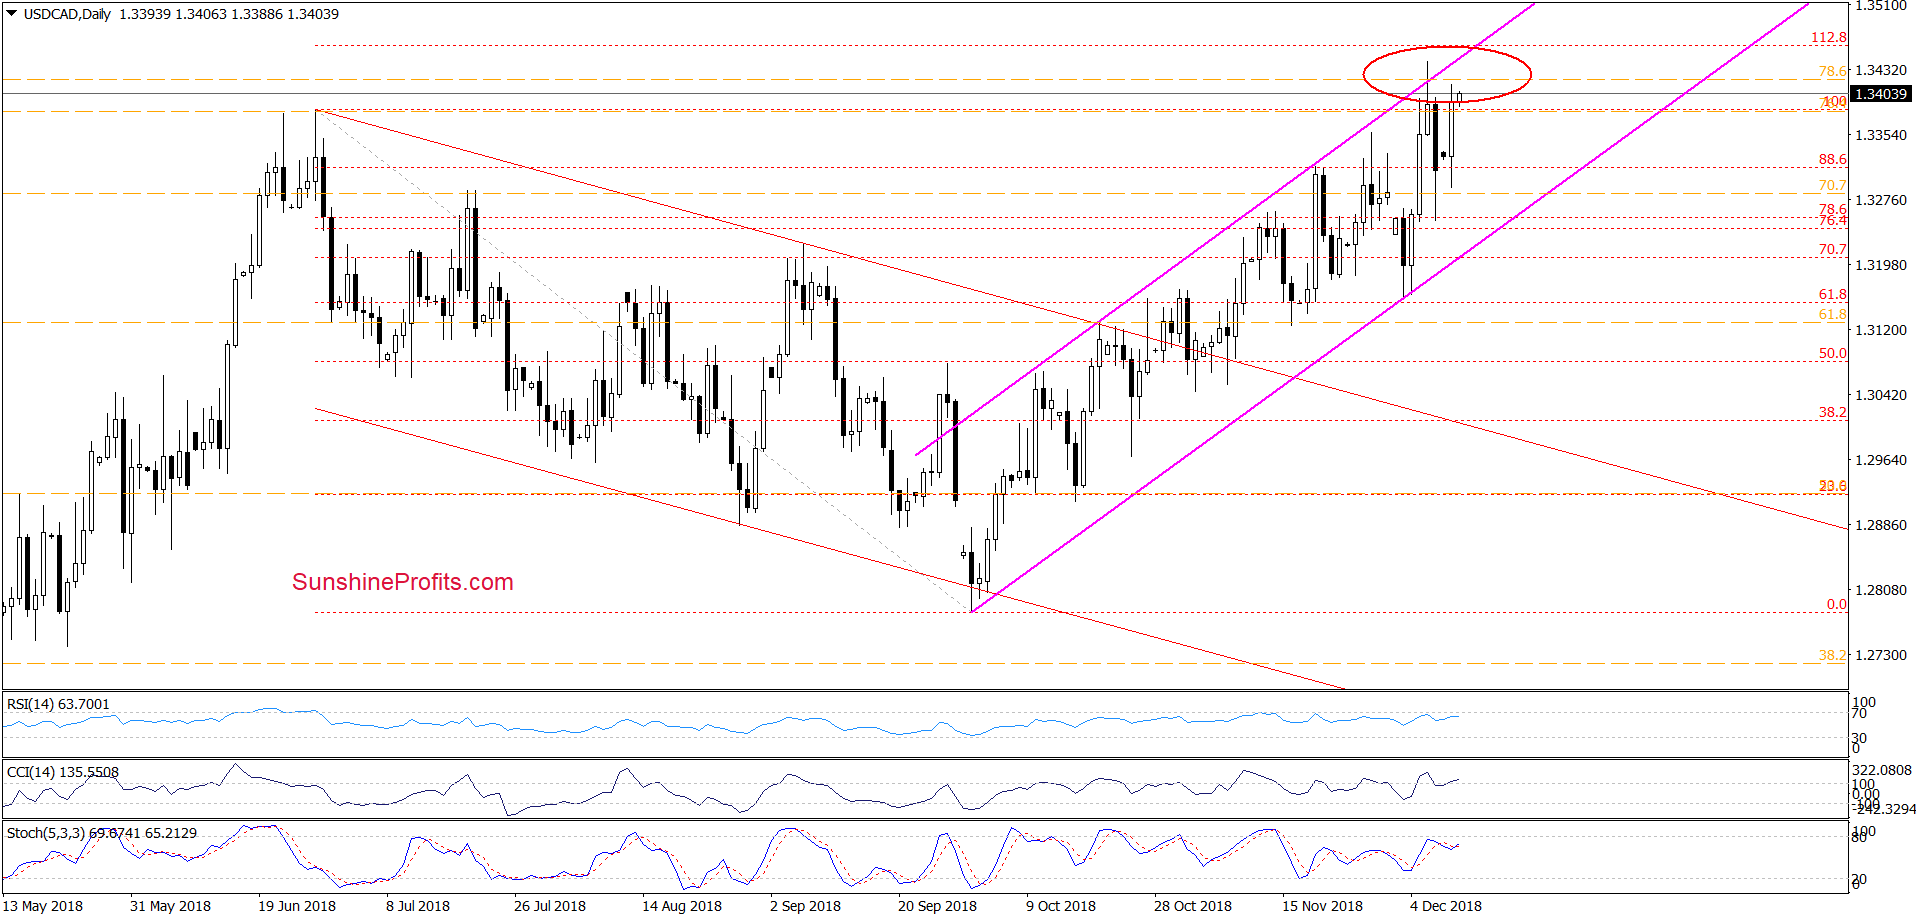
From this perspective, we see that the exchange rate increased to a red ellipse created by the upper border of the short-term pink rising trend channel, the above-mentioned medium-term resistances and the 112.8% Fibonacci extension, which together block the way to the north.
At this point it is worth noting that the combination of the Fibonacci retracements was enough to stop currency bulls two times in June and trigger a pullback, which invalidated the earlier small breakout above the upper line of the long-term blue rising trend channel seen on the weekly charts.
Taking all the above into account and combining it with the current position of the weekly and daily indicators (there are clearly visible bearish divergences) it seems to us that the history will repeat itself once again and we’ll see reversal in the very near future.
If the situation develops in tune with the above assumption and USD/CAD declines from current levels, currency bears will likely try to push the pair to the lower border of the pink rising trend channel in the following days. Nevertheless, as long as here is no successful breakdown under this support line a sizable move to the downside is not likely to be seen.
Trading position (short-term; our opinion): No positions are justified from the risk/reward perspective. We will keep you informed should anything change, or should we see a confirmation/invalidation of the above.
AUD/USD
Quoting our last commentary on this currency pair:
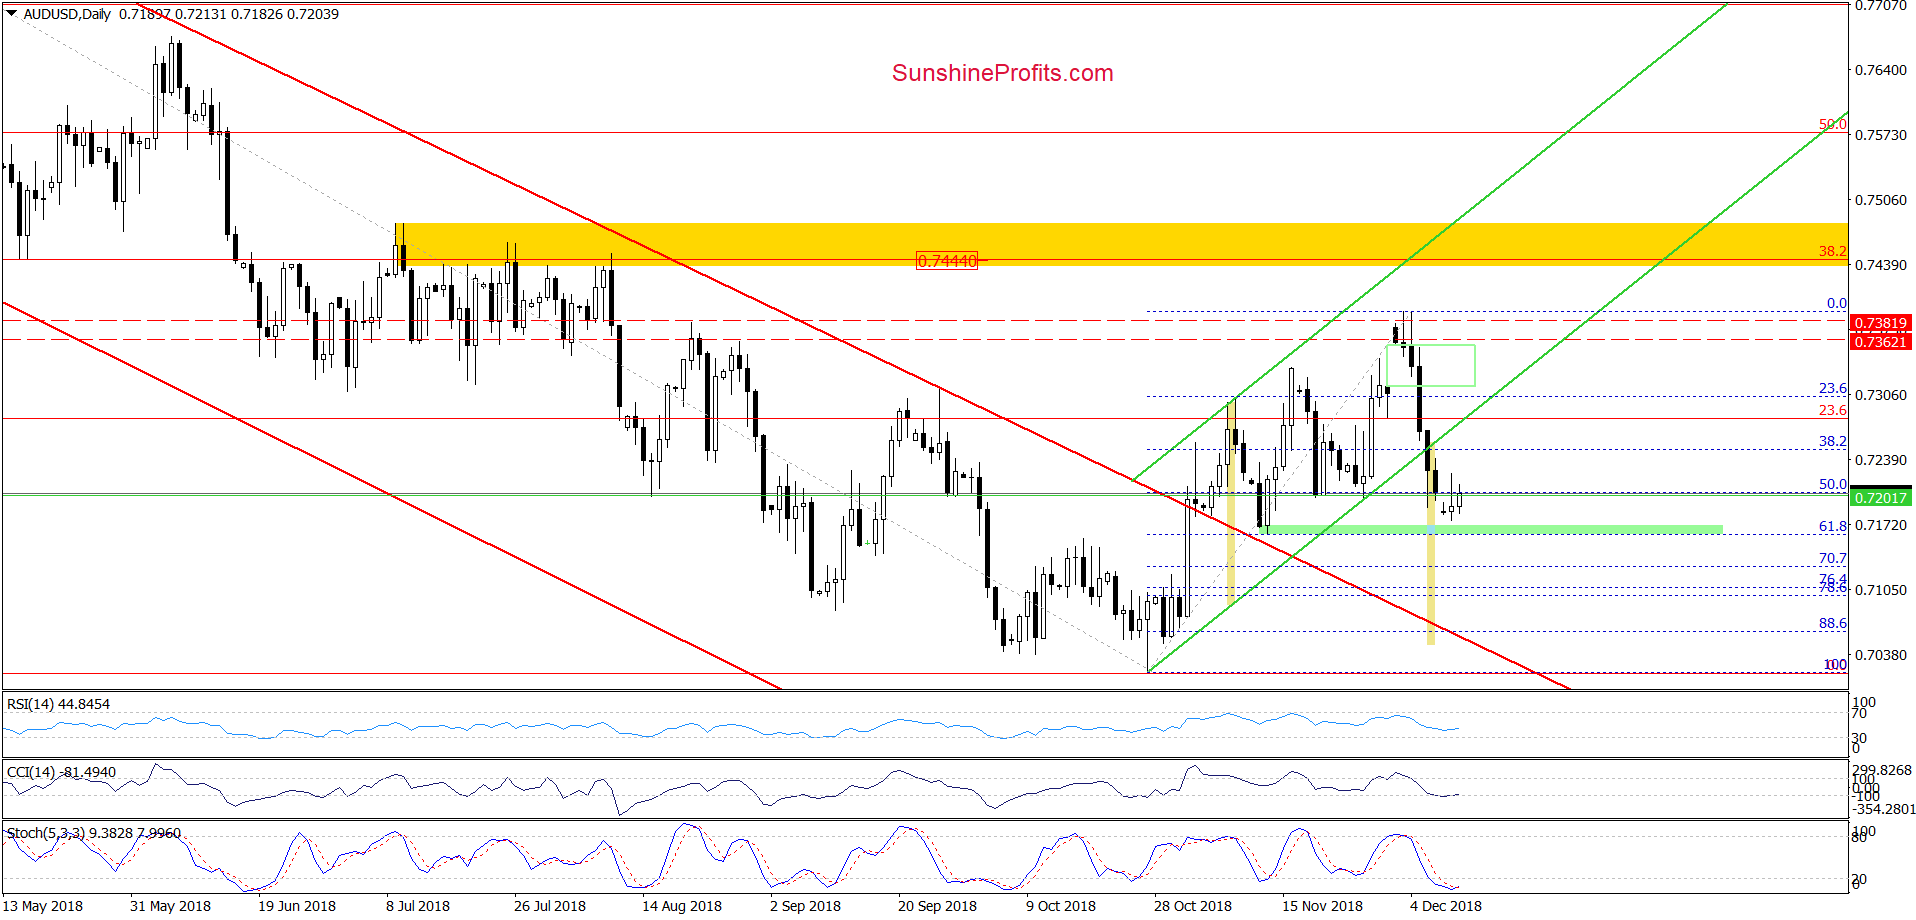
(…) In our opinion, if the pair moves lower from current levels and drops below yesterday’s low (and the 50% Fibonacci retracement), we’ll see at least a test of the green support zone based on the mid-November lows and the 61.8% retracement.
As you see on the daily chart although the exchange rate started this week with a small gap and slipped a bit lower during yesterday’s session, the proximity to the green support zone encouraged currency bulls to act.
Thanks to their action AUD/USD came back to the previously-broken 50% Fibonacci retracement and the upper border of the gap, but in our opinion, as long as there is no daily closure above these resistances all upswings could be nothing more than a verification of the earlier breakdown.
Therefore, we think that one more downswing and a test of the above-mentioned green zone is very likely in the coming days.
Trading position (short-term; our opinion): No positions are justified from the risk/reward perspective. We will keep you informed should anything change, or should we see a confirmation/invalidation of the above.
Thank you.
Nadia Simmons
Forex & Oil Trading Strategist
Przemyslaw Radomski, CFA
Founder, Editor-in-chief, Gold & Silver Fund Manager
Gold & Silver Trading Alerts
Forex Trading Alerts
Oil Investment Updates
Oil Trading Alerts

