

Although currency bulls pushed the U.S. dollar against the yen to the highest levels since the beginning of October, the major resistance zone managed to stop them for the fifth time in a row, triggering a correction. What are the consequences of this price action?
- EUR/USD: none
- GBP/USD: none
- USD/JPY: short (a stop-loss order at 114.62; the initial downside target at 111.84)
- USD/CAD: short (a stop-loss order at 1.3401; the initial downside target at 1.2934)
- USD/CHF: short (a stop loss order at 1.0192; the initial downside target at 0.9881)
- AUD/USD: none
EUR/USD
In our Wednesday’s commentary on this currency pair, we wrote the following:
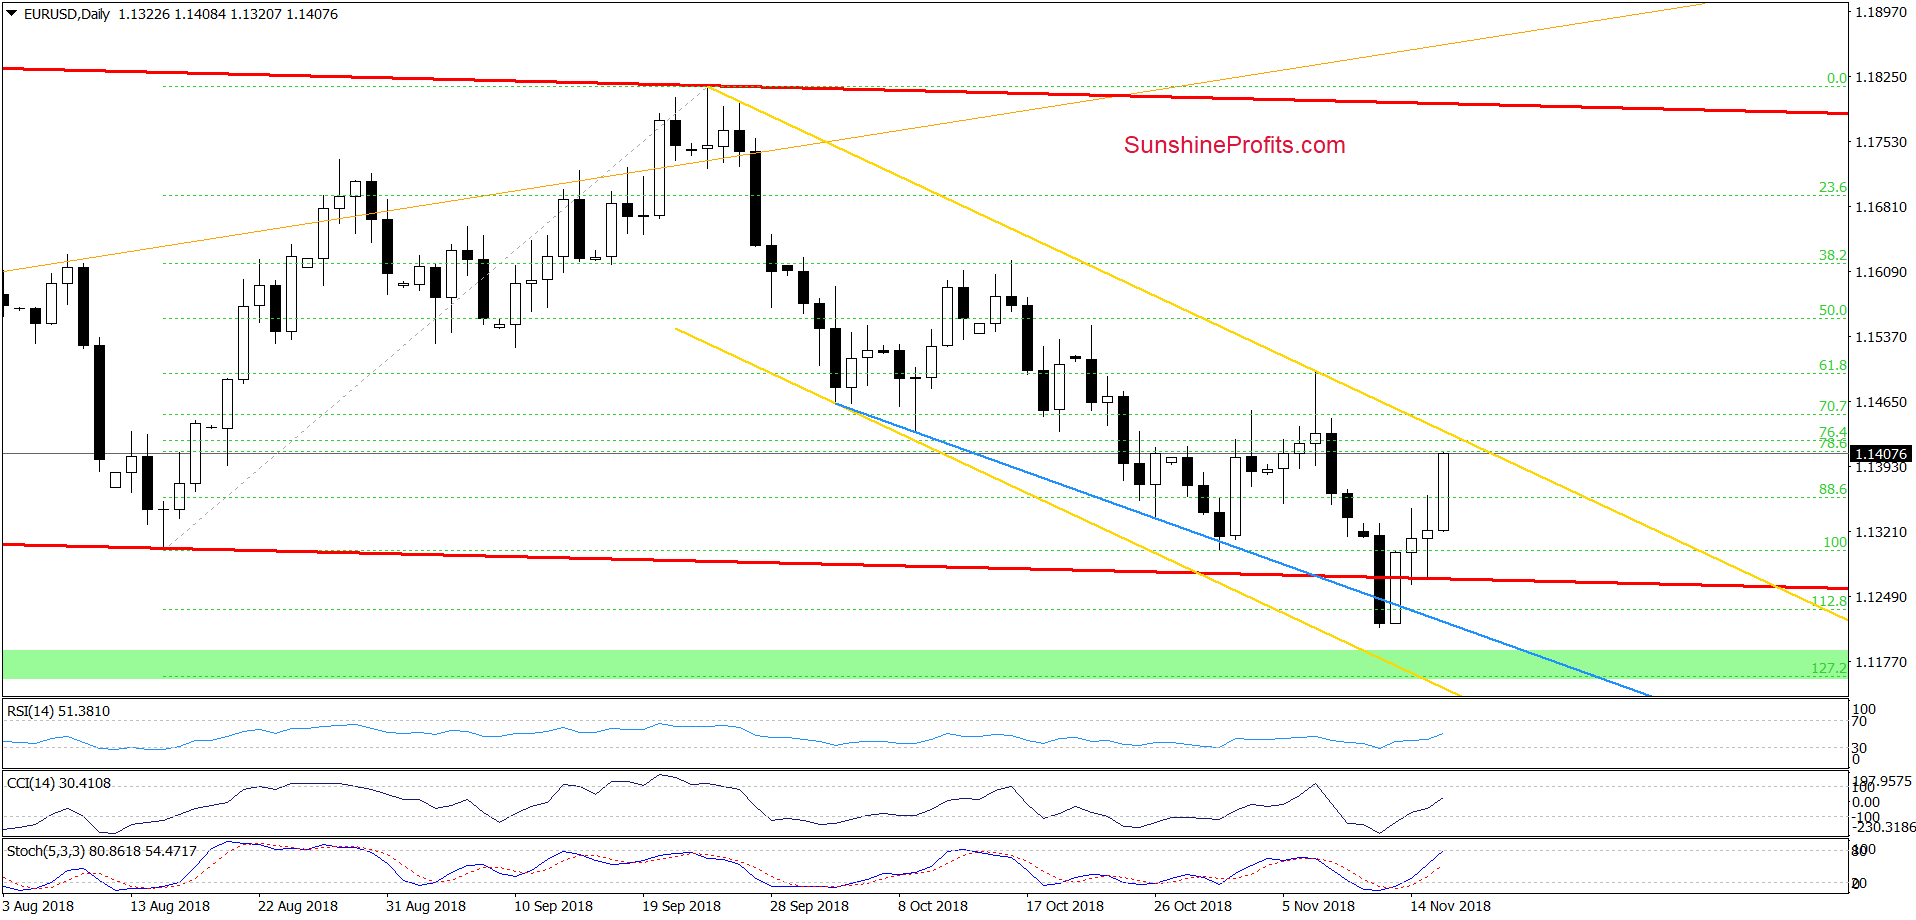
(…) currency bulls triggered a rebound, which took EUR/USD above the lower line of the red trend channel and resulted in an invalidation of the earlier breakdown.
Earlier today, the pair verified yesterday’s move, which in combination with the current position of the daily indicators suggests that another upswing may be just around the corner.
(…) if the situation develops in line with this scenario, currency bulls will likely test the short-term yellow resistance line in the very near future.
From today’s point of view, we see that the situation developed in tune with the above scenario and EUR/USD extended gains earlier today, erasing most of the recent downward move.
Additionally, the buy signals generated by the daily indicators remain in the cards, supporting the buyers and the realization of our Wednesday’s scenario in the very near future.
Trading position (short-term; our opinion): No positions are justified from the risk/reward perspective after the stop-loss order closed our short positions.
USD/JPY
Quoting our Wednesday’s alert:
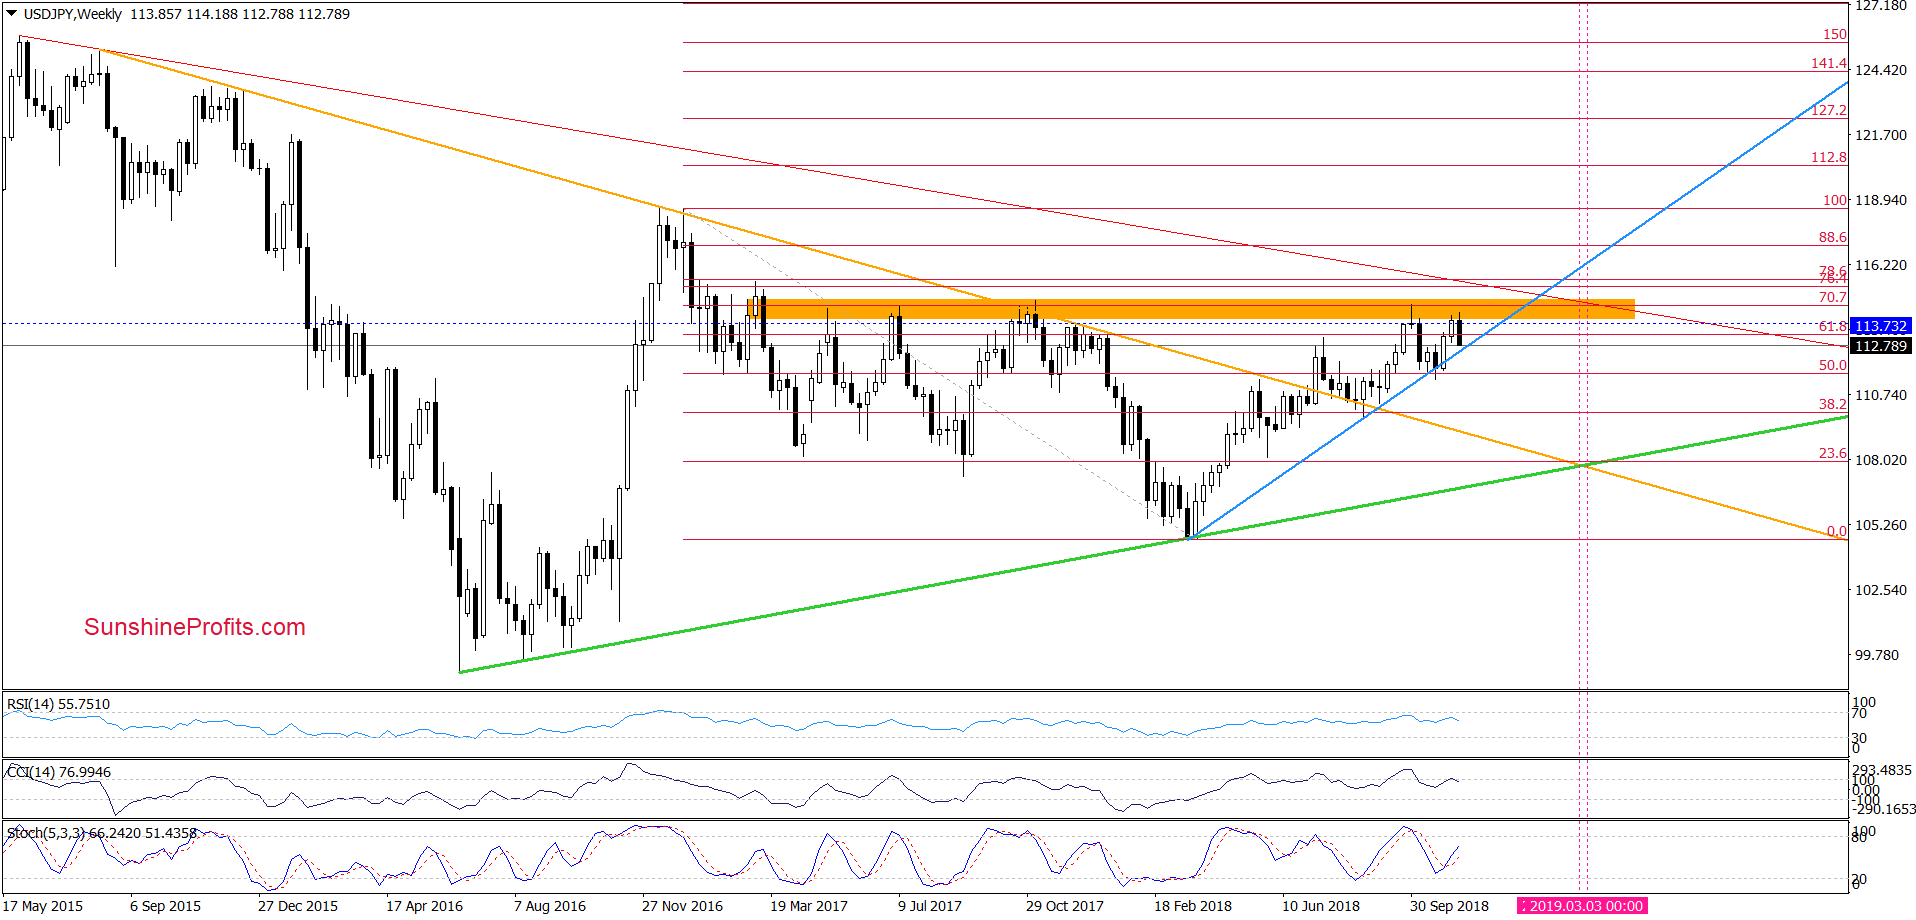
(…) USD/JPY increased a bit recently, which caused a climb to the orange resistance, which serves as the major resistance since March 2017.
Therefore, in our opinion, as long as there is no successful breakout above it another reversal and lower values of the exchange rate are more likely than not.
Looking at the weekly chart, we see that the major resistance stopped the buyers once again triggering a decline and erasing the last week’s rebound.
How did this price action affect the daily chart?
Before we answer to this question, lets recall the quotes from our last commentary on USD/JPY:
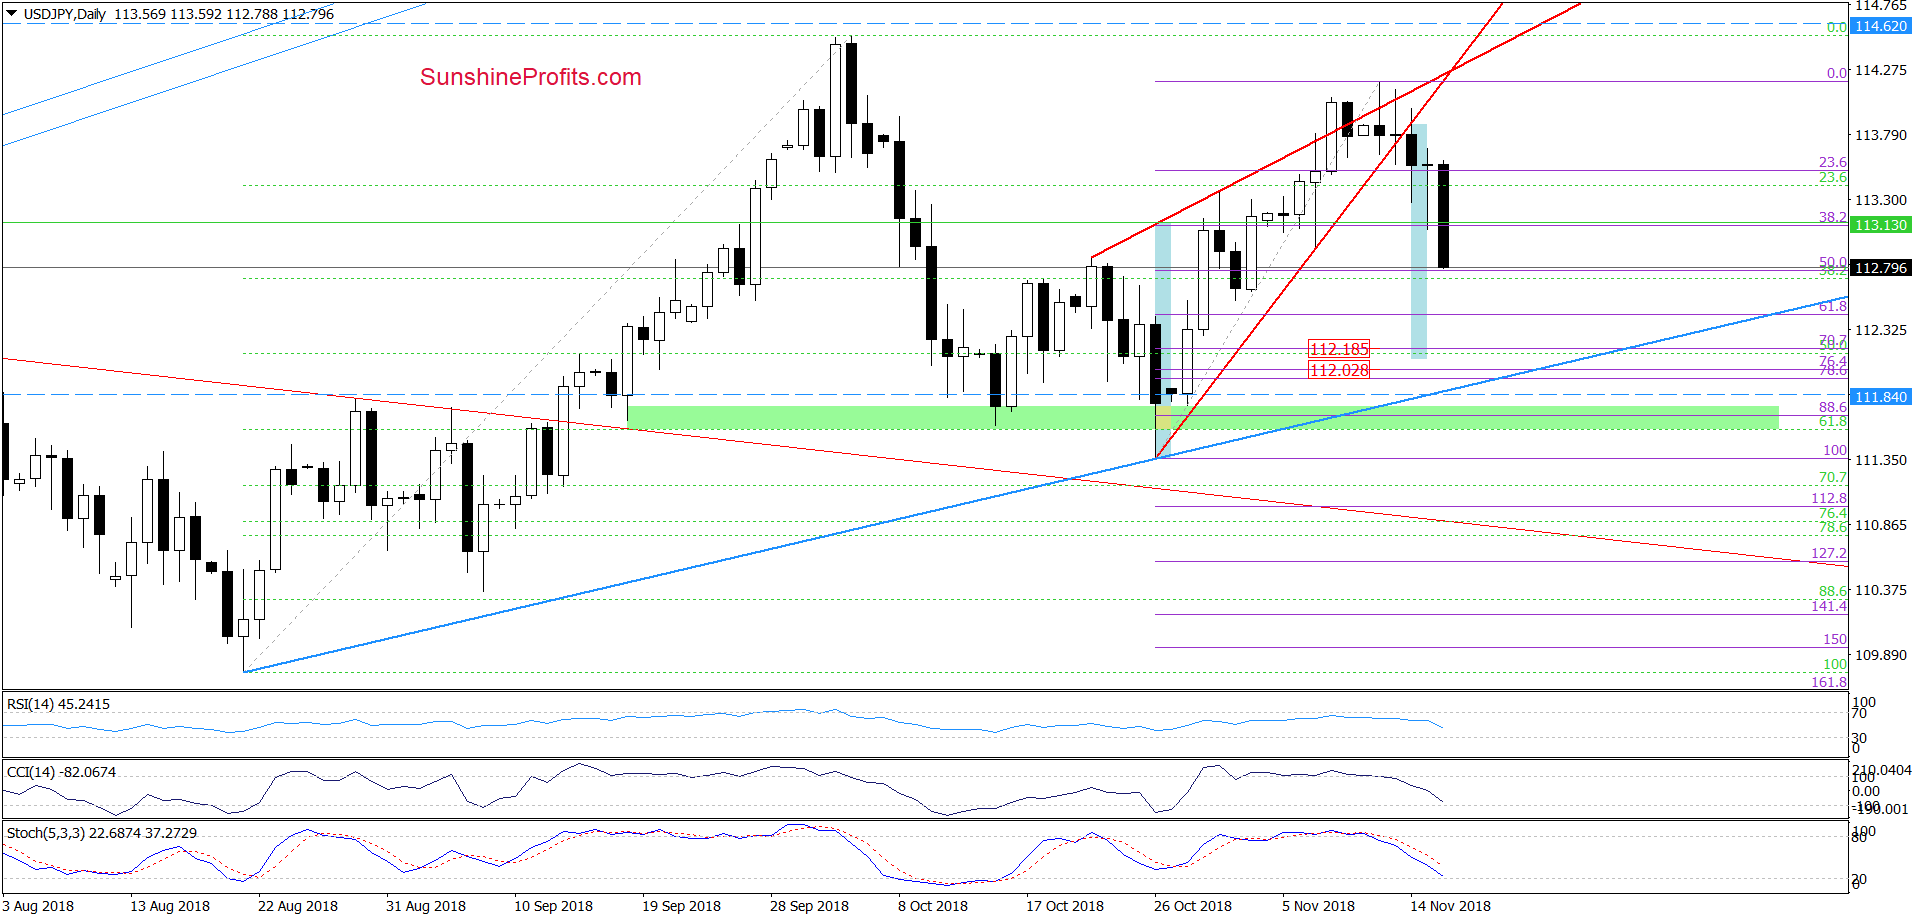
(…) although currency bulls tried to go higher in recent days, the upper border of the red rising wedge stopped them, triggering pullbacks. Additionally, the sell signals generated by the indicators remain in the cards, suggesting that one more move to the downside is just around the corner.
If this is the case and USD/JY declines from current levels, we’ll likely see a drop to the November lows around 112.63 or even a downward move to the green support area created by the late-October lows and the 61.8% Fibonacci retracement.
As you see on the very short-term chart, the situation developed in line with our assumptions and USD/JPY closed Wednesday’s session under the lower border of the red rising wedge. This negative development encouraged currency bears to act, which resulted in a sharp decline earlier today, which made our short positions profitable.
Taking this fact into account and combining it with the sell signals generated by the indicators, we believe that we’ll see a realization of the above-mentioned scenario in the very near future.
Trading position (short-term; our opinion): Profitable short positions with a stop-loss order at 114.62 and the initial downside target at 111.84 are justified from the risk/reward perspective.
AUD/USD
On Wednesday, we wrote:
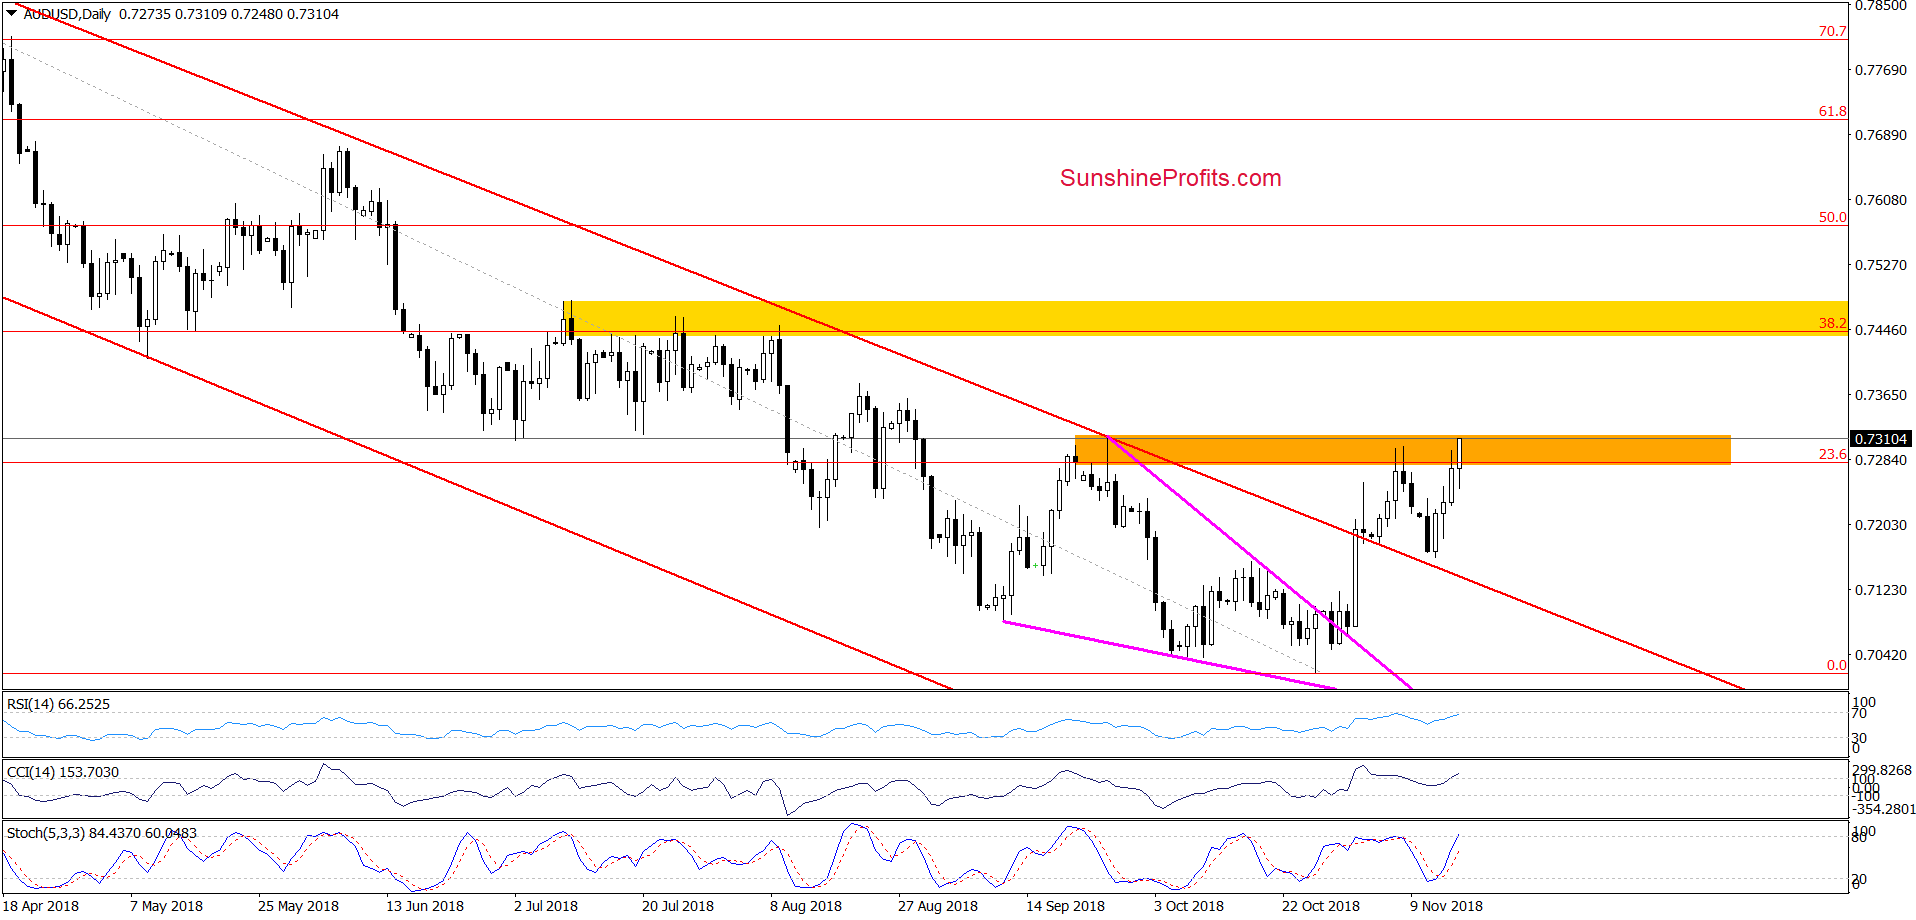
(…) AUD/USD (…) approached (…) our downside target. As you see, the red support line triggered a rebound during yesterday’s session and the Stochastic Oscillator generated a buy signal, suggesting that another attempt to move higher may be just around the corner.
If this is the case and the pair increases from current levels, we’ll likely see a re-test of the strength of the orange resistance zone in the very near future.
From the very short-term perspective, we see that currency bulls pushed the exchange rate higher (as we had expected), which caused not only a test, but also a breakout above the last week’s high. In this way, the exchange rate climbed to the upper line of the orange resistance zone and the September peak, while the buy signals generated by the indicators continue to support the bulls.
What does such price action mean for AUD/USD?
In our opinion, if the buyers manage to close today’s session above the orange zone, the way to the 38.2% Fibonacci retracement (around 0.7444) and the yellow resistance zone will be open. If the situation develops in line with this assumption, we’ll consider opening long positions.
Trading position (short-term; our opinion): None positions are justified from the risk/reward perspective.
Thank you.
Nadia Simmons
Forex & Oil Trading Strategist
Przemyslaw Radomski, CFA
Founder, Editor-in-chief, Gold & Silver Fund Manager
Gold & Silver Trading Alerts
Forex Trading Alerts
Oil Investment Updates
Oil Trading Alerts

