

Recent days took the greenback above several resistances. Despite this improvement, something wrong happened with the buyers’ strength and the USD Index turned back to the south yesterday. One-day drop or something more? Will the current situation in our currency pairs give us the answer to this question?
In our opinion the following forex trading positions are justified - summary:
EUR/USD
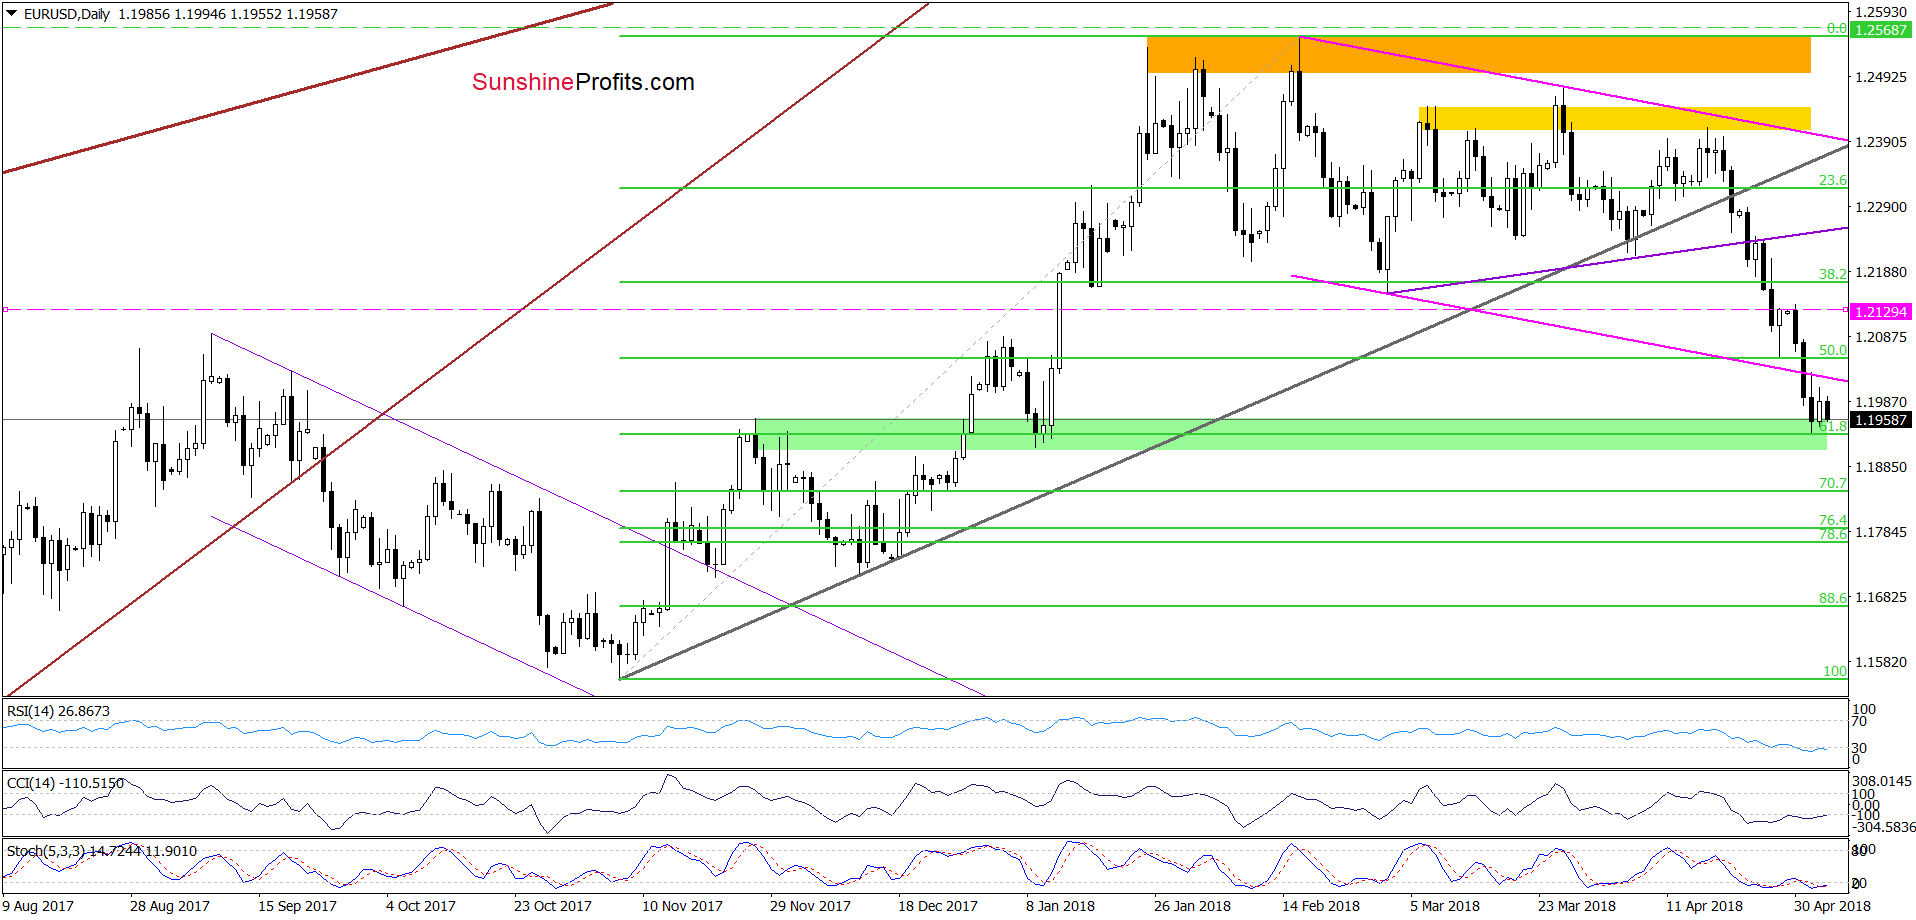
Yesterday’s session gave currency bulls hope after EUR/USD bounced off the green support zone (created by the November and December 2017 highs, the January 2018 lows and the 61.8% Fibonacci retracement). Nevertheless, their happy didn’t last long as their opponents came back to the market and took the exchange rate lower earlier today, erasing most of yesterday’s increase.
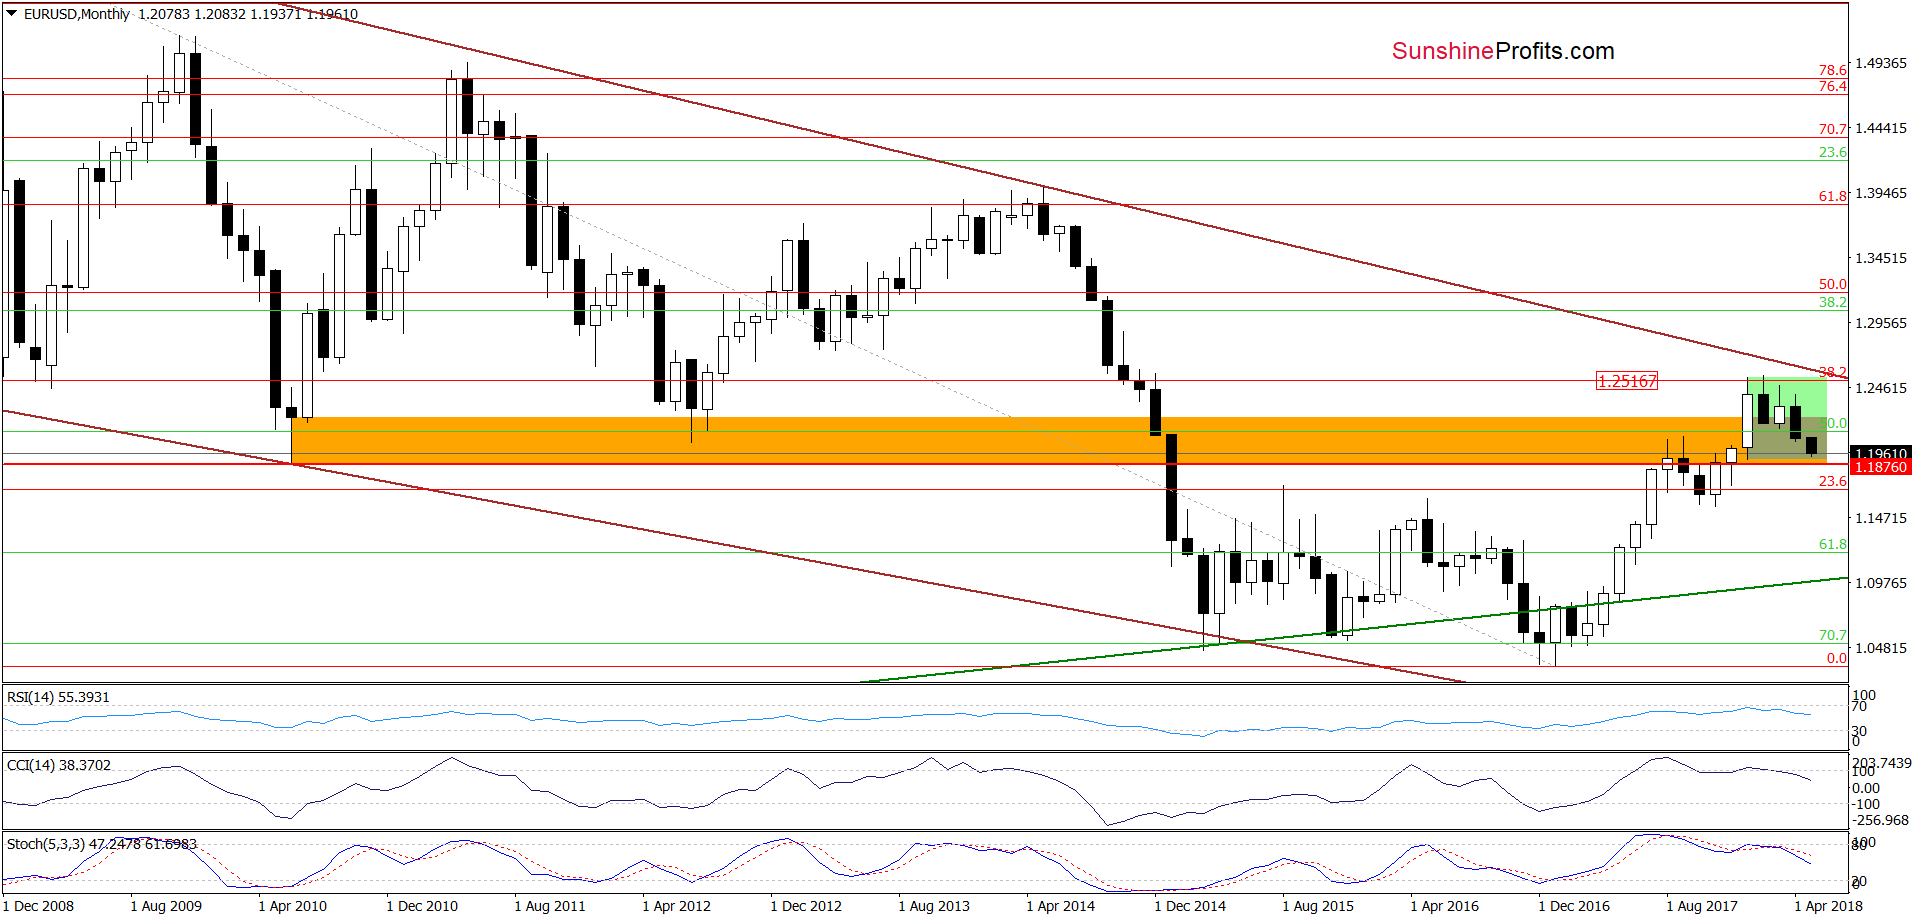
Such price action doesn’t look encouraging from the buyers’ point of view and suggests a re-test of the Wednesday’s low or even the lower border of the support zone based on the January low, which is also the lower line of the green consolidation marked on the monthly chart below.
What all the above means for EUR/USD? From the long- and short-term point of view, the space for losses seems limited (especially when we factor in the position of the daily indicators) and reversal is just around the corner.
Nevertheless, currency bulls didn’t show a clearly visible strength, which could justify opening long positions. Therefore, we decided to wait at the sidelines for more convincing signals (like an invalidation of the breakdown under the lower border of the pink declining trend channel). If we see such price action, we’ll consider opening long positions.
Trading position (short-term; our opinion): No positions are justified from the risk/reward perspective. We will keep you informed should anything change, or should we see a confirmation/invalidation of the above.
GBP/USD
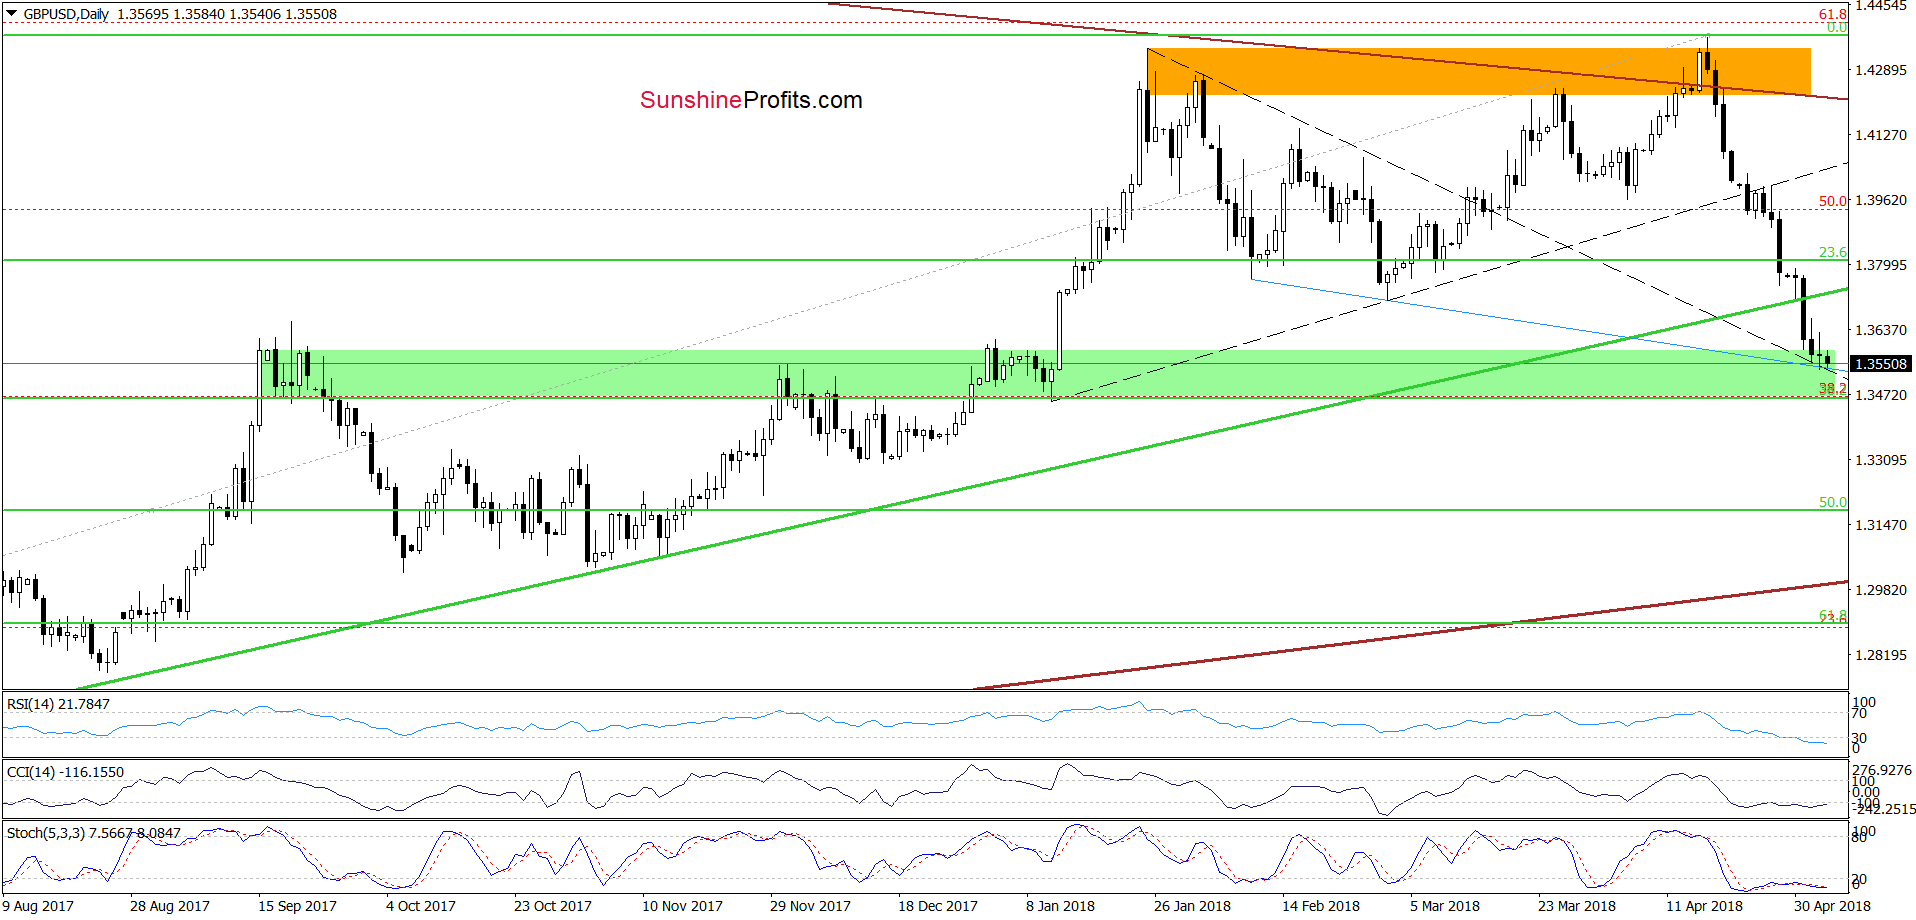
From today’s point of view, we see that although GBP/USD wavers between tiny gains and losses, the green support zone created by the September, December and early January highs, which is also reinforced by the 38.2% Fibonacci retracement (based on the entire 2017-2018 upward move), the blue support line based on the previous lows and the upper line of the black triangle (marked with dashed lines) continues to keep declines in check.
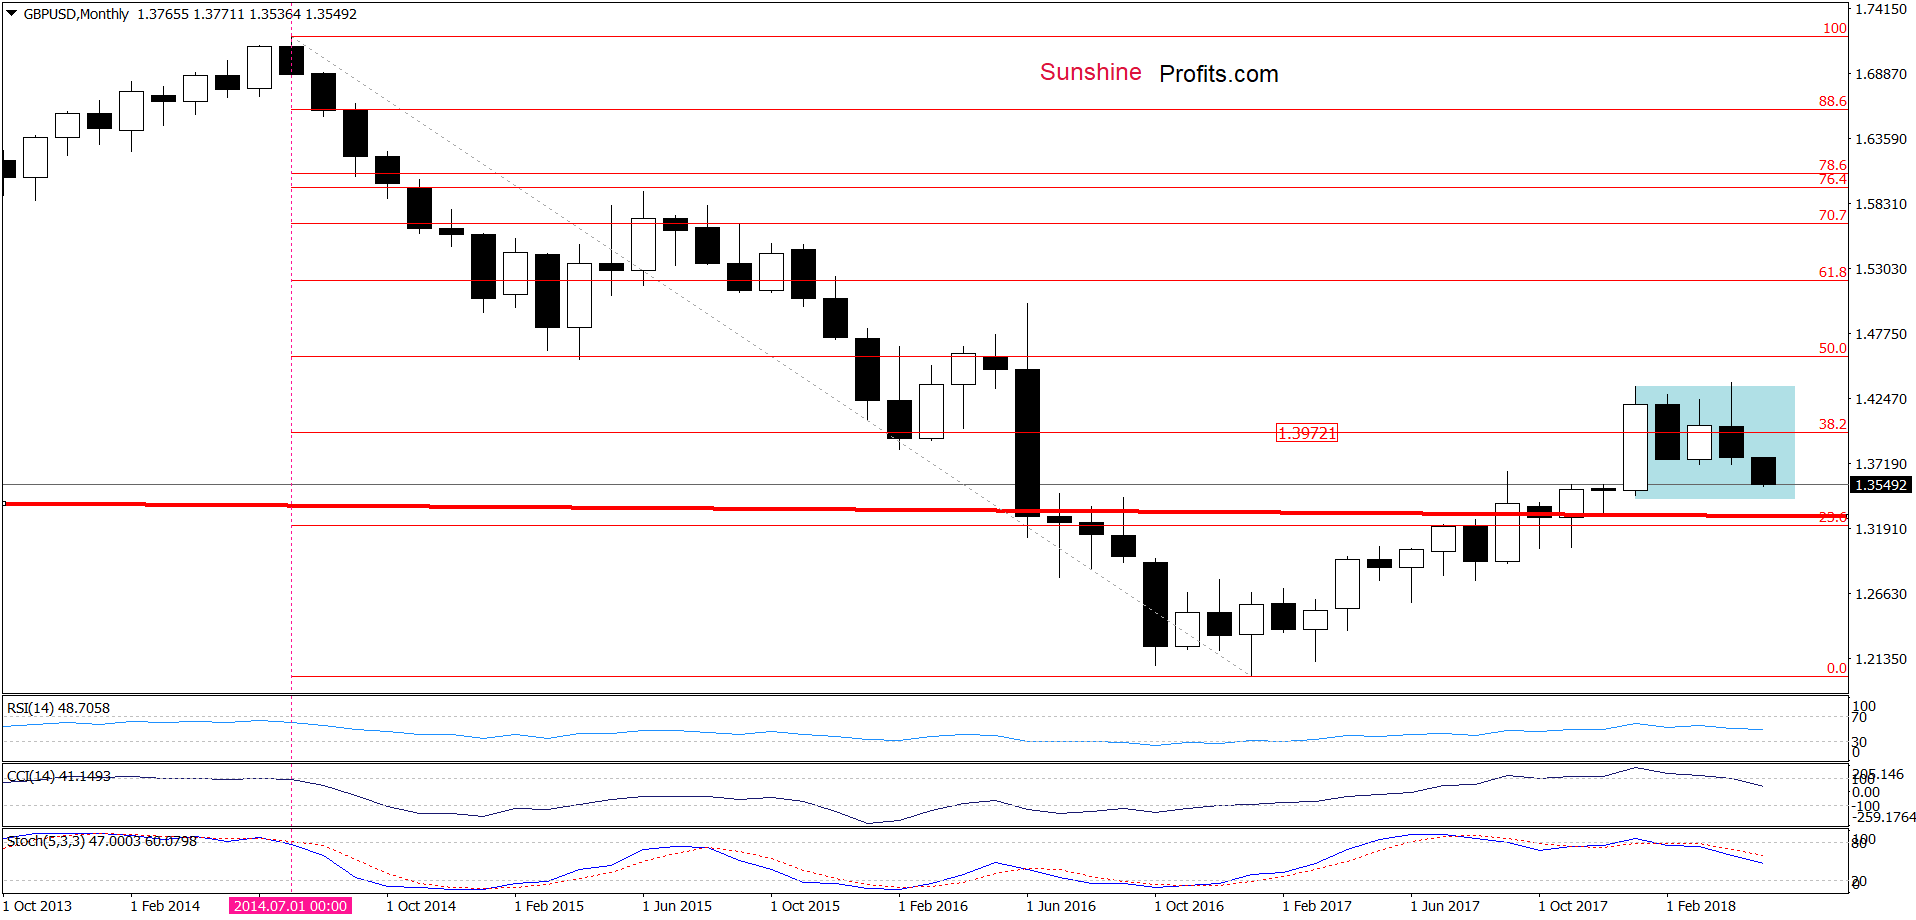
Additionally, when we take a closer look at the long-term chart, we clearly see that the pair is also trading in a consolidation (marked with blue) just like EUR/USD, which increases the probability that we’ll see a rebound after a drop (or even approachment) to the lower border of the formation.
Taking all the above into account and combining it with the position of the daily indicators and similarity to the price action, which we saw in the case of EUR/USD, we think that the buyers will take action in this area and stop their opponents. If the situation develops in line with this assumption, we’ll likely open long positions.
Trading position (short-term; our opinion): No positions are justified from the risk/reward perspective. We will keep you informed should anything change, or should we see a confirmation/invalidation of the above.
USD/JPY
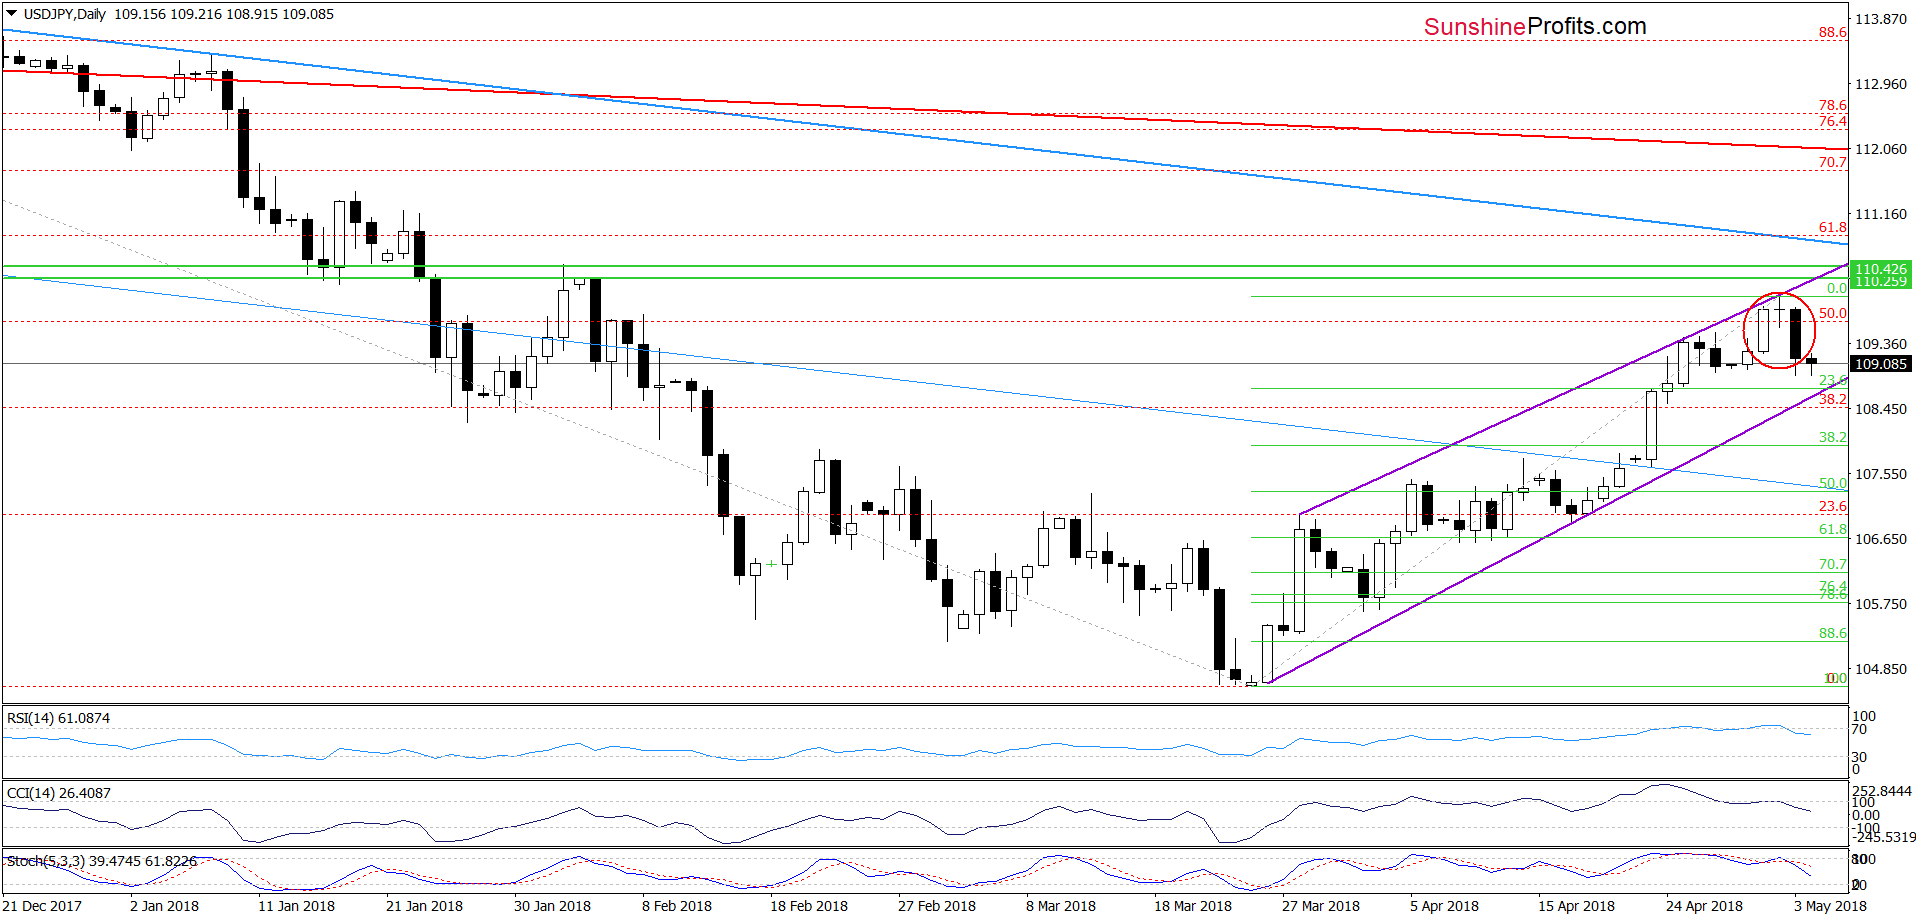
Looking at the above chart, we see that the combination of the 50% Fibonacci retracement and the upper border of the purple rising trend channel encouraged currency bears to act during yesterday’s session.
Thanks to their attack, USD/JPY moved sharply lower, creating an evening star on the daily chart (a bearish reversal candlestick formation). Additionally, all daily indicators generated sell signals, increasing the probability of further declines in the coming days.
Nevertheless, looking at the very short-term chart, we see that not far from current levels currency bears will have to face with the lower border of the purple rising trend channel, which serves as the nearest support.
Therefore, we think that as long as this support keeps losses in check another bigger move to the downside is questionable. Nevertheless, if we see breakdown under this support line, we’ll consider opening short positions.
Finishing today’s commentary on this currency pair, we would like to add a short note about the medium-term chart, which could give us more arguments to go short.
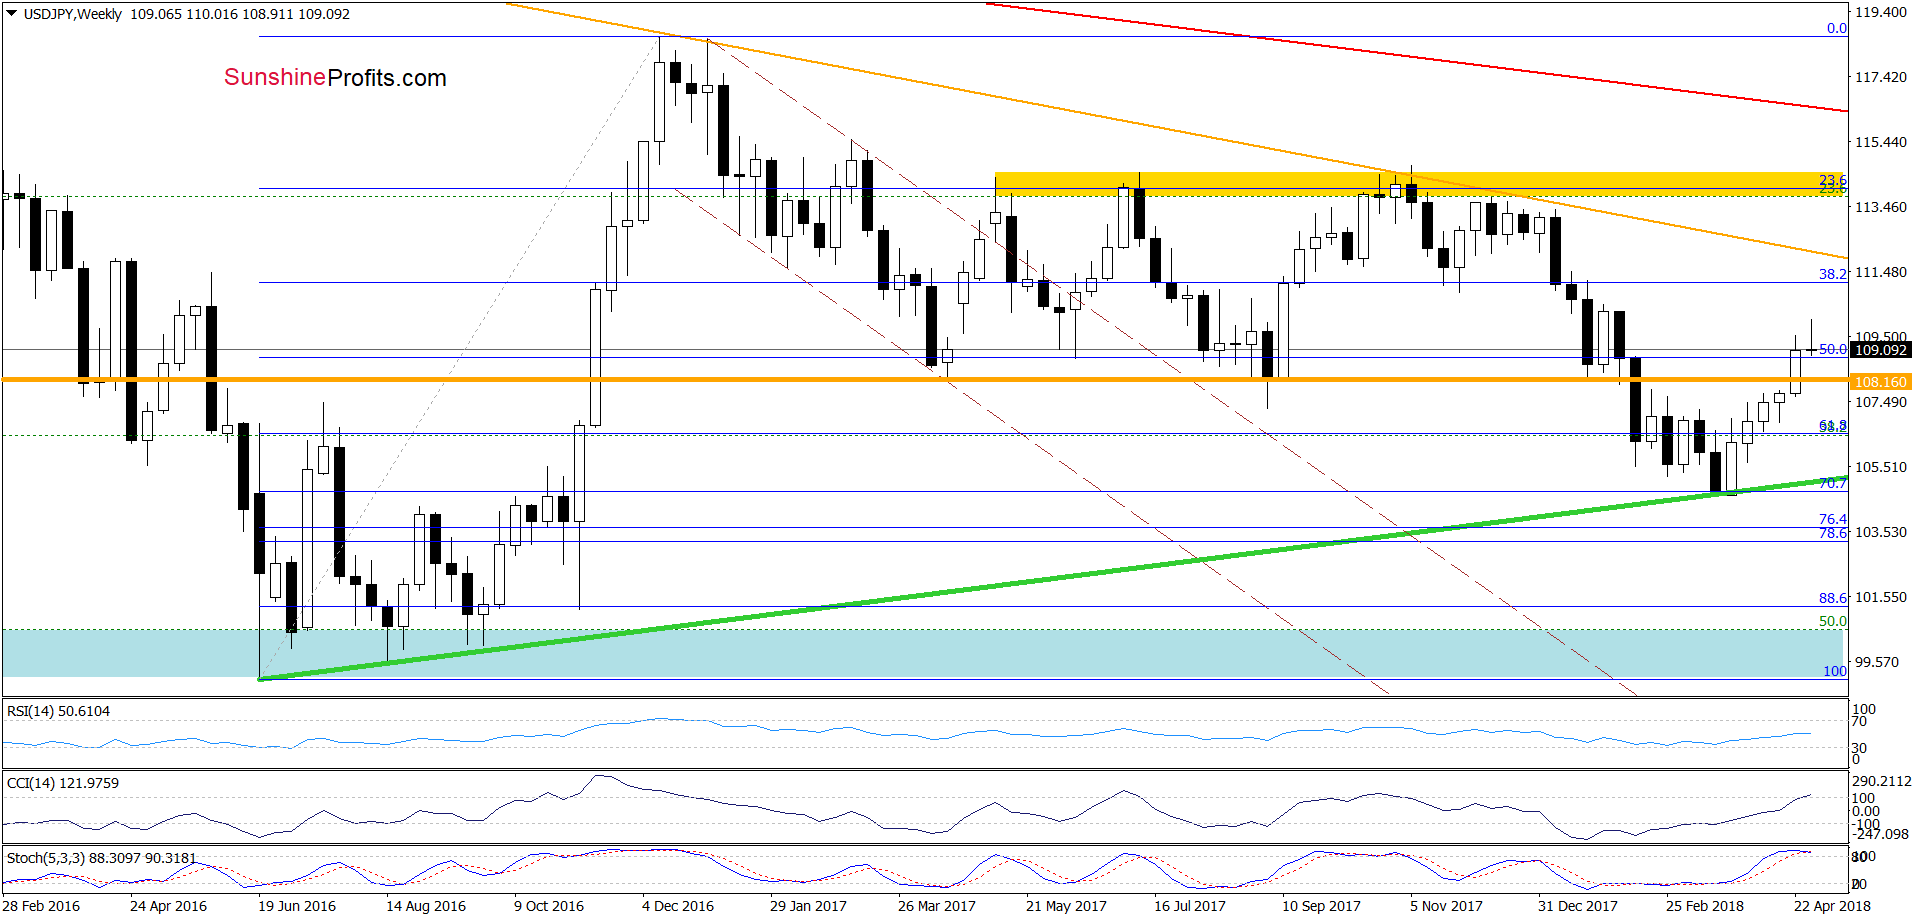
From the weekly perspective, we see that currency bears are on the good way to create a reversal candlestick, the CCI climbed to its overbought area, while the Stochastic Oscillator is very close to generating a sell signal.
All these factors increase the probability that we’ll see another move to the downside in the coming week (especially if USD/JPY closes today’s session and the whole week below current levels).
Trading position (short-term; our opinion): No positions are justified from the risk/reward perspective. We will keep you informed should anything change, or should we see a confirmation/invalidation of the above.
AUD/USD
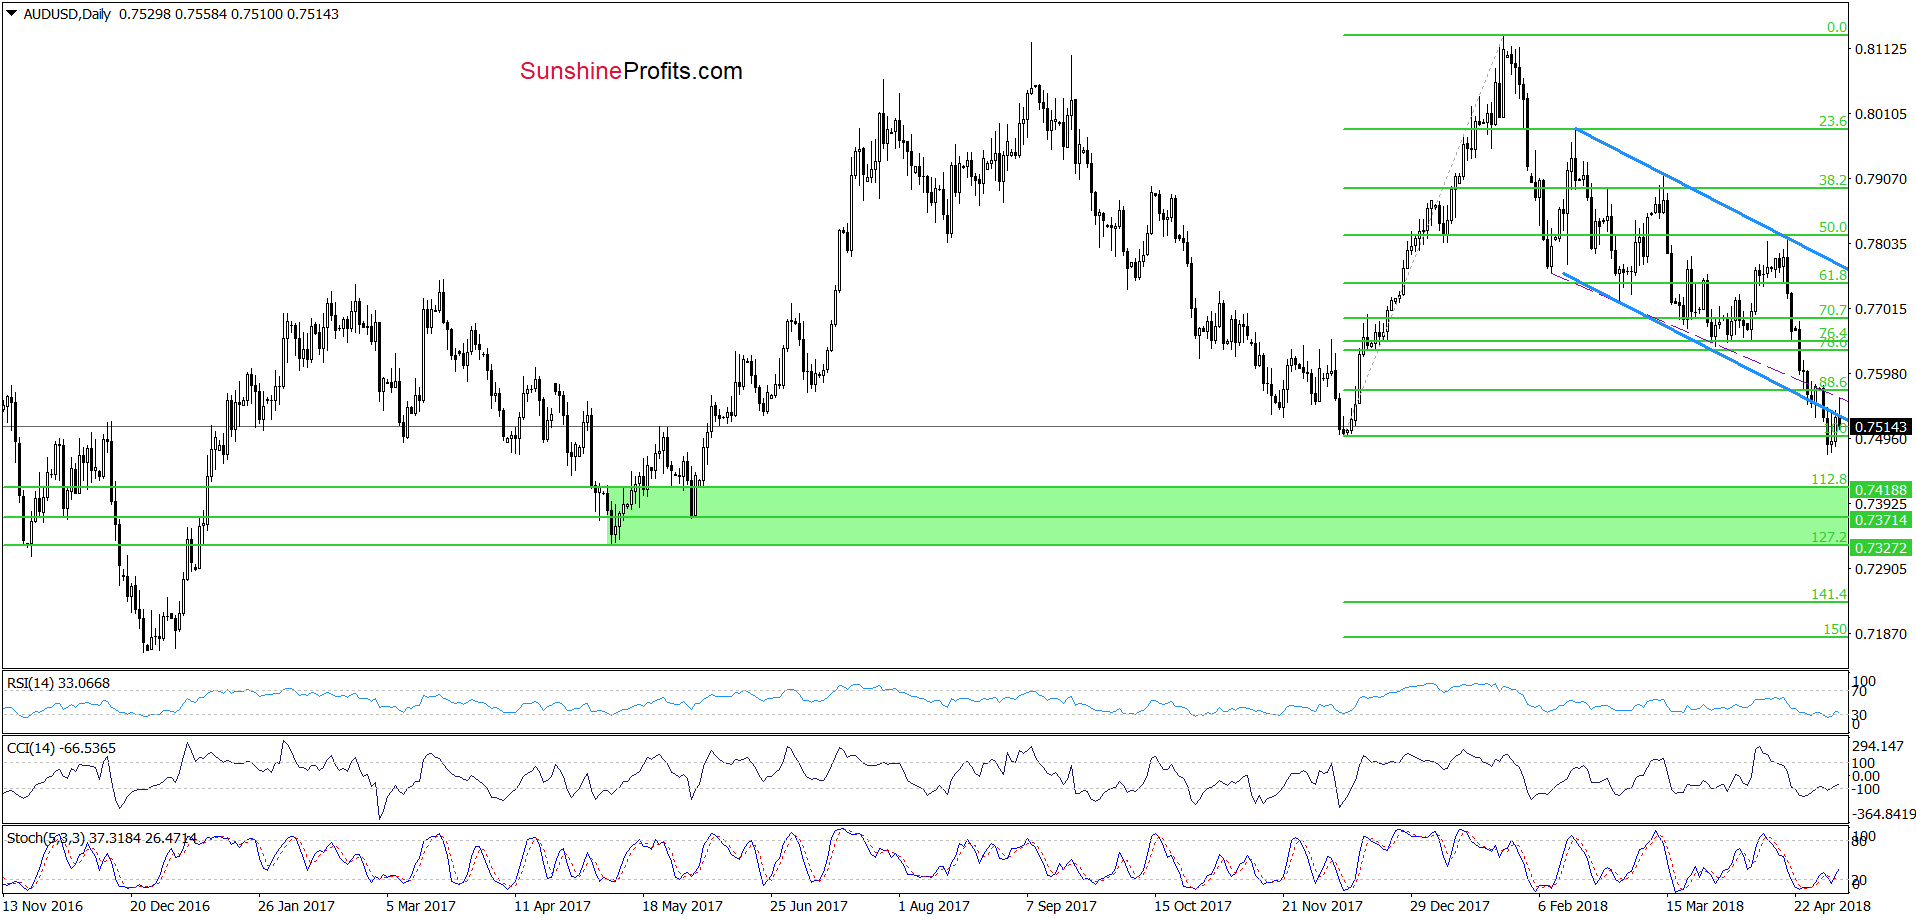
On Tuesday, we wrote the following:
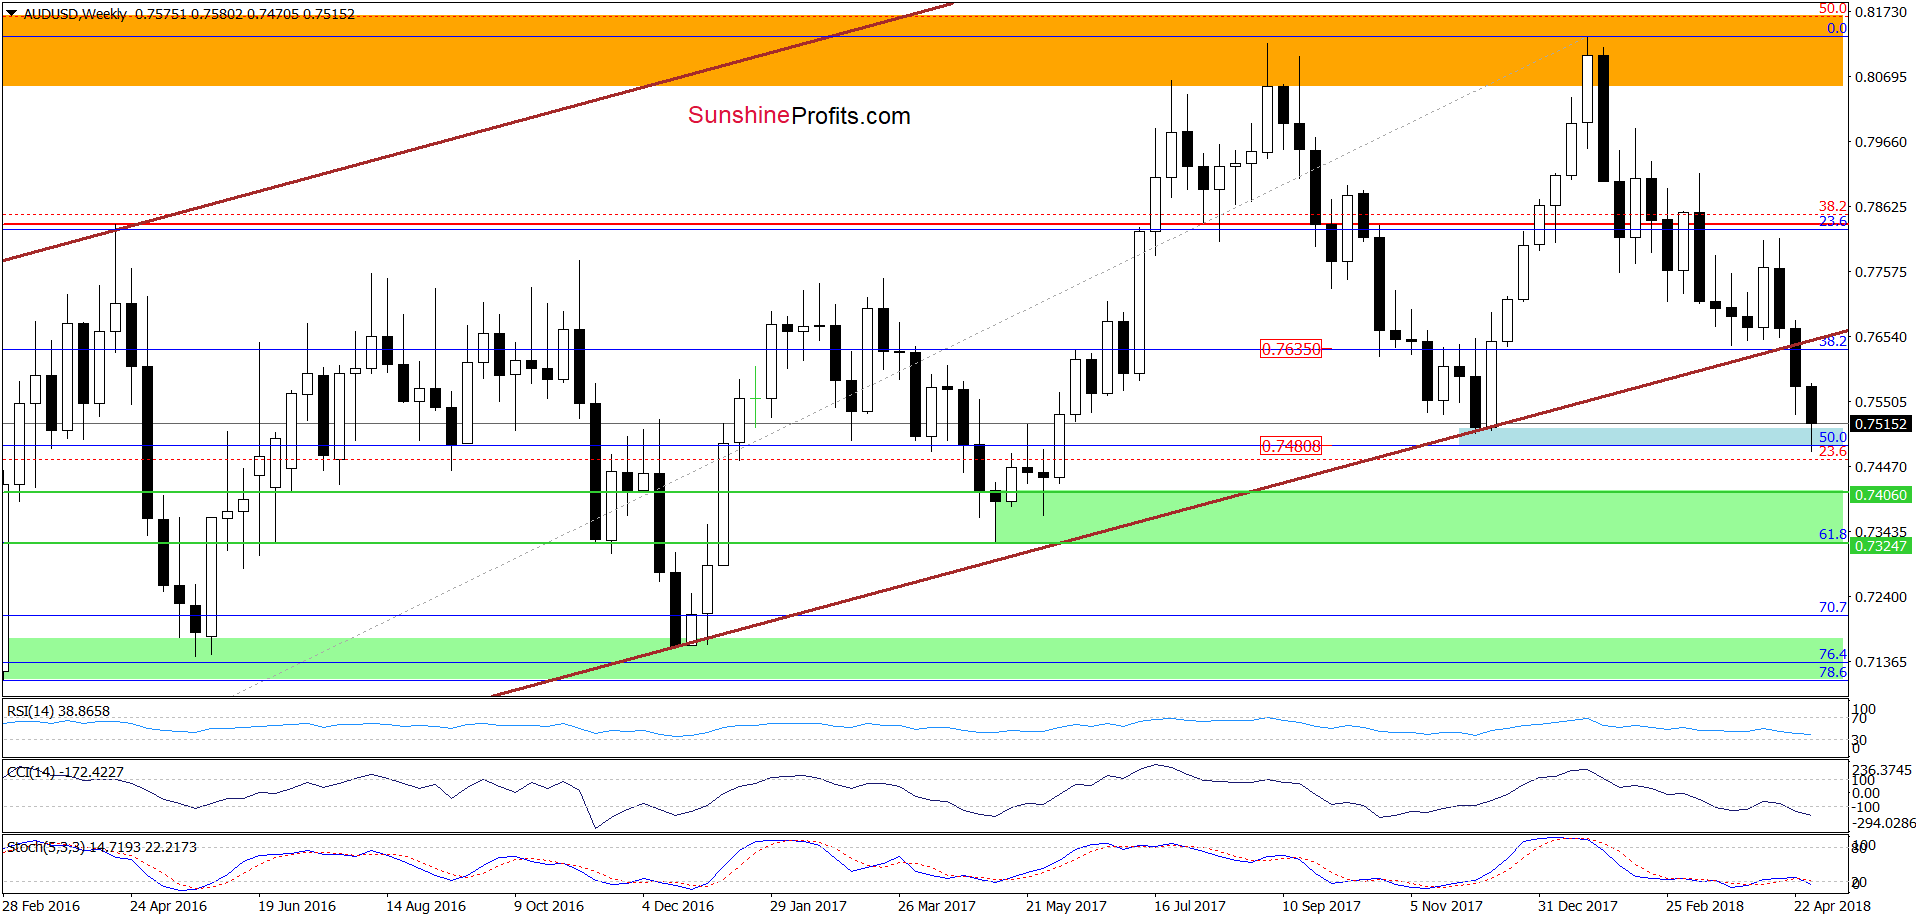
The first thing that catches the eye on the daily chart is the breakdown under the lower border of the blue declining trend channel, which suggests that we’ll see a test of the blue support zone created by the 50% Fibonacci retracement based on the entire 2016-2018 upward move and the December lows (marked on the weekly chart below) in the very near future.
Looking at the above chart, we see that the situation developed in line with our assumptions and the exchange rate slipped to our downside target. Although currency bulls triggered a move to the upside and broke above the lower border of the blue declining trend channel earlier today, their happiness was very temporary.
As you see on the daily chart, their opponents showed strength in the following hours, and invalidated the earlier breakout. This is a bearish development, which suggests that we could see a re-test of this week’s low later in the day.
Nevertheless, even if we see such price action, buy signals generated by the daily indicators suggest that higher values of AUD/USD are just around the corner. Therefore, if the pair successfully invalidates the breakdown under the lower border of the blue trend channel, we’ll likely open long positions. Stay tuned.
Trading position (short-term; our opinion): No positions are justified from the risk/reward perspective. We will keep you informed should anything change, or should we see a confirmation/invalidation of the above.
Finishing today’ s Forex Trading Alert, we would also like to comment the current situation in the USD Index.
Focus on the Greenback
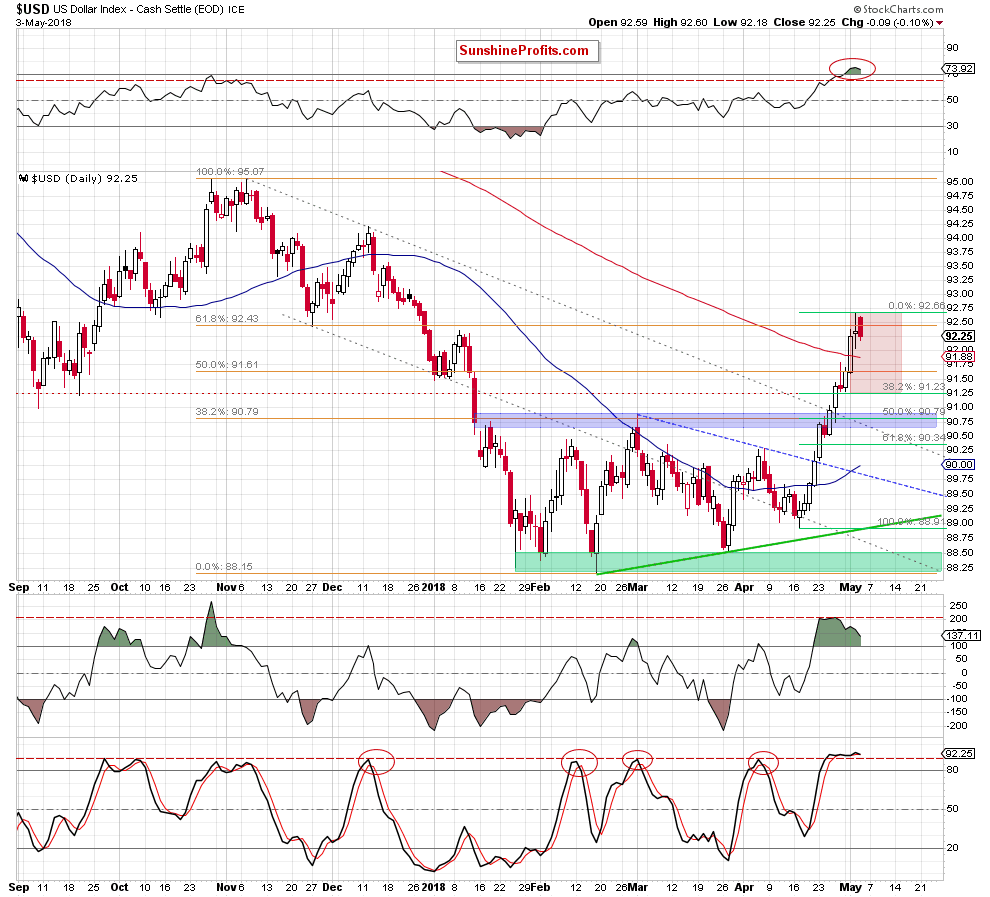
From today’s point of view, we see that the USD Index climbed above the 61.8% Fibonacci retracement, the January peak and the late November low in recent days. Despite this improvement, the buyers didn’t manage to hold gained levels, which resulted in a reversal an invalidation of the earlier breakouts during yesterday’s session.
Additionally, the USD Index closed Thursday’s session below the above-mentioned levels, which in combination with the current position of the daily indicators (the RSI climbed not only above 70, but also to the highest level since November 2017, plus there is clearly visible bearish divergence between the CCI and the index, while the Stochastic Oscillator almost re-generated a sell signal) increases the probability of further deterioration in the coming week.
How low could the greenback go?
In our opinion, the first downside target will be around 91.25, where the 38.2% Fibonacci retracement (based on the mid-April upward move) is. However, if this support is broken, currency bears will likely test the previously-broken blue zone, which is currently reinforced by the 50% retracement.
Thank you.
Nadia Simmons
Forex & Oil Trading Strategist
Przemyslaw Radomski, CFA
Founder, Editor-in-chief, Gold & Silver Fund Manager
Gold & Silver Trading Alerts
Forex Trading Alerts
Oil Investment Updates
Oil Trading Alerts

