

Trade management is not about aiming to make a home run out of every trade. A good trading strategy is one with a high win ratio and reasonably large profits per trade. These more than cover the occasional losses which are an inevitable part of the trading business. Active trade management comes as the cherry on the cake. It’s time to share with you what kind of action we decided to take right now.
- EUR/USD:short (a stop-loss order at 1.1375; the exit target at 1.1242)
- GBP/USD: short (a stop-loss order at 1.2979; the initial downside target at 1.2712)
- USD/JPY: none
- USD/CAD: none
- USD/CHF: none
- AUD/USD: half of short positions (a stop-loss at 0.7228; the exit target at 0.7042)
EUR/USD
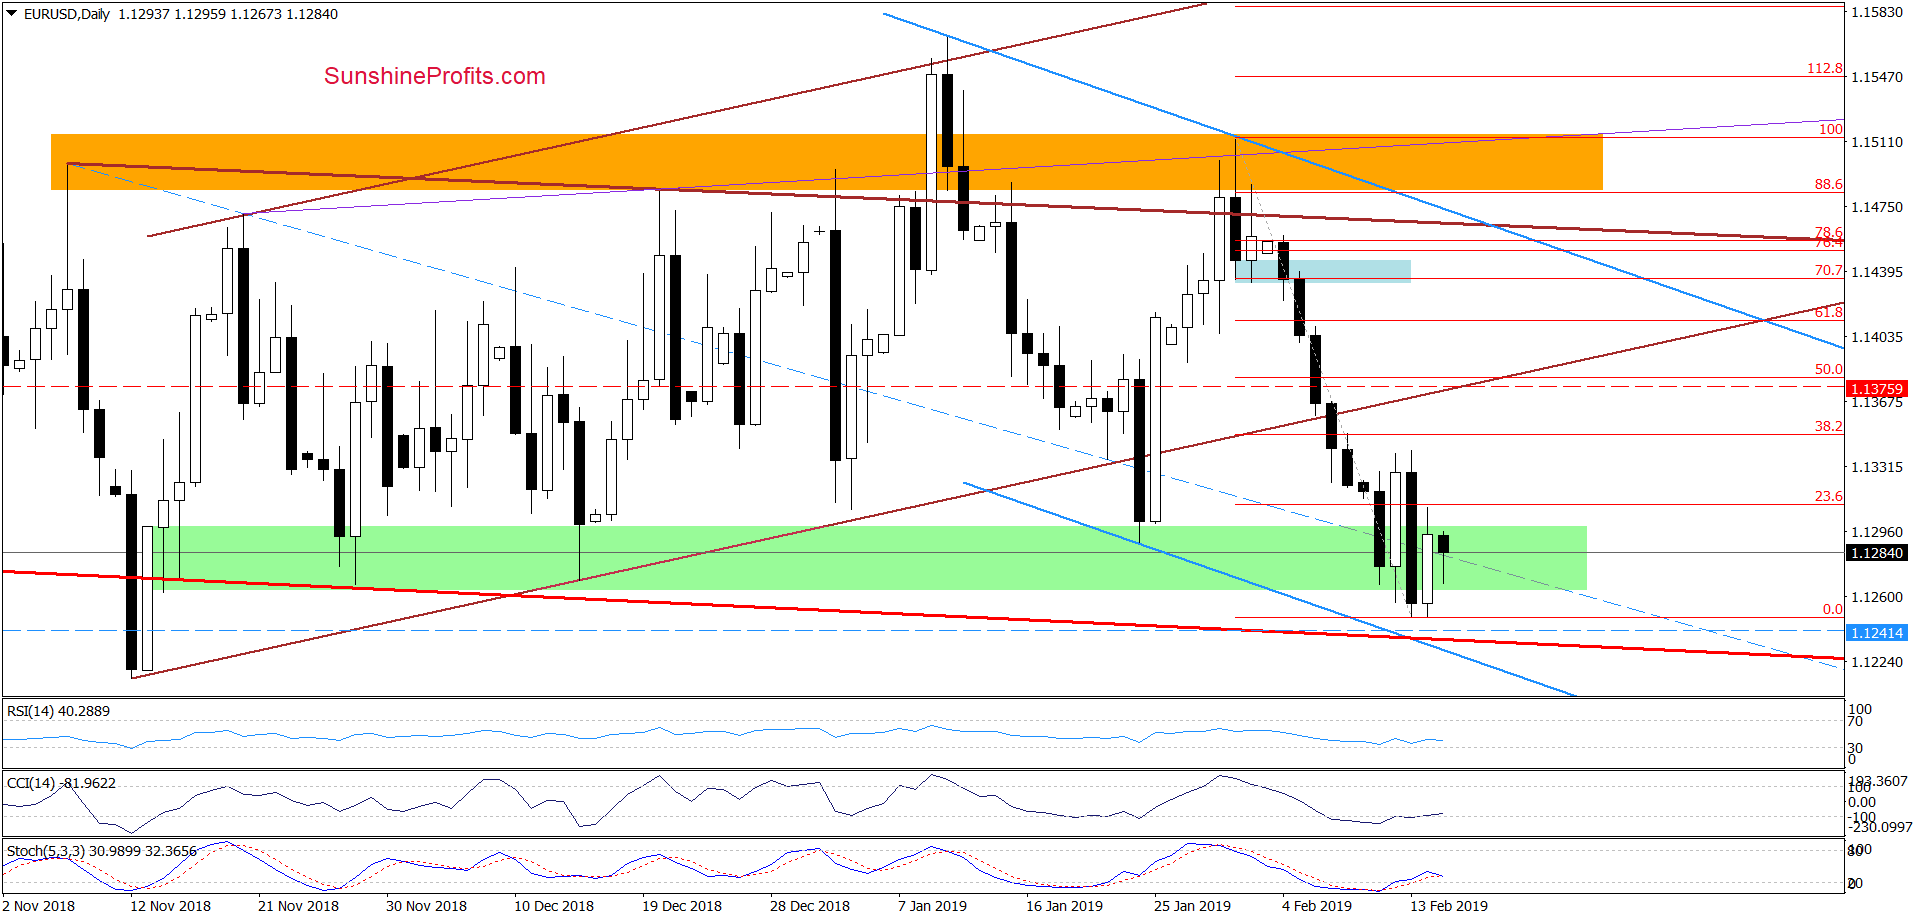
Although EUR/USD bounced off the session lows and rebounded yesterday, currency bulls didn’t manage to change the technical picture significantly. There was no break above the first chart resistance nearby, the 23.6% Fibonacci retracement.
The pair pulled back and closed the day below the above mentioned resistance. This show of weakness triggered further deterioration earlier today. It’s becoming increasingly probable that we’ll see a realization of the bearish scenario and a test of the red declining support line in the very near future.
There’s something new to add that has implications. Below this declining red support line, there is also the lower border of the blue declining trend channel, which may be an additional factor that could encourage the bulls to act in the following days. The two most recent white candles support the likelihood of the exchange rate willing to put up a fight before any further moves down.
Therefore, we decided to close our already profitable short positions and take profits off the table if EUR/USD declines to our downside target. One never gets poor by cashing in profits at a chart-justified spot. Nevertheless, if we see more reliable bearish factors (such as a breakdown below these important support levels) we’ll consider reopening them. It’s simply wise to let the market reveal its hand first and act only then with clarity.
Trading position (short-term; our opinion): Profitable short positions with a stop-loss order at 1.1375 and the exit target at 1.1242 are justified from the risk/reward perspective.
USD/JPY
Quoting our last commentary:
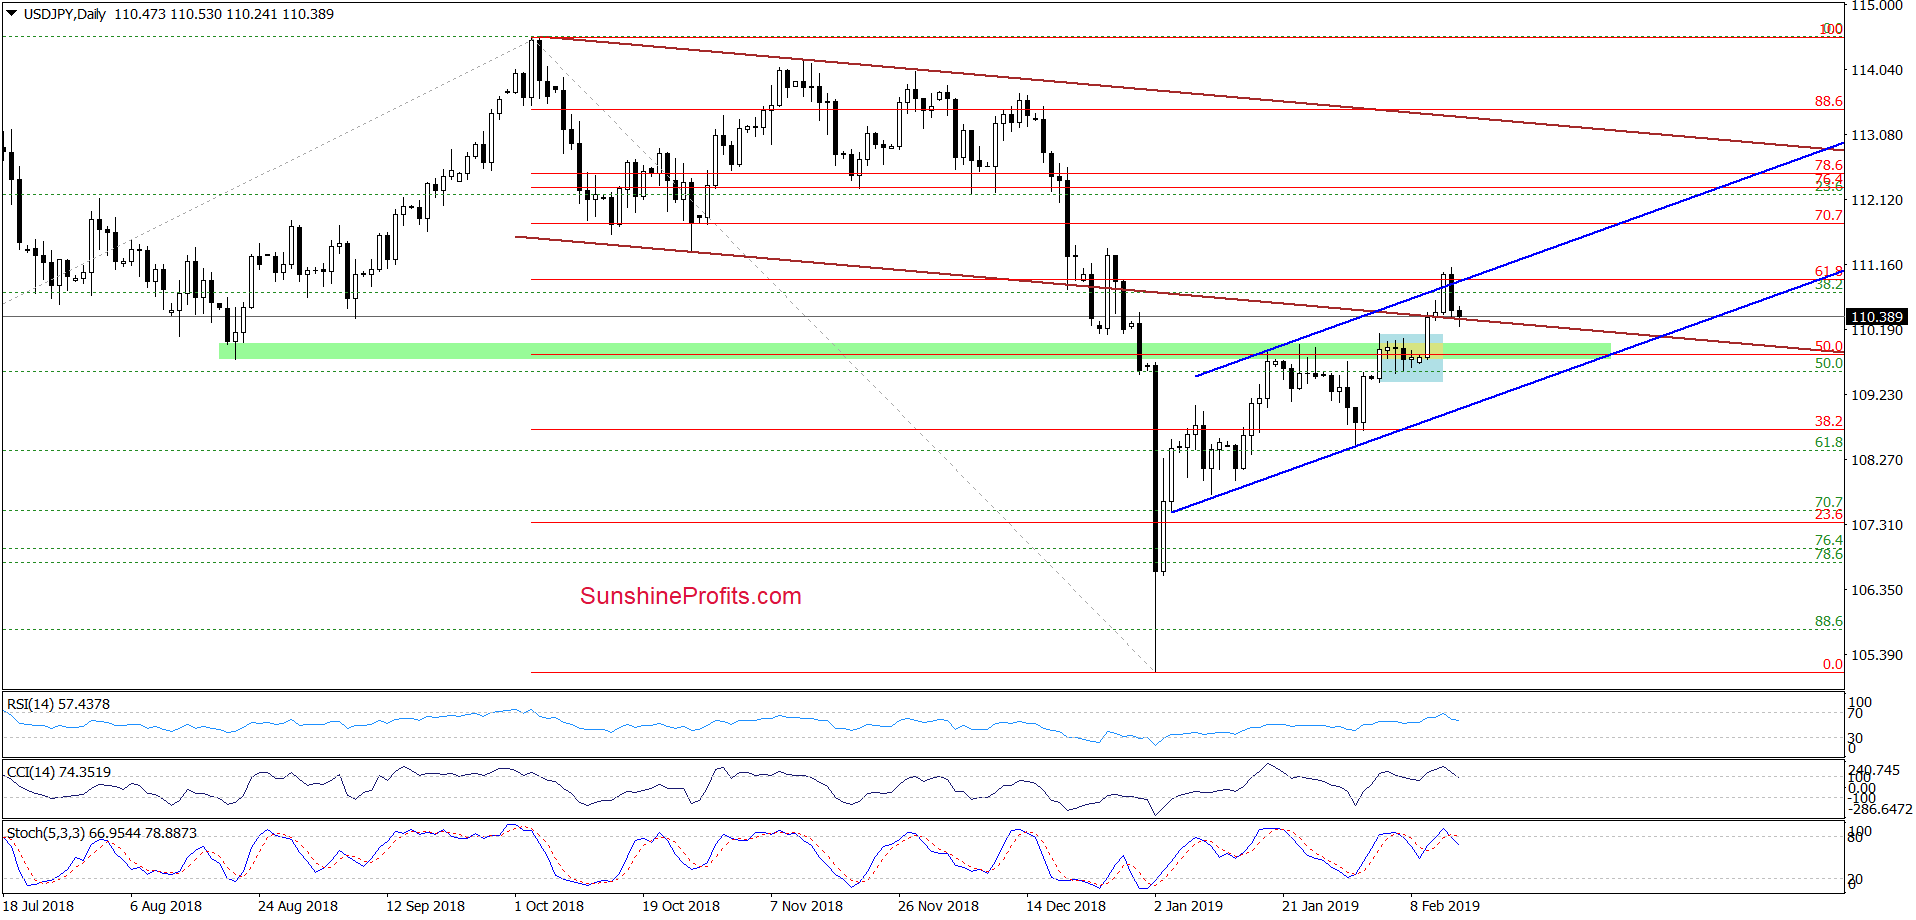
The first thing that catches the eye on the daily chart is the invalidation of the earlier breakdown below the lower border of the brown declining trend channel. This bullish development triggered further improvement earlier today, which suggests a test of the 61.8% Fibonacci retracement based on the entire October-February downward move.
The 61.8% Fibonacci retracement is reinforced by the upper border of the blue rising trend channel. These both could stop further improvement in the coming days.
The situation developed in line with our assumptions. USD/JPY did indeed finish Wednesday’s trading strongly. This improvement was however only temporary and the exchange rate erased all gains before Thursday was over.
This action invalidated the earlier breakout above the 61.8% Fibonacci retracement and the upper border of the blue rising trend channel, which is a bearish development. Additionally, all daily indicators generated sell signals, increasing the probability of further deterioration in the following days.
Nevertheless, a bigger move to the downside will be more likely and reliable if USD/JPY closes today or in the near future below the previously broken lower border of the brown declining trend channel. It would definitely make us consider opening short positions.
If we see such price action, the initial downside target will be the lower border of the blue rising rend channel (currently around 109.06). We will keep you informed should anything change, or should we see a confirmation/invalidation of the above.
Trading position (short-term; our opinion): No positions are justified from the risk/reward perspective, but decision to open short positions is just around the corner.
AUD/USD
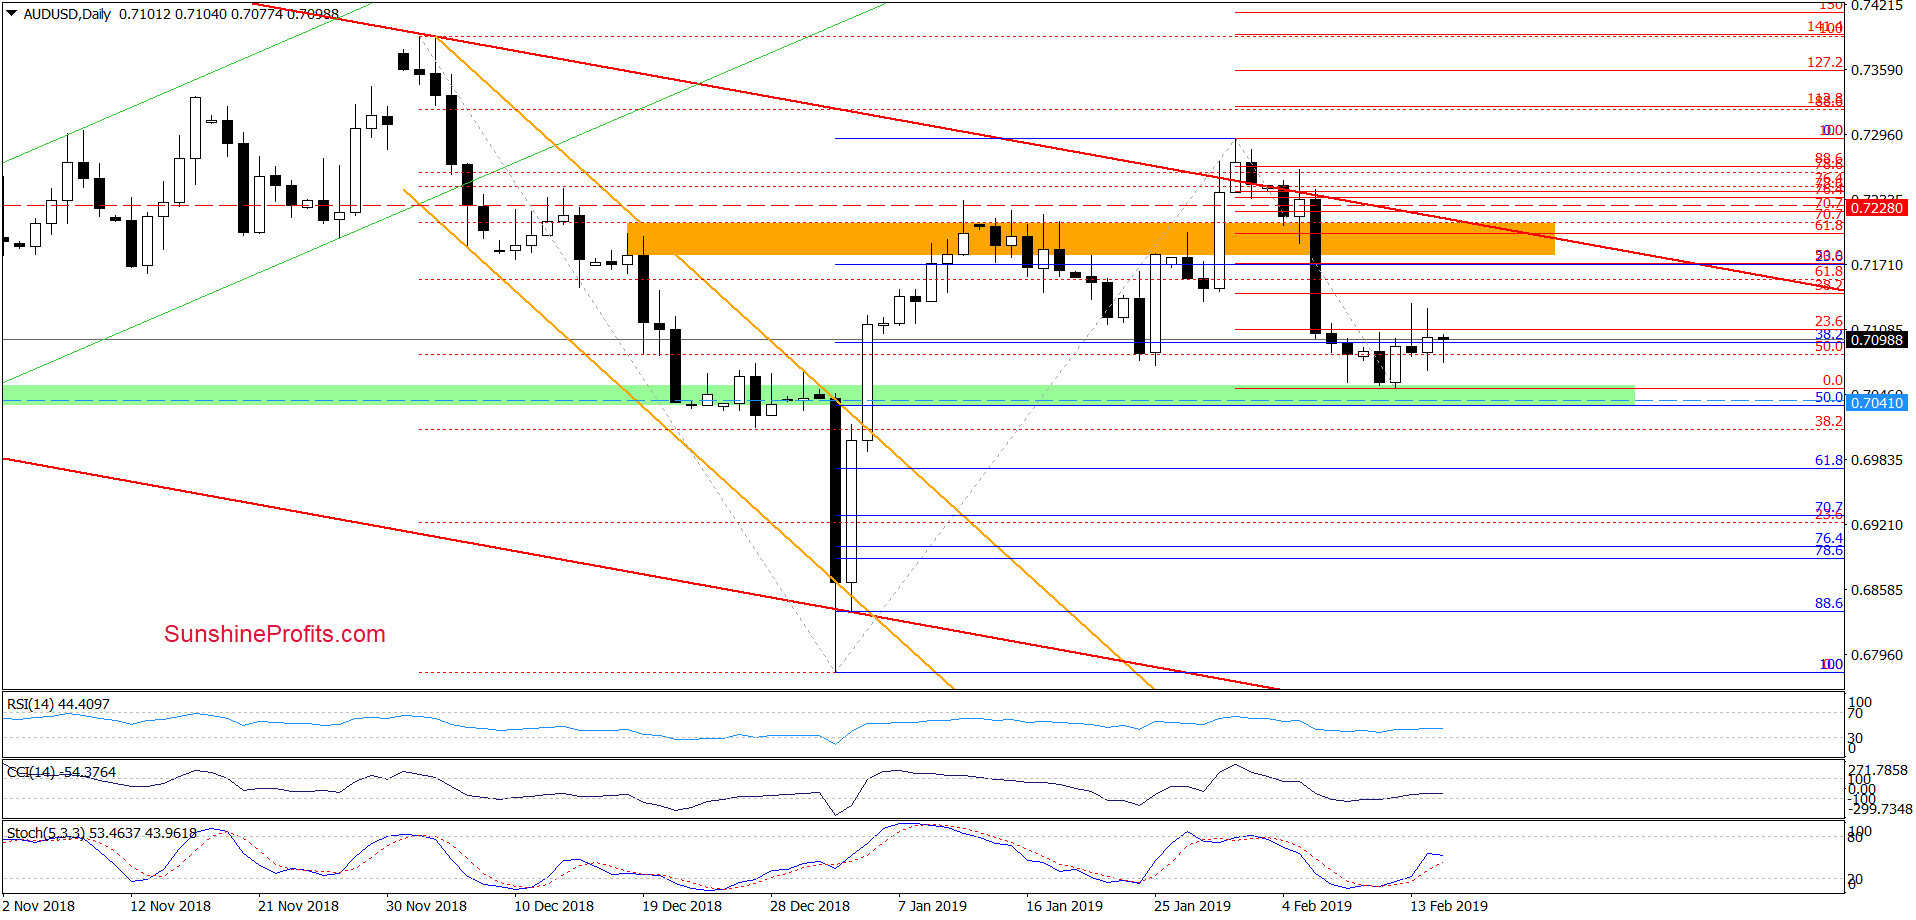
Looking at the daily chart, we see that the overall situation hasn’t changed much. AUD/USD is still trading not only below the 38.2% Fibonacci retracement, but also below the 23.6% Fibonacci retracement, which underlines the buyers’ weakness.
Taking this fact into account, we believe that our latest observation is up-to-date also today:
(…) the green support zone encouraged the buyers to act in recent days. As a result, AUD/USD moved higher, but the bulls didn’t even manage to reach the 38.2% Fibonacci retracement. This weakness is similar to what we saw in the case of EUR/USD.
It suggests that another attempt to move lower may be around the corner and a retest of the green support zone (or even a drop to/below our next downside target) should not surprise us in the following day(s). Any possible short-term resilience coming true would still leave the daily indicators lined up nicely for a subsequent price move down in earnest.
Stochastics is getting positioned nicely to reissue its sell signal in the near future. Depending on the force it does that with, it could leave Stochastics positioned for a potential bullish divergence (i.e. the next indicator low being higher than the previous low while the price level is roughly similar). Therefore, and similarly to EUR/USD, we decided to close our already profitable short positions and take profits off the table if AUD/USD declines to our downside target.
Trading position (short-term; our opinion): Half of profitable short positions (with a stop-loss order at our entry level at 0.7228 and the exit target at 0.7042) are justified from the risk/reward perspective.
Thank you.
Nadia Simmons
Forex & Oil Trading Strategist

