

On Wednesday, the euro moved sharply lower against the greenback after the USD Index touched its important support area. Despite this price action, the U.S. currency didn’t extend gains, which indicates the greenback’s weakness. But will EUR/GBP/USD and USD/CHF charts confirm this assumption?
In our opinion the following forex trading positions are justified - summary:
- EUR/USD: none
- GBP/USD: none
- USD/JPY: none
- USD/CAD: none
- USD/CHF: none
- AUD/USD: short (a stop-loss order at 0.8137; the initial downside target at 0.7730)
EUR/USD
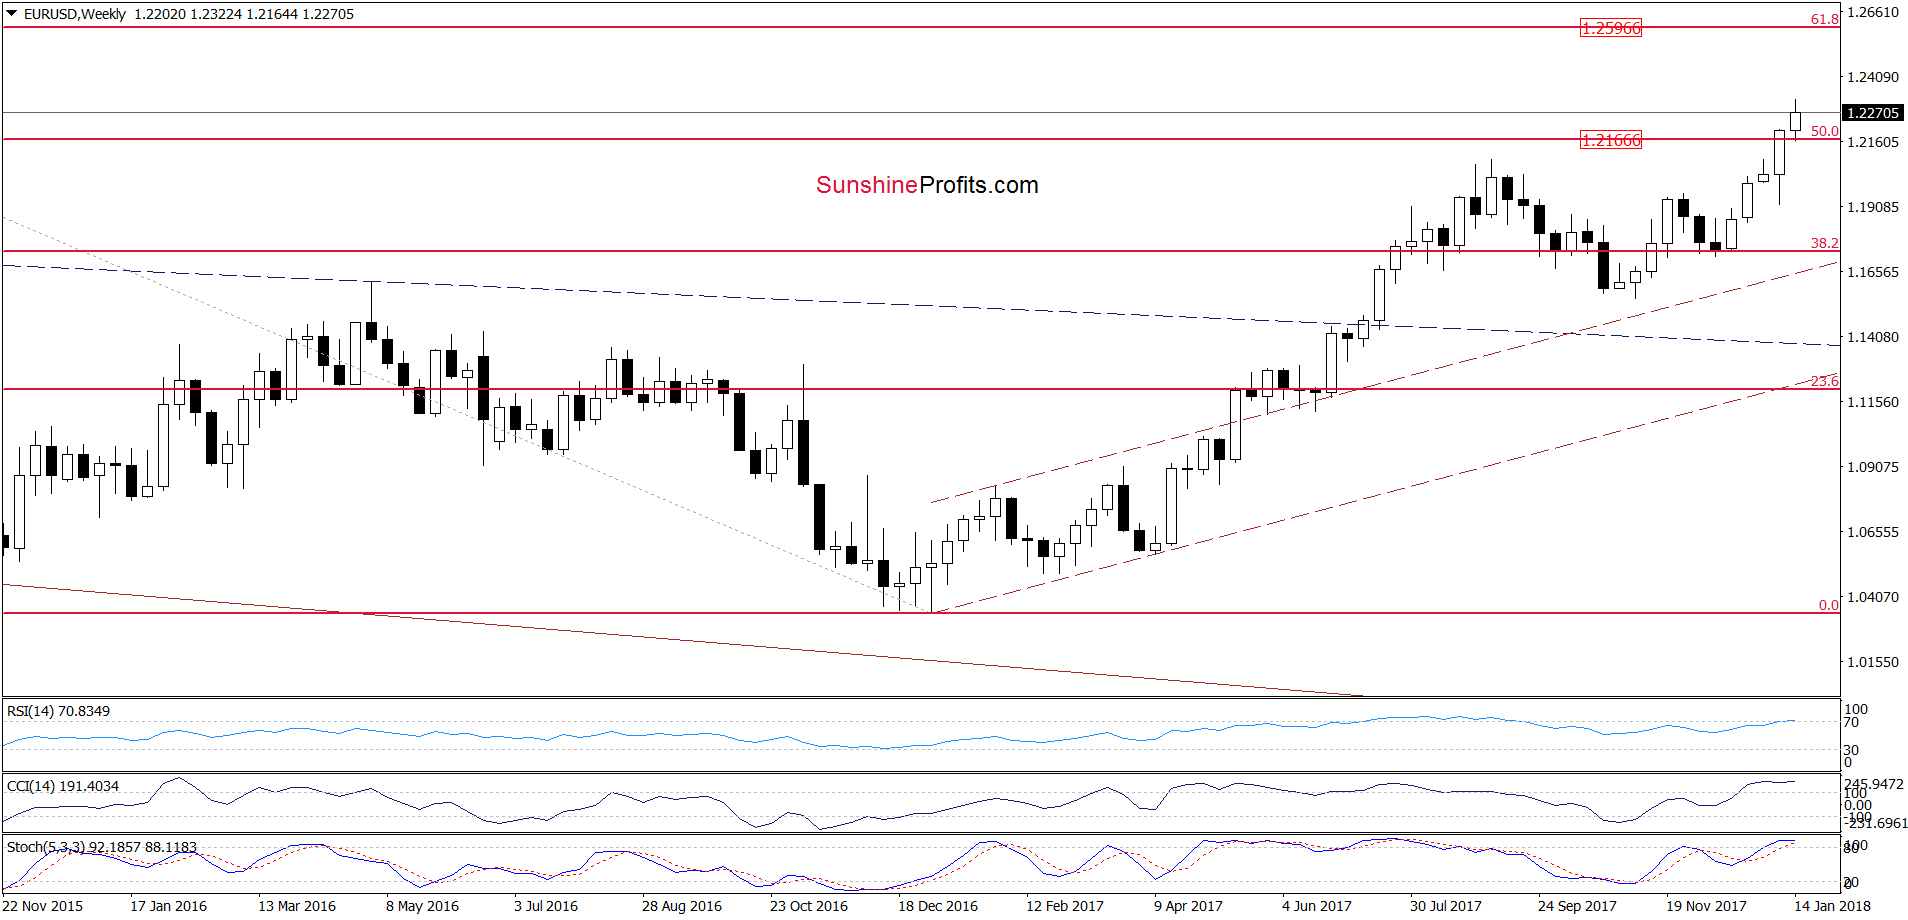
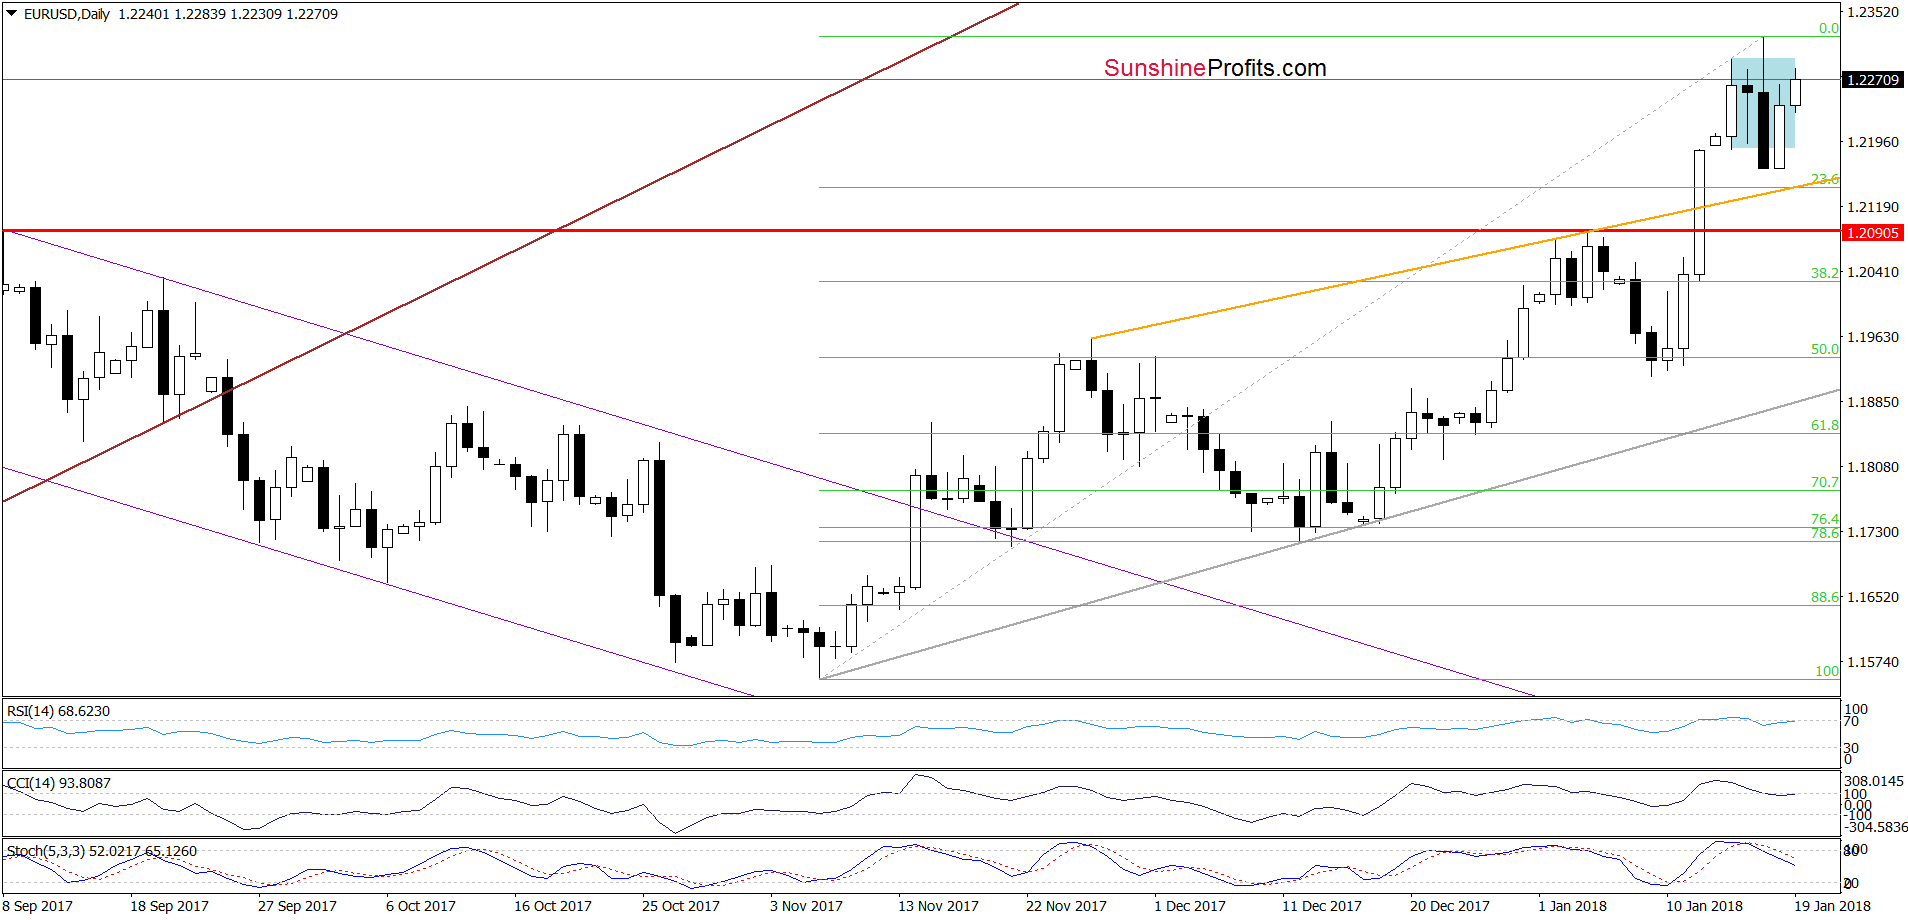
Although EUR/USD pulled back on Wednesday (you could see it more clearly on the daily chart below), the previously-broken 50% Fibonacci retracement withstood the selling pressure and continues to serve as the nearest support. Additionally, it triggered a rebound, which means that our assumptions from previous alerts were correct and concerns about the lack of a bigger move to the downside before the breakdown under this support were justified.
Having said the above, let’s check what we can infer from the daily chart.
In our yesterday'a alert, we wrote the following:
(…) the pair closed Wednesday session under the Monday (…) the sell signals generated by the indicators remains in the cards, increasing the probability of another downswing.
Nevertheless, taking into account the proximity to the orange support line based on the previous highs (the upper border of the rising wedge) and the early January highs it seems to us that the space for declines is too small to justify opening short positions.
From today’s point of view, we see that EUR/USD extended gains, not only invalidating the earlier breakdown under the lower border of the consolidation, but also approaching the Wednesday peak (and the highest level in 2018).
What does it mean for the exchange rate? On one hand, the above-mentioned high could stop currency bulls later in the day - especially when we factor in the fact that the sellers have the sell signals generated by the indicators on their side. Additionally, when we focus on the Wednesday candle, we clearly see that currency bears took control very quickly after their opponents hit a fresh 2018 high, which resulted in a sharp decline in the following hours.
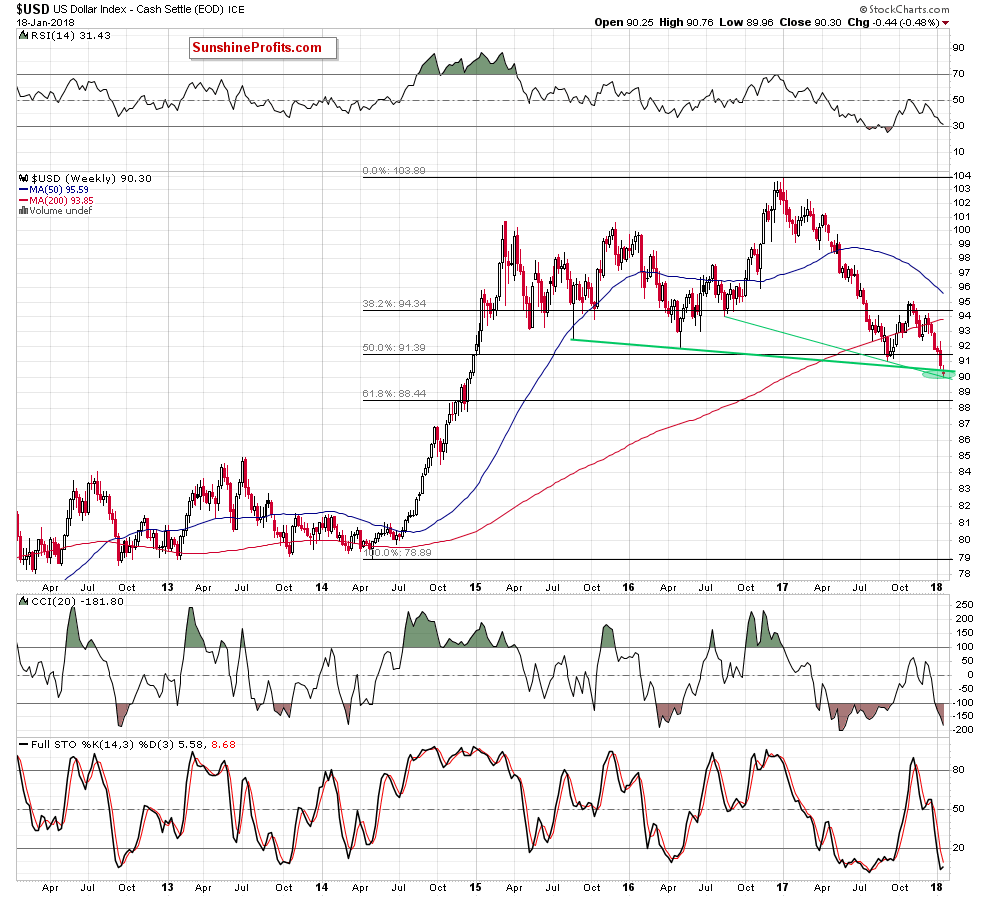
On top of that, the USD Index dropped to the green support zone marked on the weekly chart below.
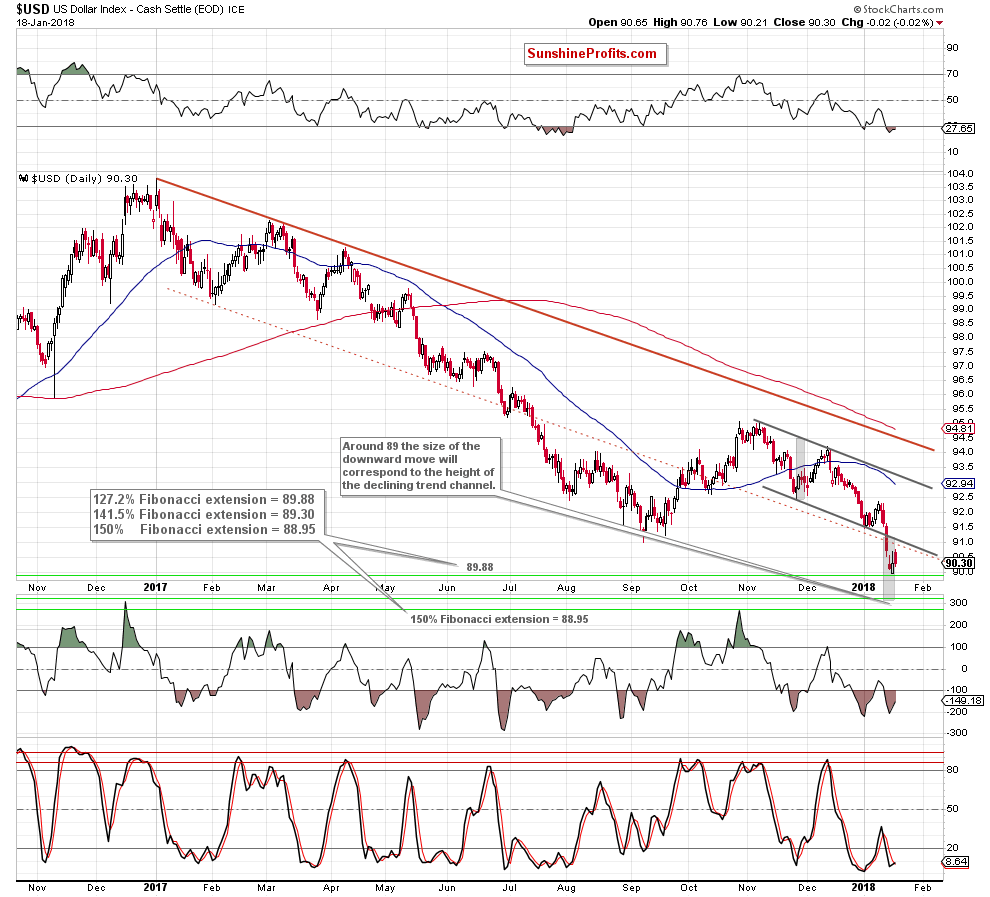
However, on the other hand, currency bulls responded to Wednesday decline with an almost equally sharp rebound, which makes the very short-term picture a bit unclear. Especially when we consider the fact that the USD Index was not strong enough to verify the earlier breakdown under the lower border of the black declining trend channel marked on the daily chart below.
So, what to do now? We think that the best answer to this question will be an old saying known to many investors” when in doubt, stay out”.
Nevertheless, please keep in mind our bullish and bearish scenarios from the previous Forex Trading Alert:
(…) when can we expect a bigger move to the downside? In our opinion, such price action will be more likely and reliable only if we see an invalidation of the breakout above the above-mentioned 50% Fibonacci retracement and the January peak. Until this time, another downswing and a verification of the breakout above the September and January 2018 highs seems to be a more credible scenario.
Why? Because, we think that the USD Index will verify the breakdown under the lower border of the red declining trend channel at the same time. Therefore, in our opinion, as long as there is no invalidation of the breakdown under this line (…) opening full short positions in EUR/USD is not justified from the risk/reward perspective.
However, what could happen if the bulls do not manage to invalidate the above-mentioned breakdown?
(…) potential bulls’ failure could trigger one more downward move and a drop to around 89, where the size of the downward move will correspond to the height of the declining trend channel.
What could happen at the same time with EUR/USD?
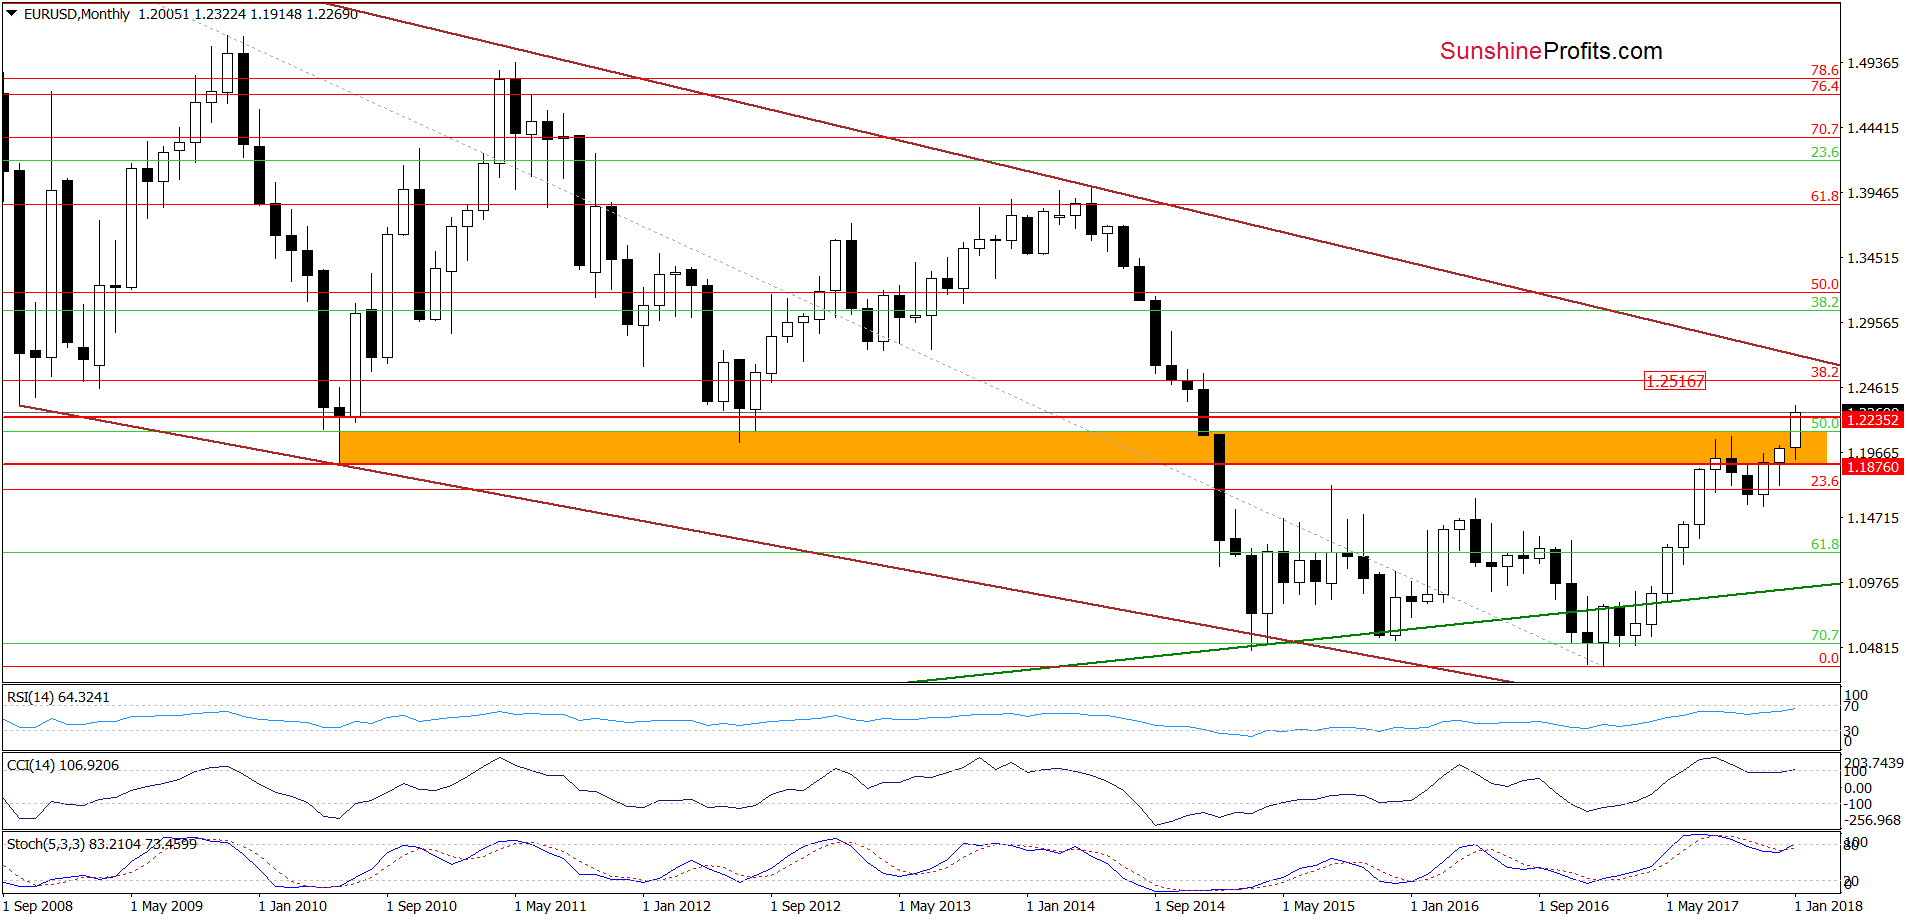
We think that such decline in the greenback could push the exchange rate to the 38.2% Fibonacci retracement based on the entire 2008-2017 downward move. Nevertheless, this is just a potential scenario and we will continue to monitor the market very closely in the coming days.
Trading position (short-term; our opinion): No positions are justified from the risk/reward perspective, however, if we see an invalidation of the breakout above the above-mentioned 50% Fibonacci retracement and the January peak, we’ll likely open short positions. We will keep you informed should anything change, or should we see a confirmation/invalidation of the above.
GBP/USD
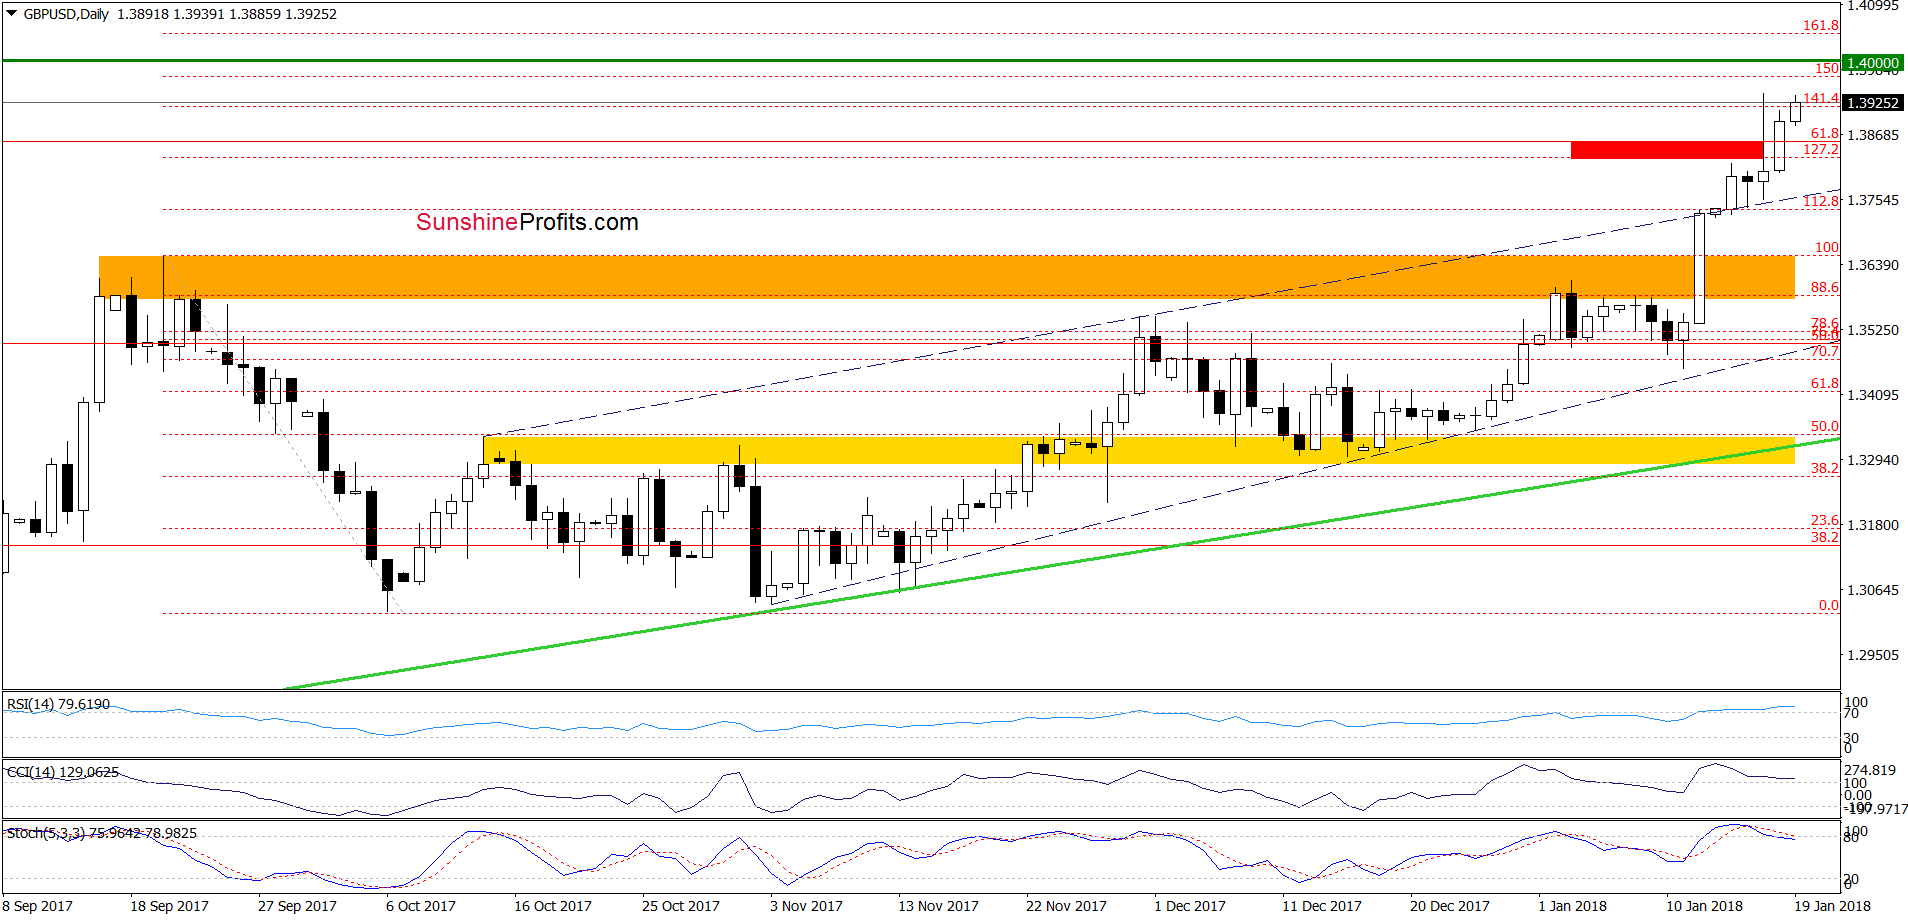
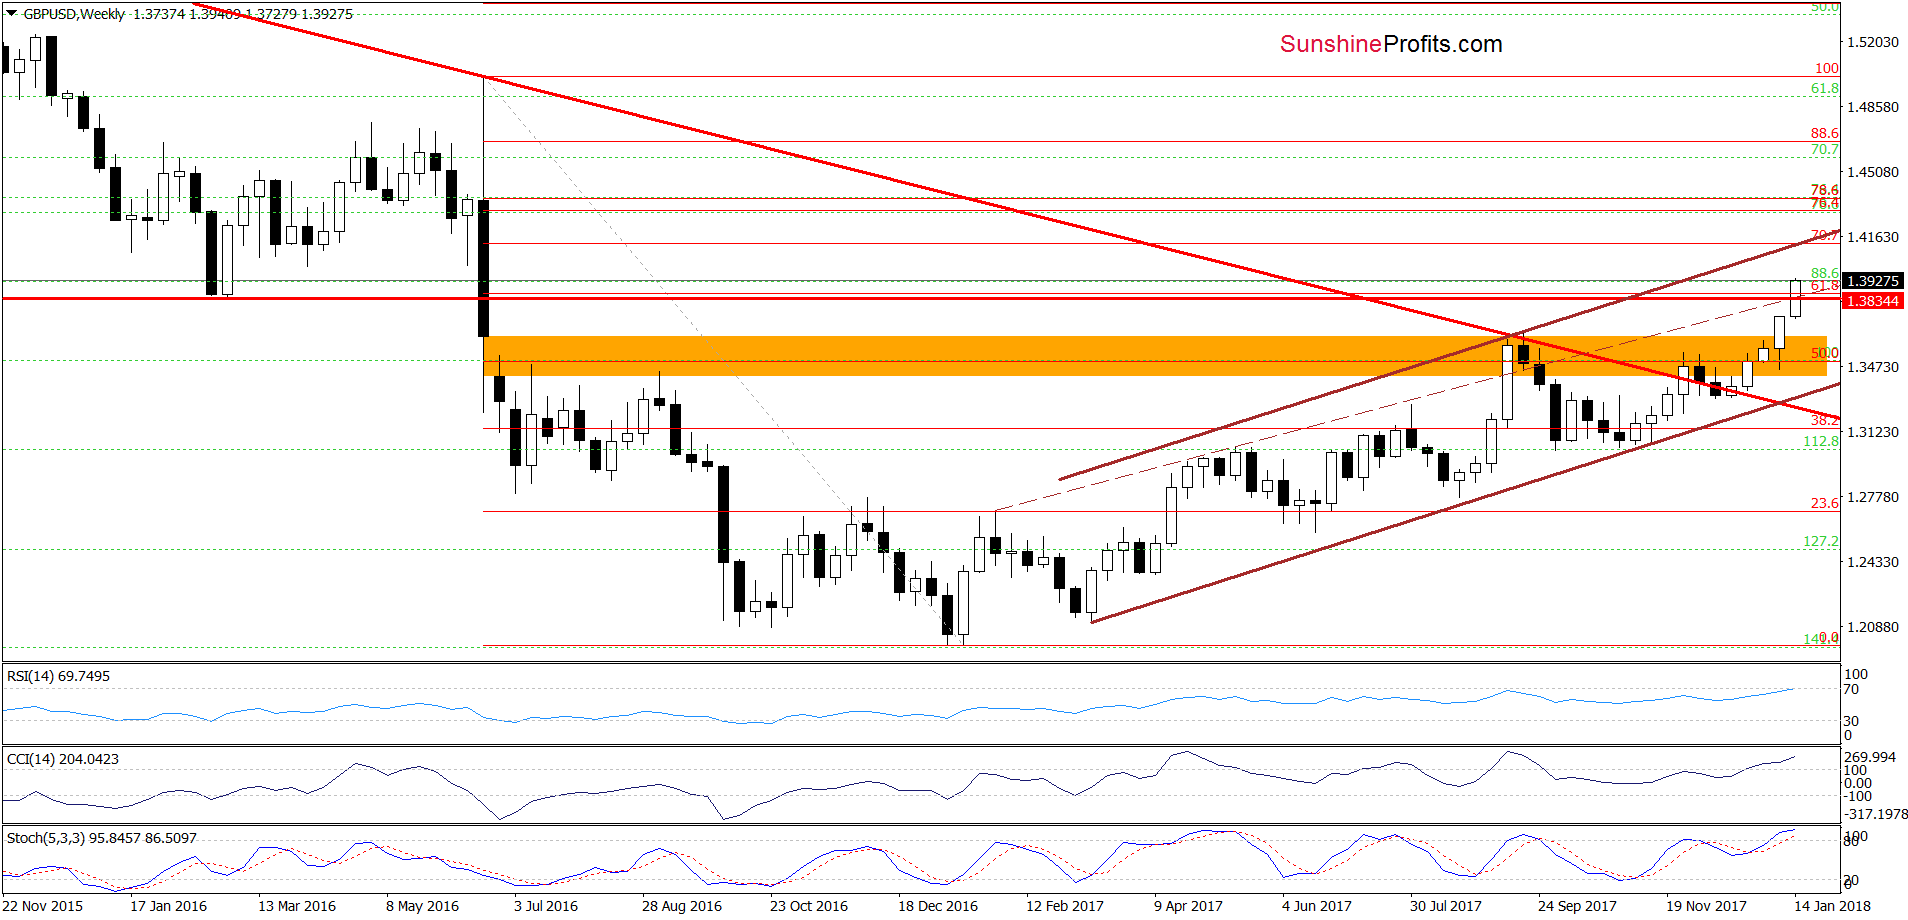
Looking at the daily chart, we see that GBP/USD broke above the red resistance zone created by the 61.8% Fibonacci retracement (it will be seen more clearly on the weekly chart below) and the 127.2% Fibonacci extension based on the entire September-October downward move.
Taking this fact into account and combining it with a breakout above the brown dashed resistance line (the upper border of the brown rising wedge) and the red horizontal line based on the February 2016 lows (both marked on the weekly chart below), we think that GBP/USD could test the 150% Fibonacci extension or even barrier of 1.4000.
Nevertheless, please keep in mind that the current position of the daily and weekly indicators suggests that the space for gains may be limited and reversal in the coming week should not surprise us.
When can we expect a bigger move to the downside? In our opinion, it will be more likely and reliable if the pair closes one of the following session under the September high and the upper line of the black rising trend channel marked with dashed lines on the daily chart.
Trading position (short-term; our opinion): no positions are justified from the risk/reward perspective. We will keep you informed should anything change, or should we see a confirmation/invalidation of the above.
USD/CHF
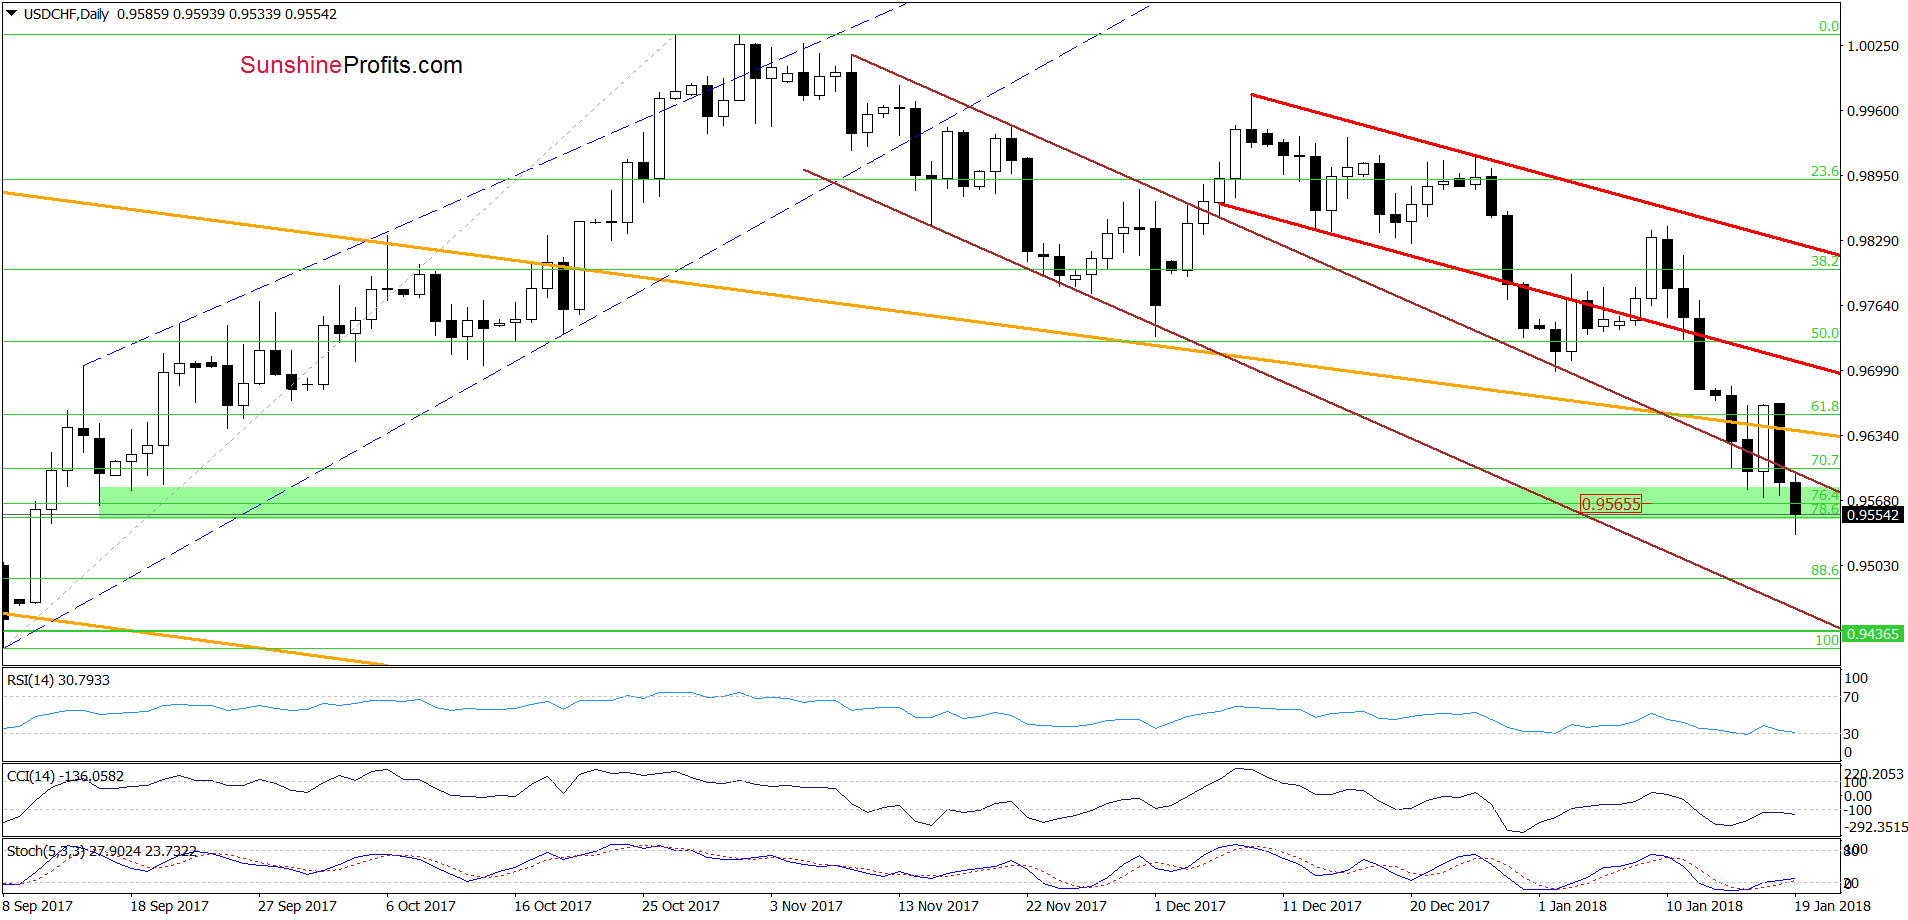
In our last commentary on this currency pair, we wrote the following:
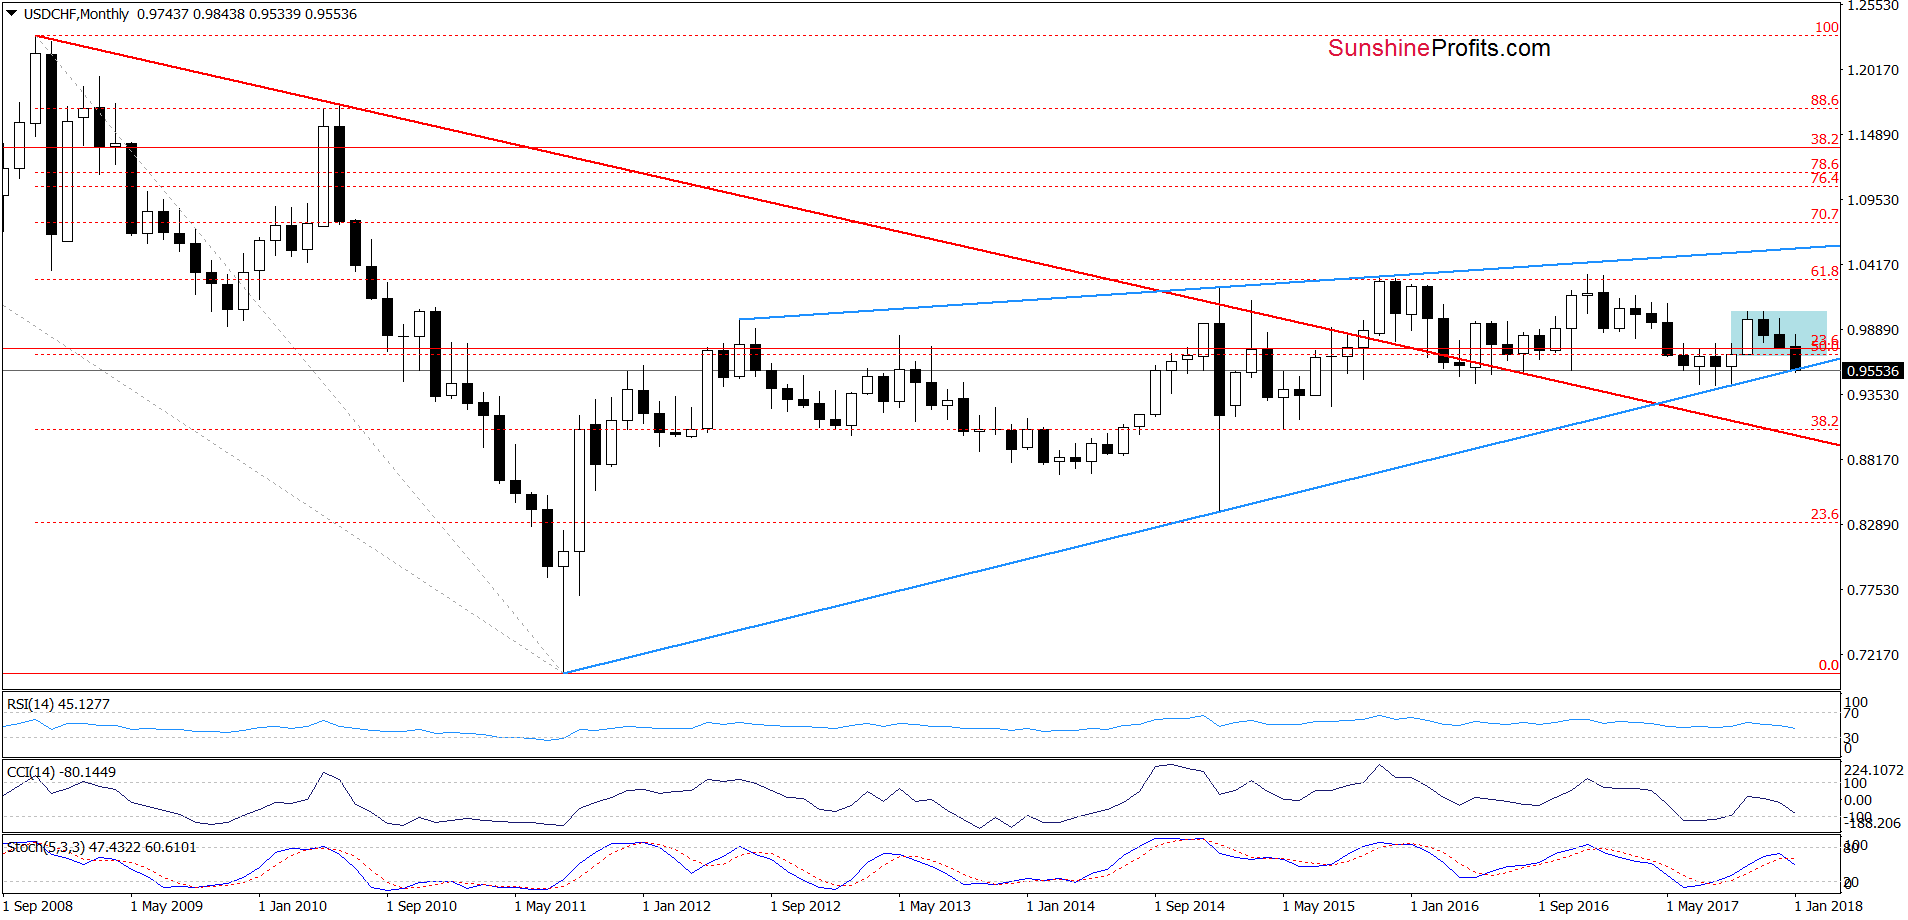
(…) one more downswing is still ahead of us. How low could the pair go if the situation developed in line with our assumptions? We think that USD/CHF will test the green support zone seen on the daily chart, which (what’s interesting) is intersected by the (…) long-term blue line (based on important lows and marked on the monthly chart below).
From today’s point of view, we see that the situation developed in line with the above scenario and currency bears pushed the exchange rate to our downside targets. What’s next? The combination of the long-term blue line (based on important lows and marked on the monthly chart) and the current position of the daily indicators suggests that reversal is just around the corner – especially when we factor in the fact that the USD Index dropped to the green support zone marked on the weekly chart and EUR/USD approached the previous high.
Nevertheless, in our opinion, a rebound will be more likely and reliable if USD/CHF invalidated the breakdown under the upper border of the brown declining trend channel seen on the daily chart. If we see such price action, currency bulls will likely try to push the exchange rate to the previously-broken lower border of the short-term red declining trend channel.
Trading position (short-term; our opinion): No positions are justified from the risk/reward perspective at the moment. We will keep you informed should anything change, or should we see a confirmation/invalidation of the above.
AUD/USD
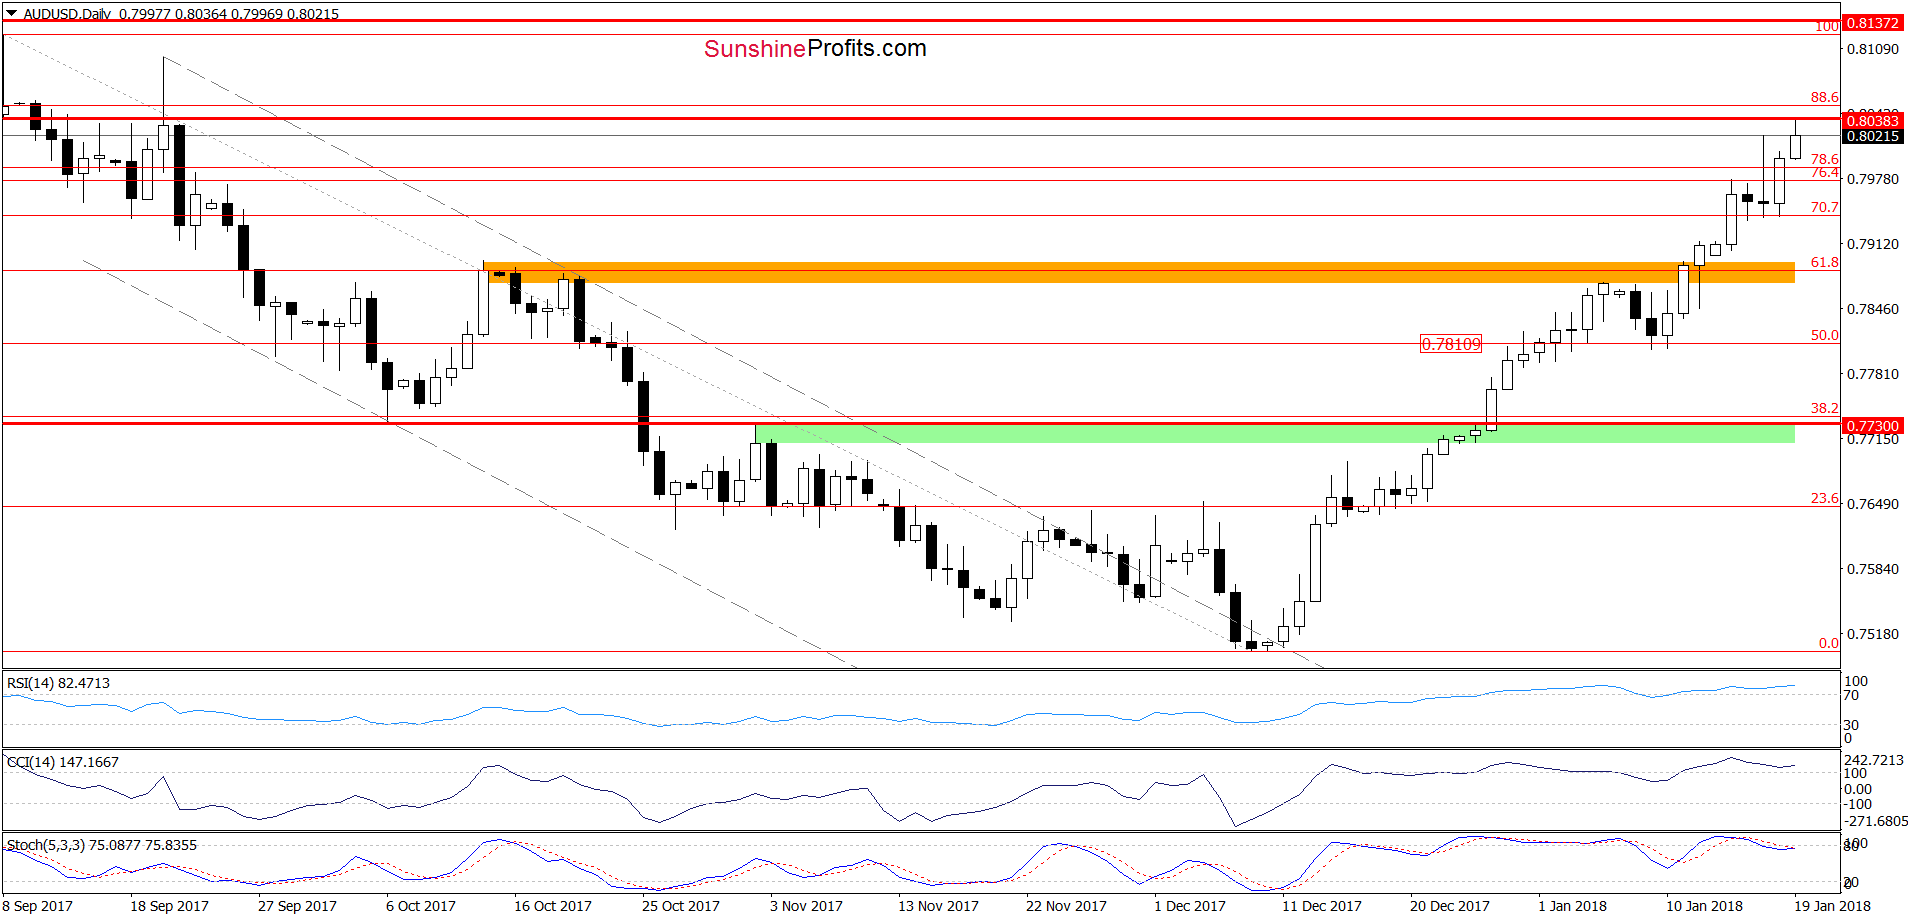
From today’s point of view, we see that the resistance zone created by the 76.4% and 78.6% Fibonacci retracements let us down, because it did not stop currency bulls. Nevertheless, taking into account the current situation in the USD Index and the position of the daily indicators, we think that even id AUD/USD moves a bit higher from current levels, the space for gains is limited. Therefore, to have more confidence that our short positions won’t be closed by a nearby stop-loss order, we decided to pick it up to 0.8138.
Trading position (short-term; our opinion): Short positions (with a stop-loss order at 0.8138 and the downside target at 0.7730) are justified from the risk/reward perspective now. We will keep you informed should anything change, or should we see a confirmation/invalidation of the above.
Thank you.
Nadia Simmons
Forex & Oil Trading Strategist
Przemyslaw Radomski, CFA
Founder, Editor-in-chief, Gold & Silver Fund Manager
Gold & Silver Trading Alerts
Forex Trading Alerts
Oil Investment Updates
Oil Trading Alerts

