

As you've read in the previous Oil Trading Alerts and Forex Trading Alerts, Nadia Simmons, who is the author of these reports has not been feeling well. This remains to be the case, and as it's been several days since you received crude oil or forex analysis from us, I (PR here) would like to help.
Consequently, I will be writing analyses of both: crude oil and the forex market and I will publish them combined, so that those, who normally enjoy access to only one of these reports, will get something extra. That's not much of a positive surprise for those, who already have access to both Alerts (for instance through the All-Inclusive Package), so if you have access through this package or you subscribed to both products individually, I will provide you with something extra. I will analyze any company of your choice with regard to its individual technical situation, and I will send you this on-demand analysis over e-mail. If this applies to you, please contact us with the name of the company that you're interested in.
Having said that, let's take a look at the crude oil market.
Crude Oil Analysis
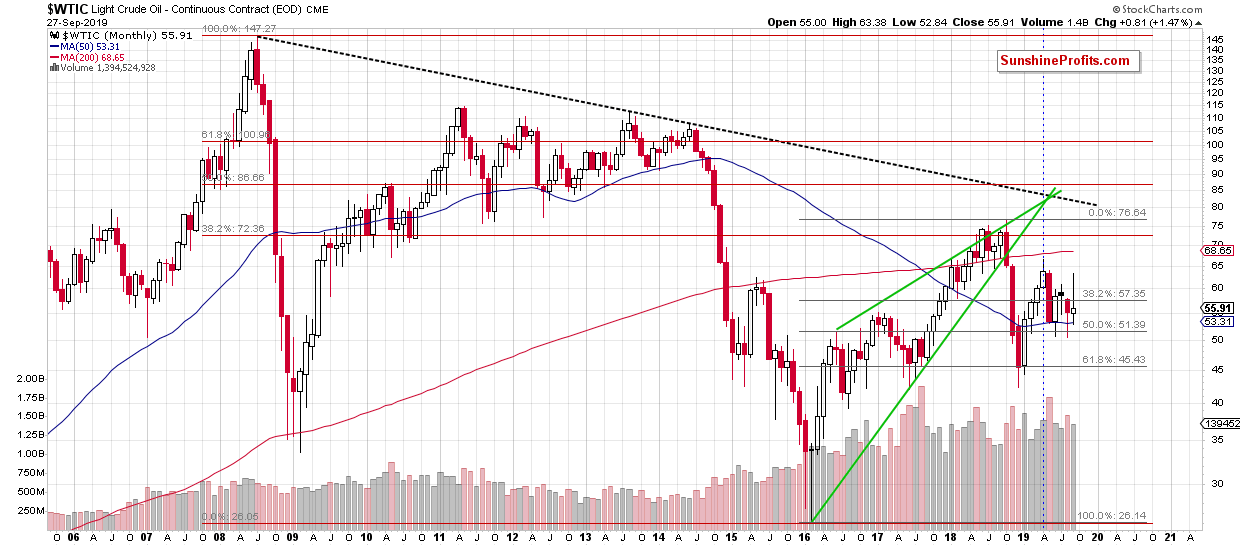
Crude oil just rallied this month and then reversed its course. As of yesterday's closing price, it was up by $0.81 in September. However, today's overnight decline took crude oil over 50 cents lower, which means that the small monthly gain has been almost entirely erased. Moreover, this creates a bearish reversal, which suggests lower crude oil values in the following months.
Let's not forget what caused crude oil to rally recently - it was an attack on the Saudi oil field. In other words, it was a geopolitical event, and such events usually have only temporary effect on prices.
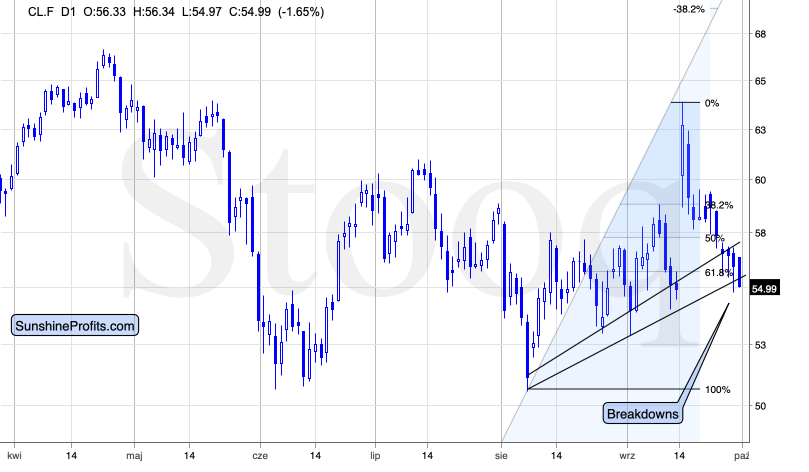
On the short-term chart, we see that crude oil broke below the rising support lines based on the August and September lows. The higher line is based on the closing prices and the breakdown below it was already verified by three consecutive closes. The breakdown below the lower of the two lines that's based on the intraday lows is taking place at the moment of writing these words.
What is more, the breakdown that we're currently seeing also represents the move below the 61.8% Fibonacci retracement based on the August - September upswing. That's yet another argument to reason that crude oil is about to move lower.
There might be some short-term volatility on Wednesday, but the odds are that overall, crude oil will decline shortly.
It's not an important technical factor, but still interesting to note that the last time when crude oil topped above $63 (in May) it then declined until moving below $52. This suggests lower crude oil prices around the corner.
In our view, the following short position is currently justified from the risk-reward point of view.
Trading position (short-term; our opinion): short position with a stop-loss order at $58.27 and the binding exit target at $53.05 is justified from the risk/reward perspective.
Forex Analysis
As far as the currency market is concerned, Nadia usually covers the individual currency pairs. However, that's not what I specialize in, so instead of the usual format of these analyses, I will maximize their usefulness and likely profitability. This means that instead of focusing on individual currency pairs, I will cover the USD Index, as that's what I've been following on a regular basis for years.
It's also tradable, as there are futures on it (DX symbol) as well as ETFs, for instance the UUP and the UDN. The key development that might distort the price movements will take place on Friday, so the market is likely to move according to its trend until that time. Friday's price movement might be a bit more chaotic, though.
And which way points the current trend?
Up.
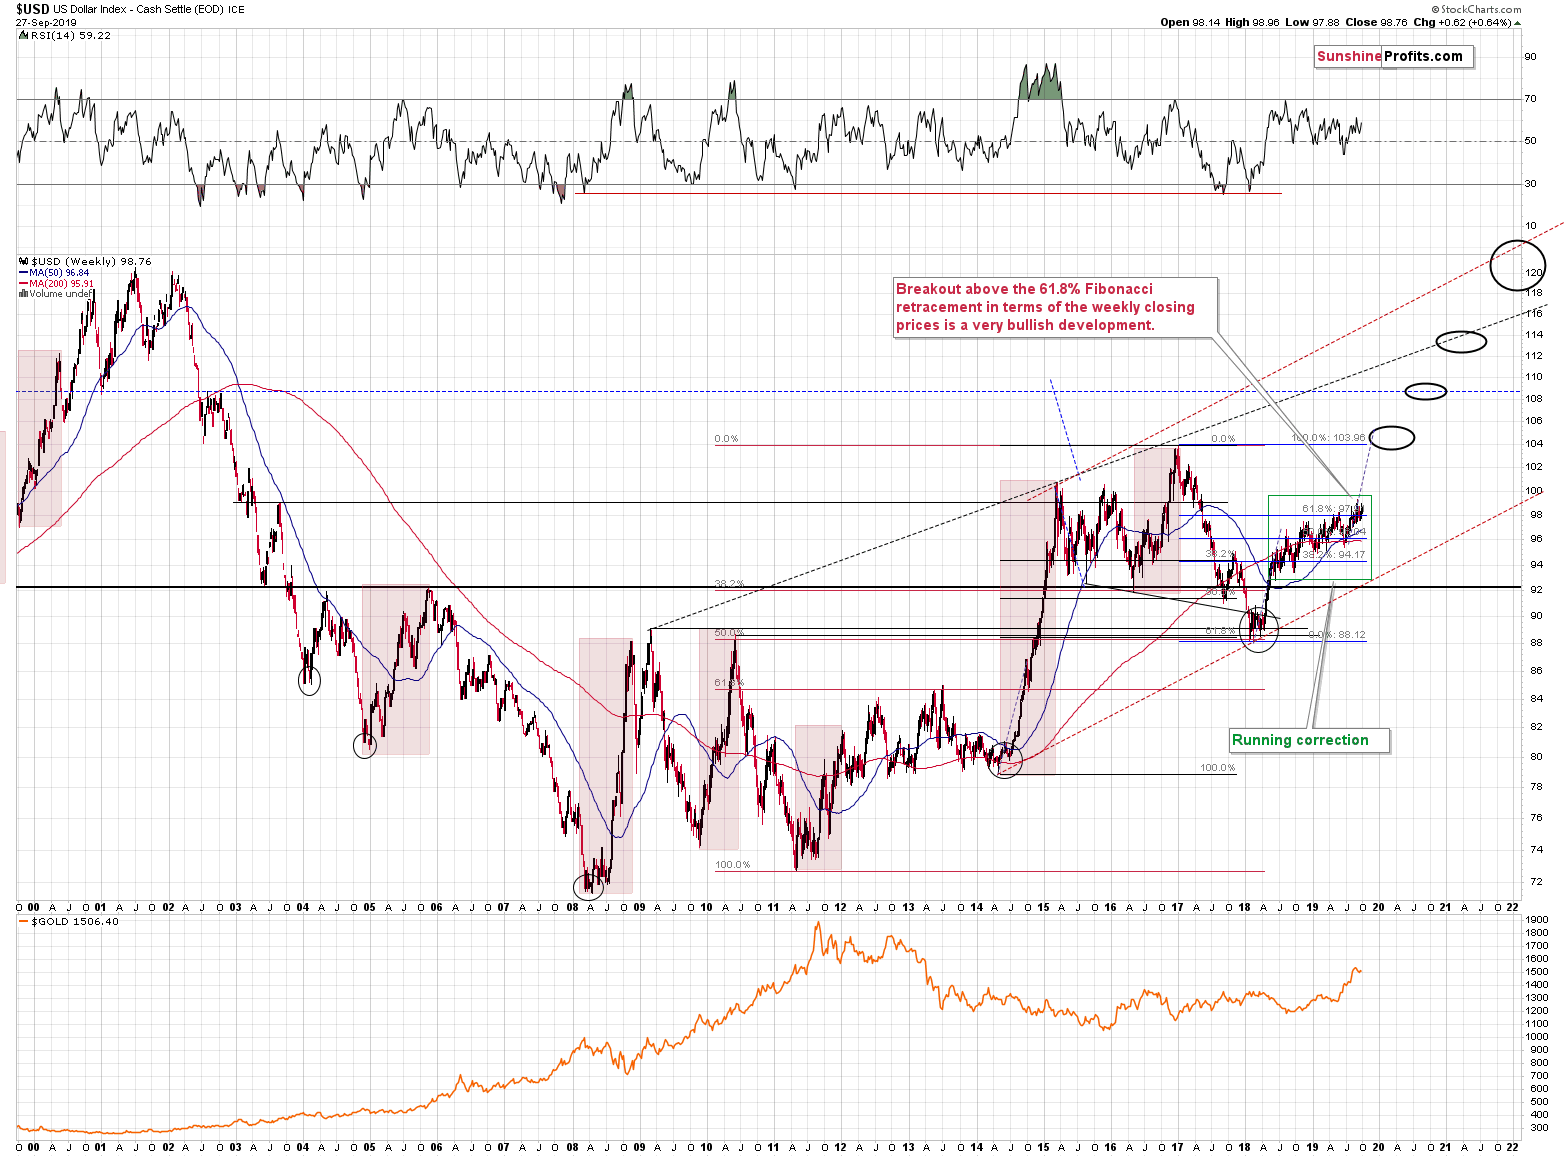
The long-term trend is up as even the dovish U-turn by the Fed, rate cuts, and myriads of calls from President Trump for lower U.S. dollar and much lower (even negative) interest rates, were not able to trigger any serious decline.
What we saw instead was a running correction that's the most bullish kind of corrections. It's the one in which the price continues to rally, only at significantly smaller pace.
On a short-term basis, we see that the USD Index is about to try to break above the previous 2019 high and at the same time to rally above the rising green resistance line.
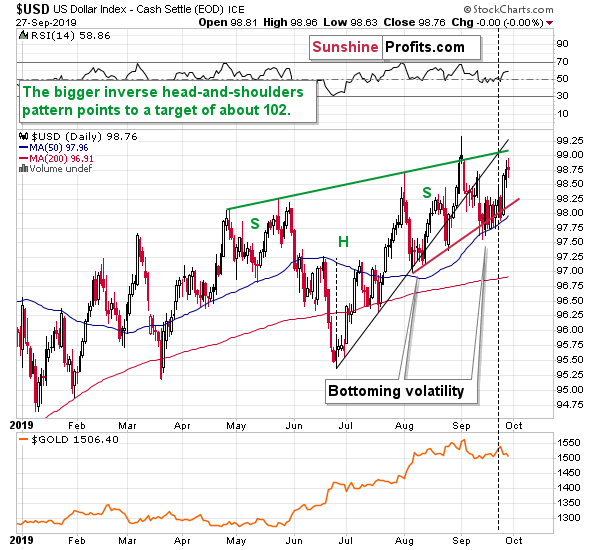
This line is no ordinary resistance. It's the neck level of the bullish inverse head-and-shoulders pattern, which means that once the breakout is complete and verified, the USD Index is likely to soar substantially higher. The likely target is about 102 or higher - more than 3 index points above the current price.
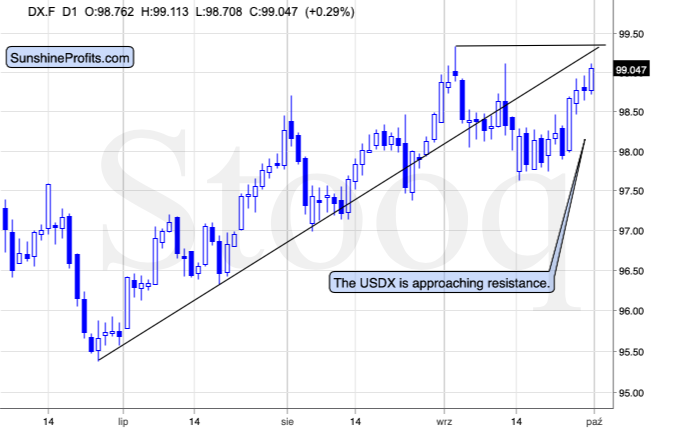
On a very short-term note (the above chart includes today's pre-market trading), we see that the USD Index is very close to its previous highs and the rising resistance line. Even though the outlook is bullish for long- and medium term, this resistance might trigger yet another corrective downswing before the big rally follows. Is it likely? We'd say that a breakout is a quite likely scenario, but it's prudent to actually wait for it to happen before opening a trading position.
So, we are prepared to take advantage of higher USD Index values, but at this time, it seems best not to open a new position right away. Instead, it's advisable to keep one's eyes open for a bullish confirmation and then - once we see it - quickly enter a long position in the USD Index.
In short, the outlook for the USD Index is very bullish, but the risk to reward ratio doesn't favor a new trading position right now - the risk is too big given the proximity of the resistance levels.
Trading position (short-term; our opinion): no position in the USD Index is currently justified from the risk/reward perspective. We will likely enter a new long position soon. Regarding the previously open positions in individual currency pairs, we're closing them this very moment. It means cashing in enormous profits in GBP/USD (we've opened the short position on Sep 20 at around 1.2500) that amply outweigh the much smaller effects from the positions in USD/JPY (opened on Sep 23) and USD/CHF (opened on Sep 4).
As always, we will keep you - our subscribers - informed.
Thank you.
Sincerely,
Przemyslaw Radomski, CFA
Editor-in-chief, Gold & Silver Fund Manager

