

The early bird catches the worm. Or is it rather the first mouse gets the trap while the second one gets the cheese? What can we make of such contradictions in the forex realm just now?
EUR/USD
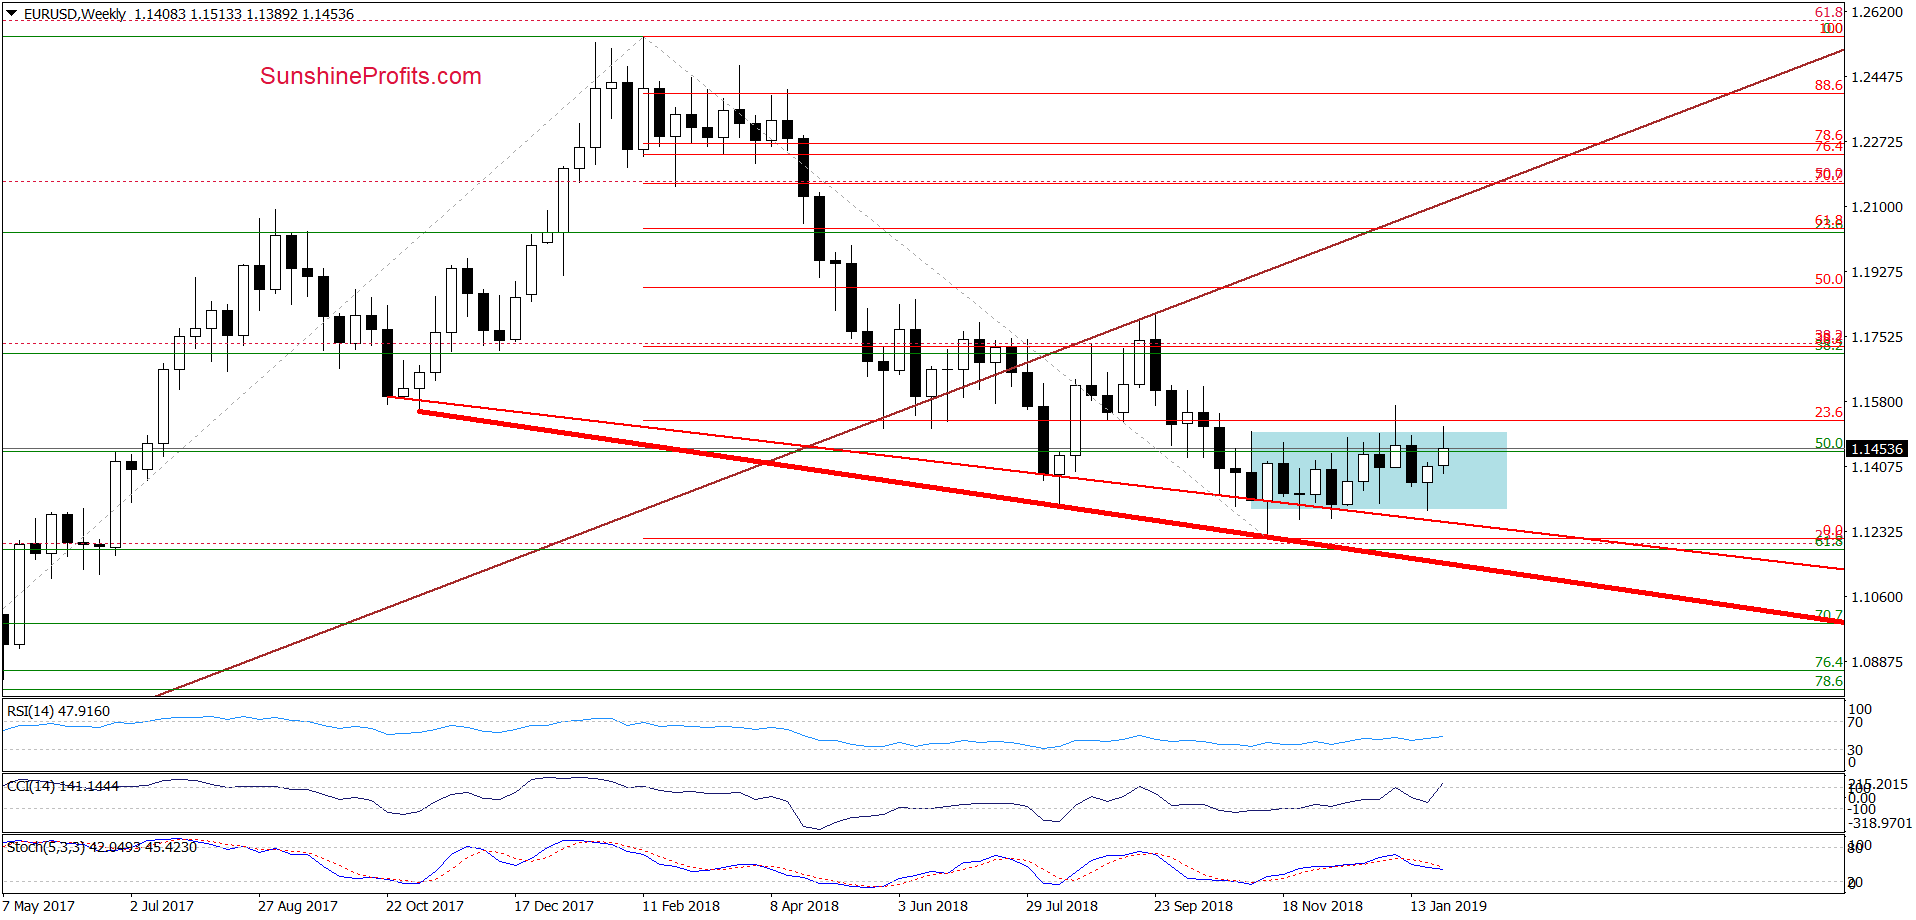
The weekly chart still shows the pair trading inside the blue consolidation. This is not a trend up or down, this is what a sideways trend looks like.
Quoting our Thursday’s alert:
(…) EUR/USD moved to our upside targets and closed the day above the brown triangle, which would suggest further improvement. Although this is bullish per se, we should keep in mind that we have seen similar breakout at the beginning of the month already. The price moved above the upper border of the blue consolidation, but the gains were given back shortly.
(...) Will the history repeat itself in the very near future? Or at least rhyme, as Mark Twain would say?
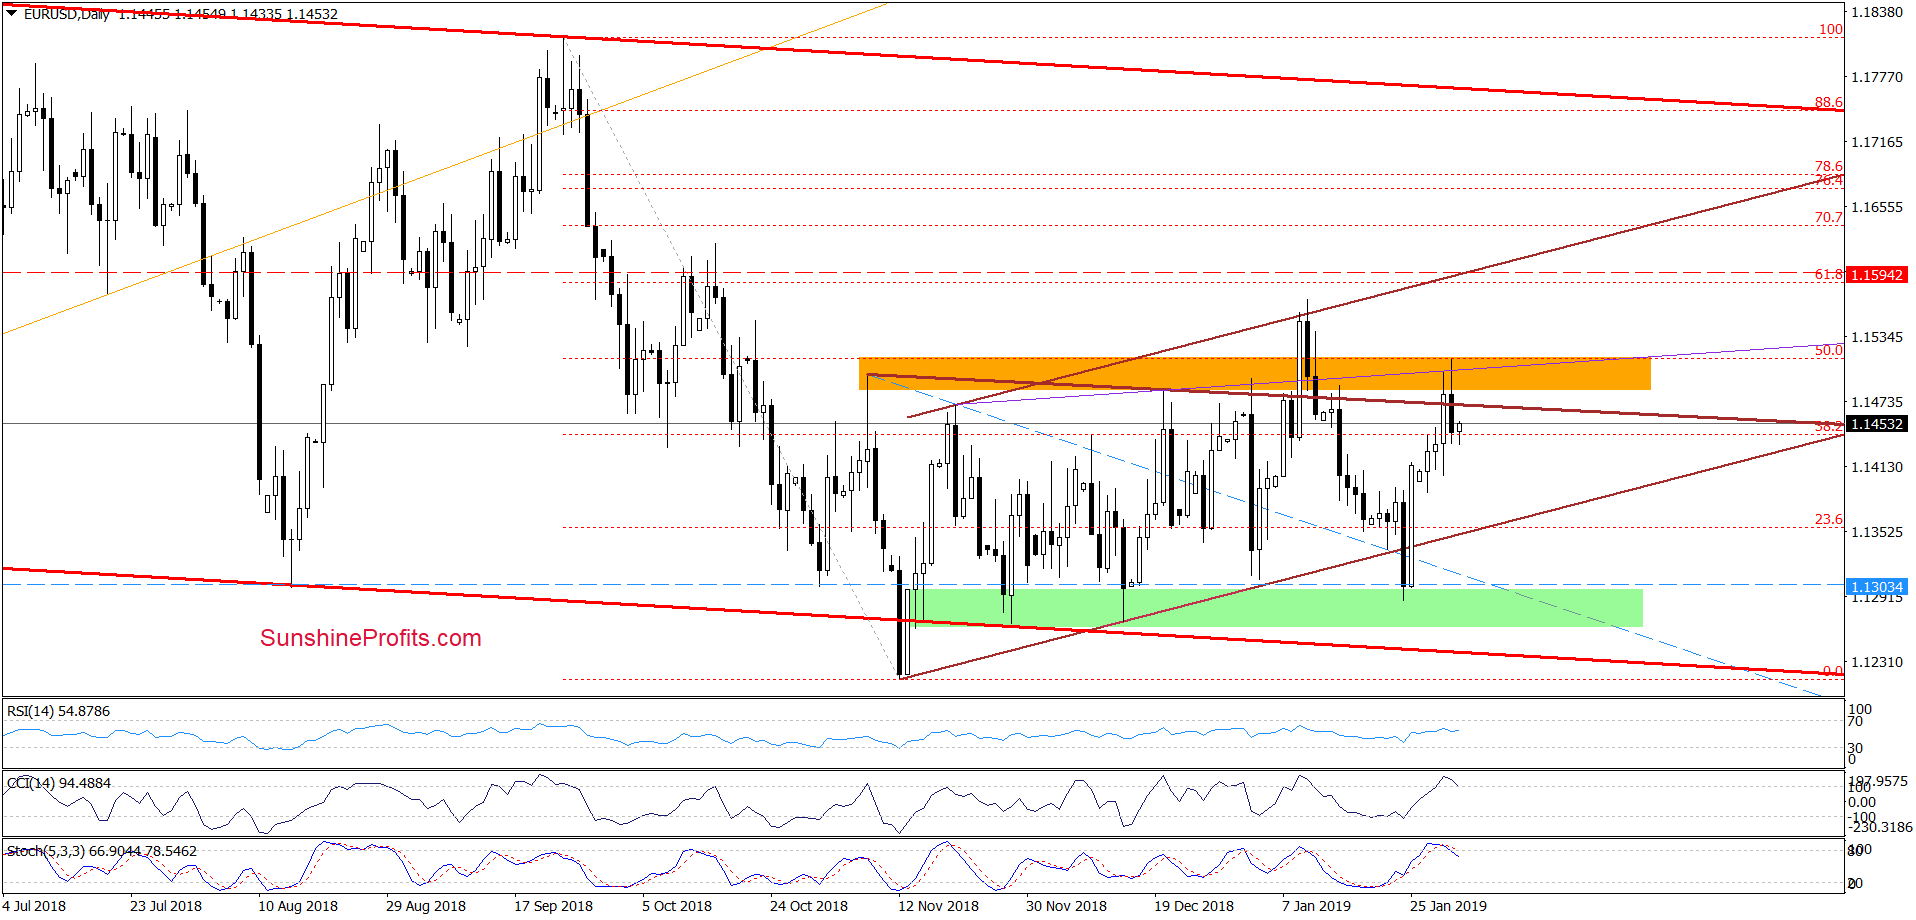
We see that yesterday the price visited the orange resistance zone once again, beating the previous day’s intraday high. Again, this breakout attempt was rejected and the pair finished the day near the daily lows. Today, the bulls are not doing much better as the current price of around 1.1475 is nothing to write home about.
Looking at both charts, the pair invalidated its earlier breakouts - both above the upper border of the blue consolidation on the weekly chart, and also above the upper line of the brown triangle on the daily chart. Just like we assumed yesterday it was likely to do.
Stochastics generated a sell signal, while the CCI is very close to doing the same. This remains valid also considering the current price of around 1.1475. However, we think it’s likely that we will see a verification of yesterday’s breakdown first, before a bigger move to the downside is triggered.
Therefore, we’ll definitely consider opening short positions later on. First though, we would like to see how the breakdown verification scenario develops further today. In line with the above, we would expect EUR/USD to turn south. The lower border of the brown triangle or even the green support area would be prime retest candidates here .
Additional argument for opening short positions would be today’s close within the blue consolidation marked on the weekly chart. Let’s see the market commit to ourselves first.
Trading position (short-term; our opinion): No positions are justified from the risk/reward perspective. We will keep you informed should anything change, or should we see a confirmation/invalidation of the above.
GBP/USD
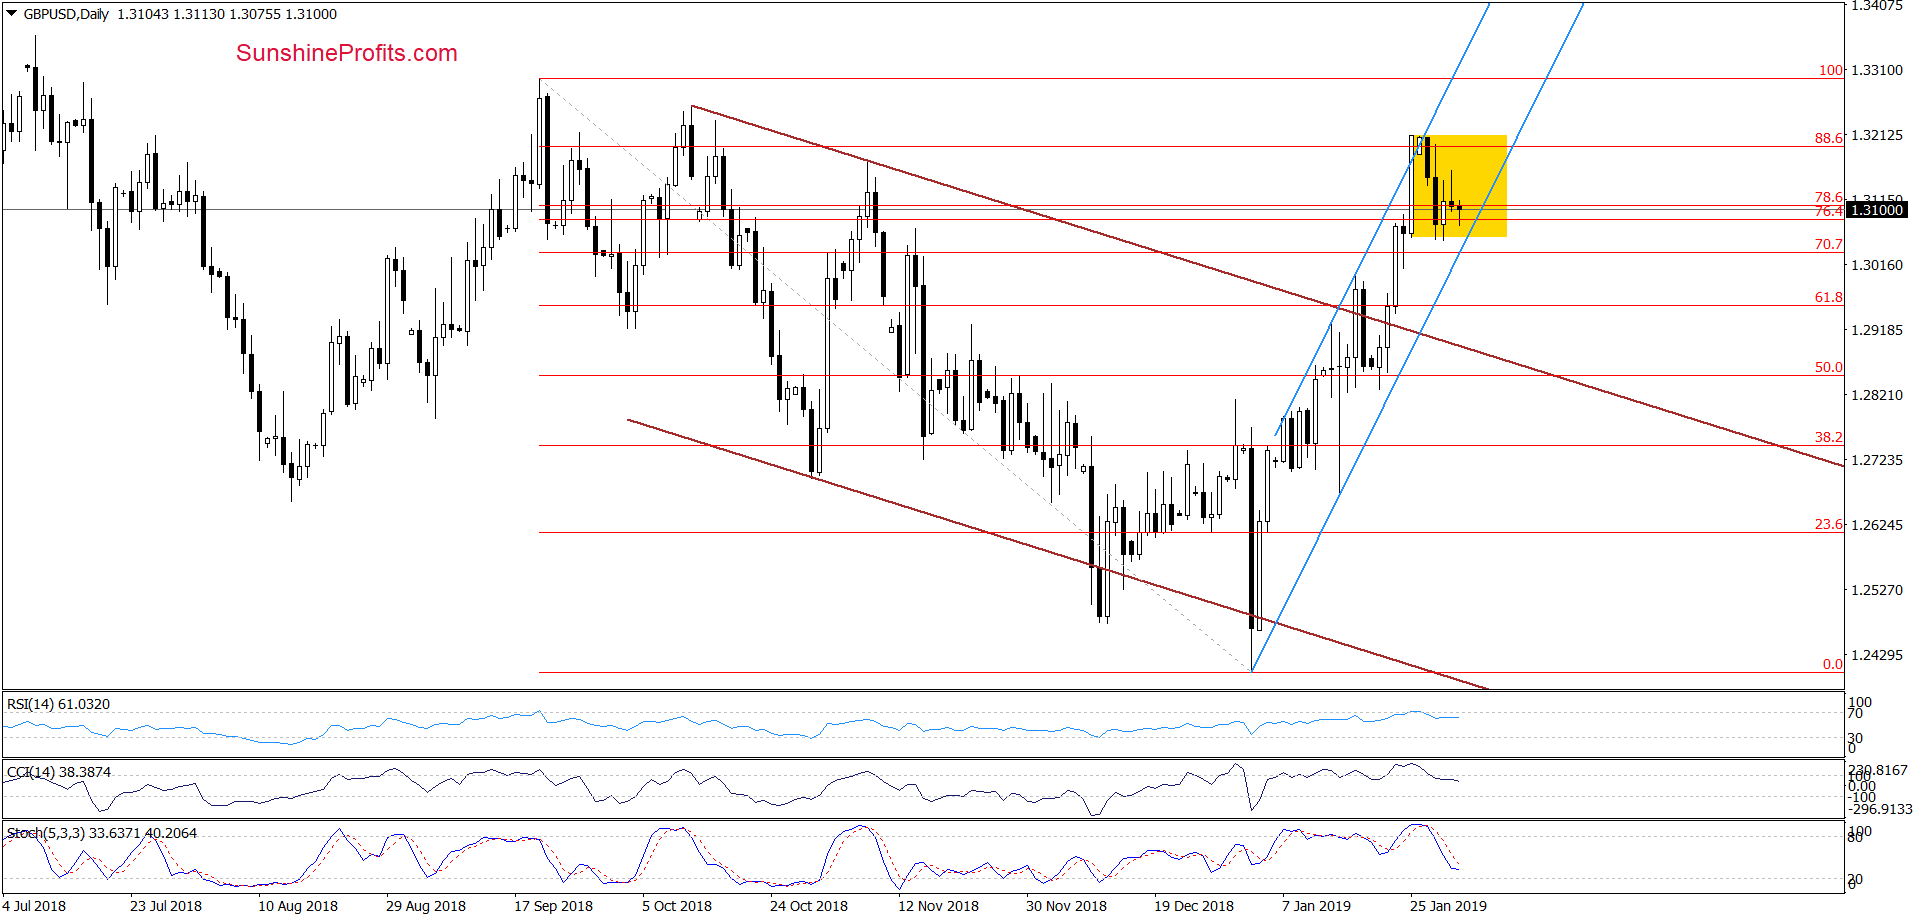
From today’s point of view, we see that the overall situation in GBP/USD remains unchanged as the exchange rate is still trading inside the yellow consolidation. True, the indicators are bearishly positioned but not bearishly enough to make us jump in with both feet.
Therefore, our last commentary remains up-to-date:
(…) GBP/USD paused and is currently stuck in the yellow consolidation area. Yesterday's session brought us retest of the highs that was soundly rejected and the pair finished the day near its lows. Additionally, the earlier tiny breakout above the upper line of the blue rising trend channel was invalidated and the daily indicators generated sell signals, increasing the probability of further deterioration.
(…) The bearish developments we look for are a breakdown below the lower border of the yellow consolidation zone, preferably with a breakdown below the lower line of the blue trend channel, too. Remember, it would be wise to see the market commit to us first before we commit to the market. Therefore, if we see such a price action, we’ll consider opening short positions in the following day.
Indeed, patience is still the name of the game with this currency pair situation. It is definitely worth to be picky when it comes to the choice of opportunities to act on and choose only the strongest ones.
Trading position (short-term; our opinion): No positions are justified from the risk/reward perspective. We will keep you informed should anything change, or should we see a confirmation/invalidation of the above.
USD/JPY
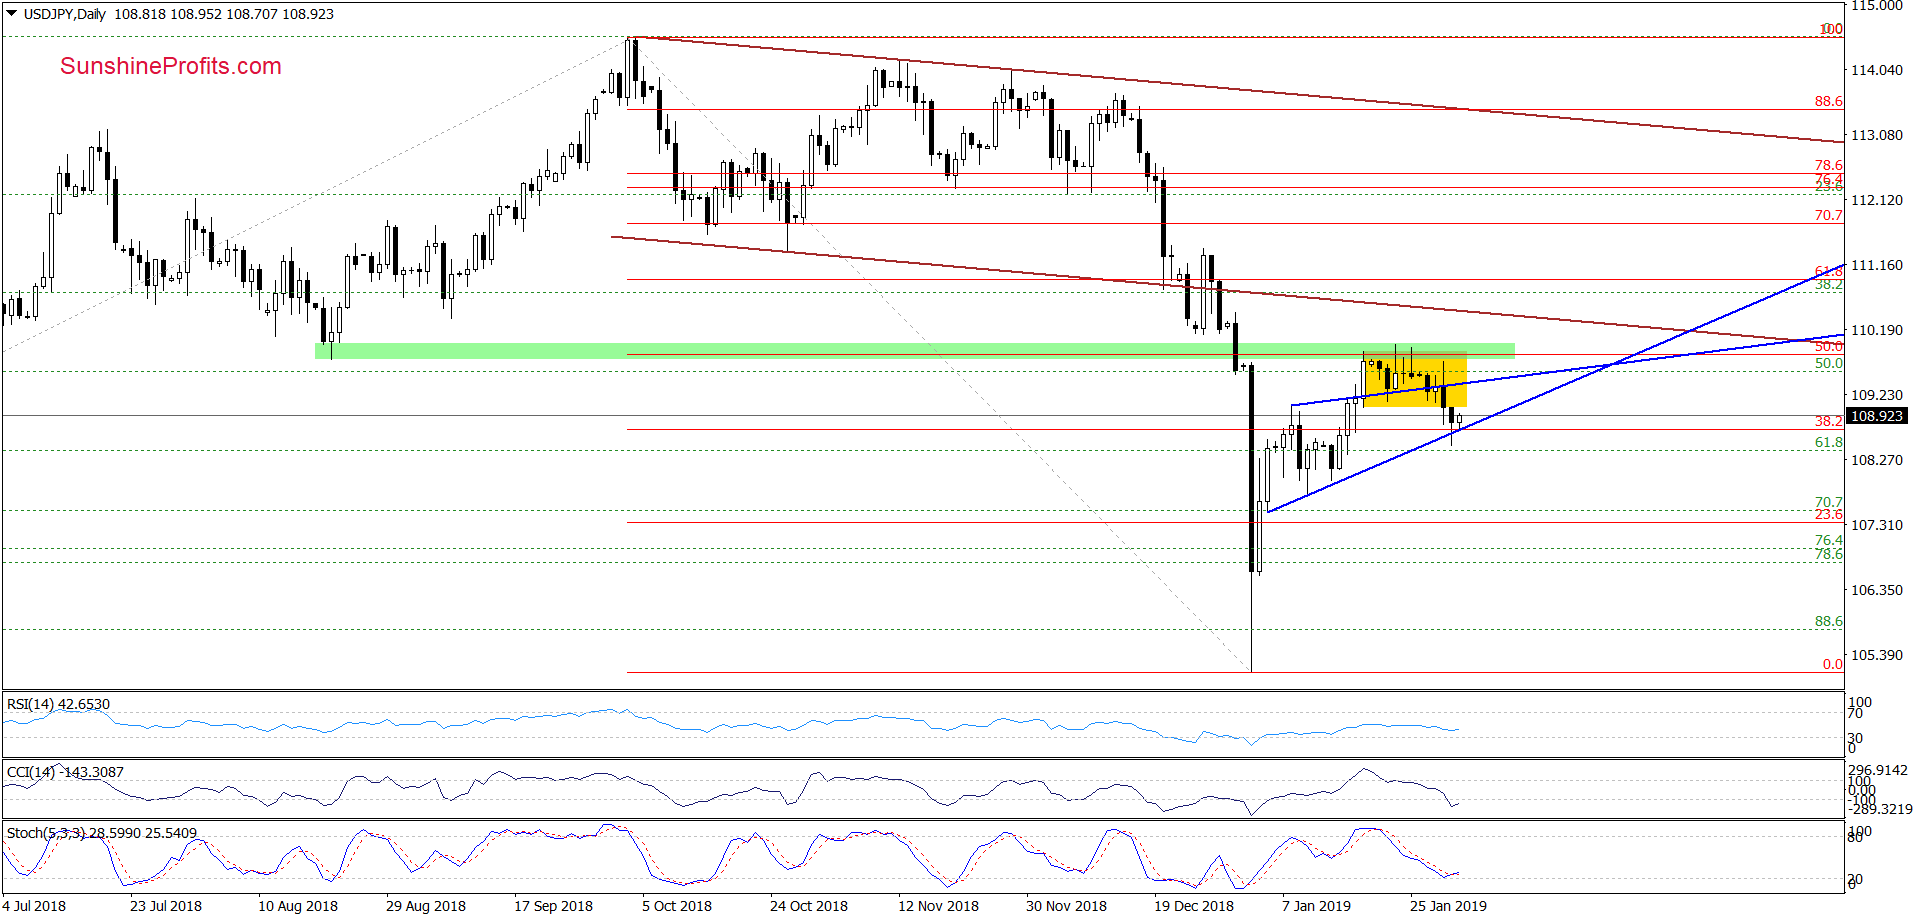
The first thing that catches the eye on the daily chart is a breakdown below the lower border of the yellow consolidation. A positive event for the bears? Yes, but unfortunately only at first sight.Why? Although the pair closed yesterday’s session below the formation, USD/JPY is still trading above the lower line of the blue triangle, which continues to keep declines in check for now.
Additionally, Stochastics generated a buy signal, while the CCI slipped to its oversold area, insinuating readiness to also generate a buy signal in the near future (maybe even on Monday). Seeing the ensuing price action and its reflection in the indicators down the line first is a prudent course of action here.
Connecting the dots, as long as there is no breakdown below the lower line of the blue triangle, opening short positions isn’t justified from the risk/reward perspective. One more rebound inside the triangle can’t be ruled out. A good entry point gives us more comfort managing the trade.
Trading position (short-term; our opinion): No positions are justified from the risk/reward perspective. We will keep you informed should anything change, or should we see a confirmation/invalidation of the above.
Thank you.
Nadia Simmons
Forex & Oil Trading Strategist

