

Even more than one. The key currency exchange rates have recently moved back and forth without a decisive breakout or breakdown. There were some indications of what’s likely to happen, but it was not until today that we saw important confirmations that made us open new trading positions. You will find details below.
- EUR/USD: short (a stop-loss order at 1.1746; the initial downside target at 1.1343)
- GBP/USD: none
- USD/JPY: none
- USD/CAD: long (a stop-loss order at 1.3018; the initial upside target at 1.3333)
- USD/CHF: none
- AUD/USD: none
EUR/USD
In our last commentary on this currency pair, we wrote the following:
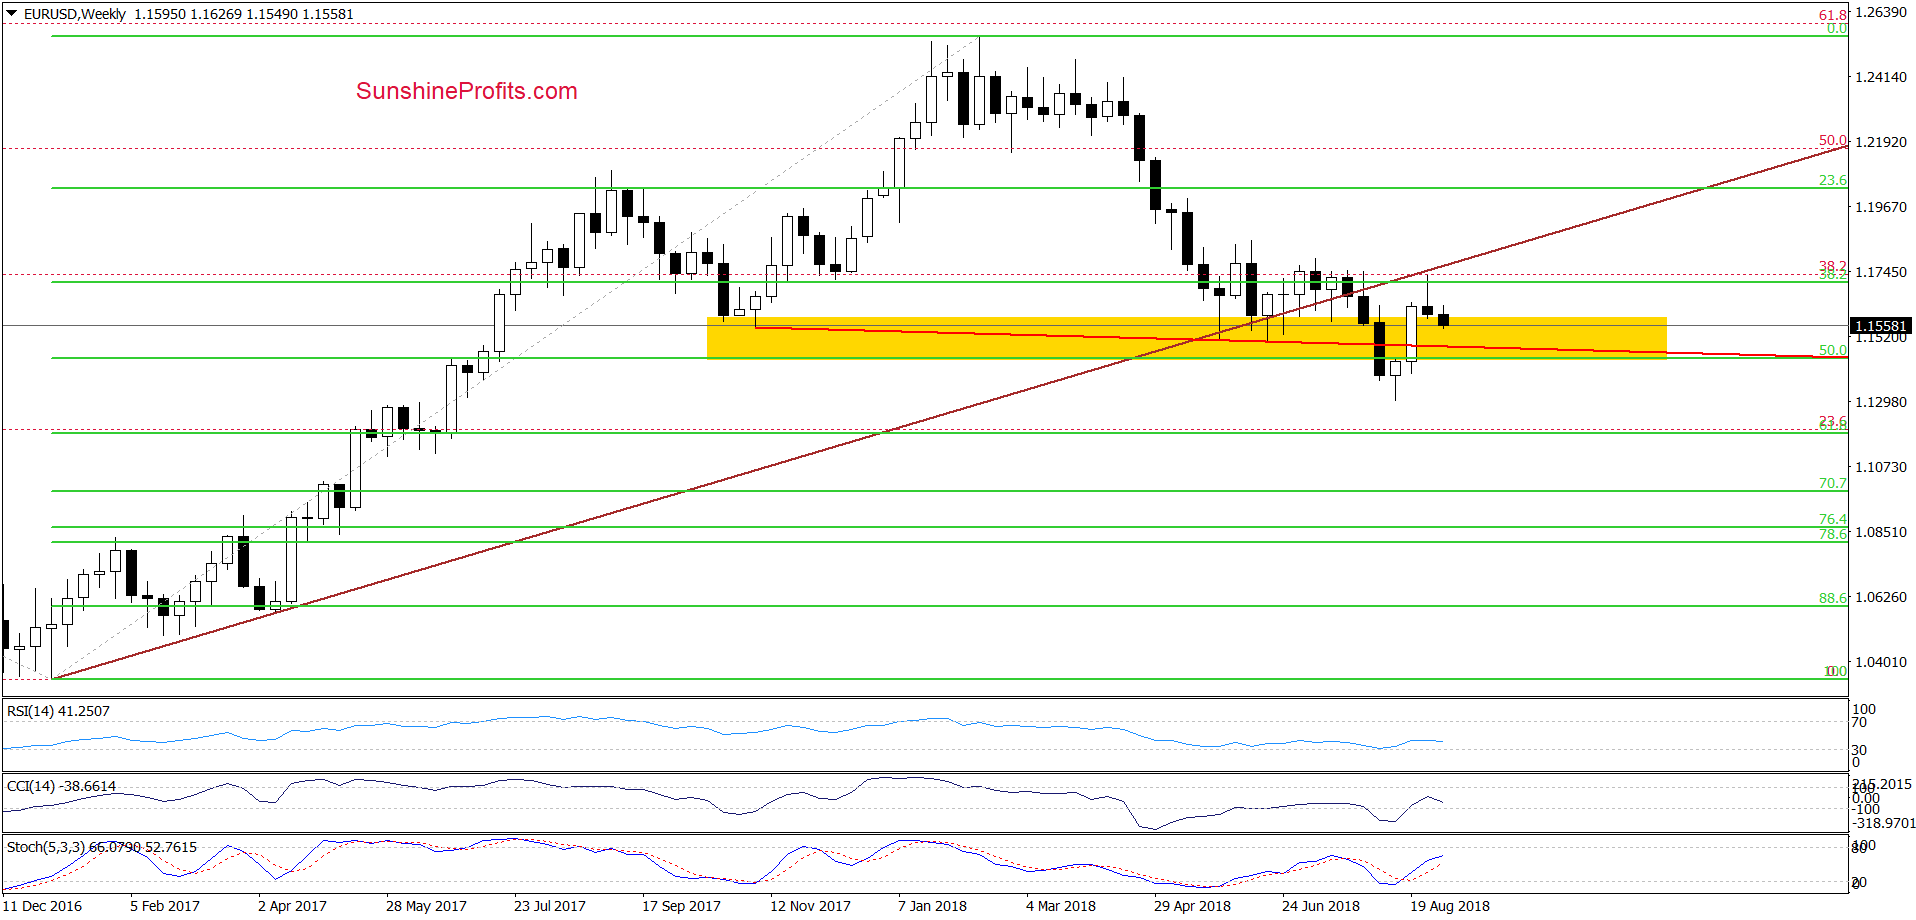
(…) although currency bulls managed to push EUR/USD above the upper border of the red declining trend channel and the orange resistance line once again, the exchange rate is still trading below the long-term brown line (seen on the weekly chart).
This means that as long as there is no comeback above this line all upswing could be nothing more than a verification of the earlier breakdown. Additionally, the current position of the daily indicators (the CCI and the Stochastic Oscillator generated the sell signals) suggests that the space for gains is limited and reversal is just around the corner.
If this is the case and we see a daily closure under both short-term lines (marked on the daily chart), we’ll likely open short positions.
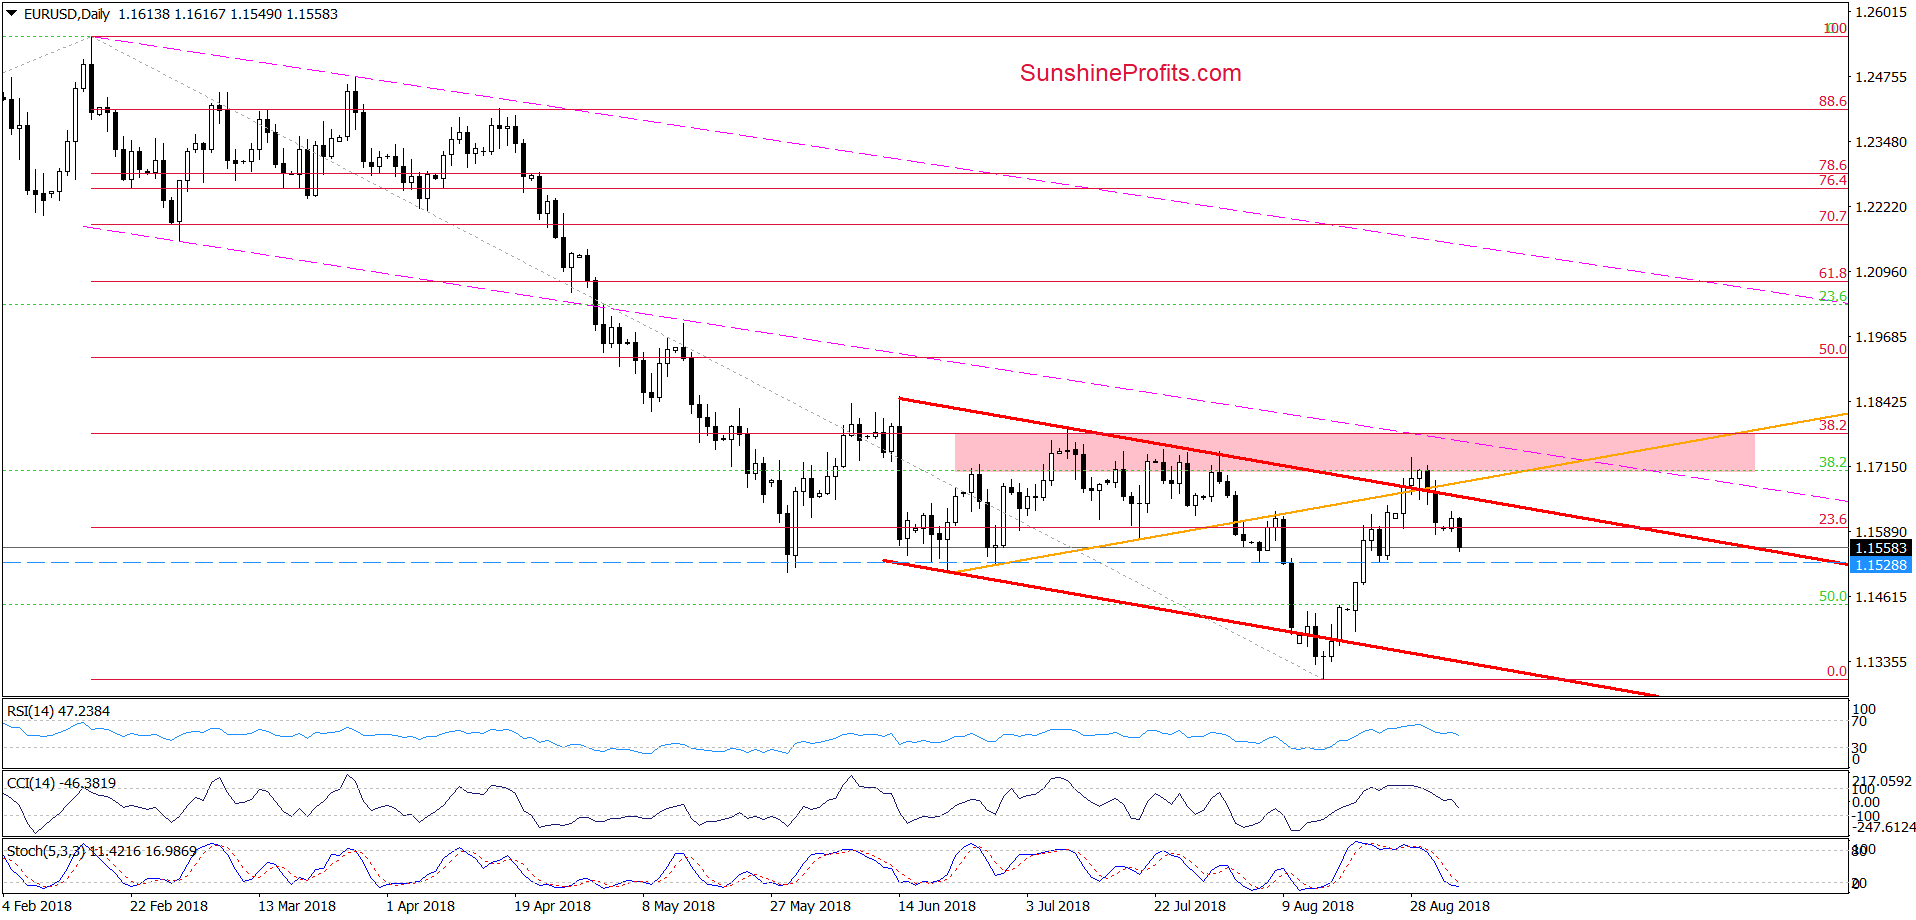
From today’s point of view, we see that the situation developed in tune with the above scenario and EUR/USD Finished Friday’s session under the upper line of the red declining trend channel and the orange line, invalidating the earlier breakouts.
Earlier today, this bearish development encouraged the sellers to act, which resulted in further deterioration. Therefore, we believe that opening short positions is justified from the risk/reward perspective – especially when we factor in the current situation in the USD Index.
What do we mean by that? Let’s take a look at the daily chart below.
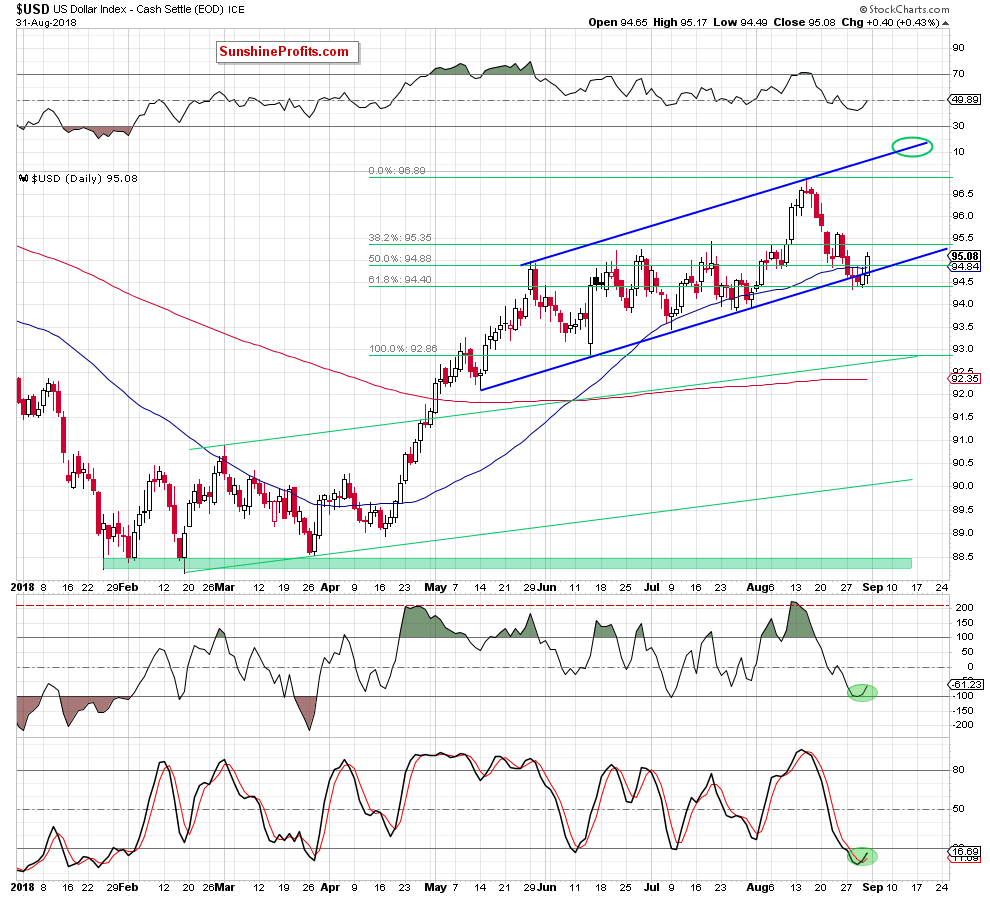
The first thing that catches the eye on the above chart is an invalidation of a tiny breakdown under the lower border of the blue rising trend channel and the 50-day moving average.
Additionally, the greenback bounced off the 61.8% Fibonacci retracement and the CCI and the Stochastic Oscillator generated the buy signals, significantly increasing the probability of another bigger move to the upside.
If this is the case and the index extends gains from here, we’ll likely see not only a test of the late-August highs, but also a climb to the recent highs (around 96.90) or even the upper border of the blue rising tend channel in the following week(s).
What impact could it have on EUR/USD?
In our opinion, the pair will decline to at least 1.1343, where the recent lows (in terms of daily closures) and the lower line of the red declining trend channel currently is.
Connecting the dots, as we mentioned earlier, short positions are justified from the risk/reward perspective. All needed details below.
Trading position (short-term; our opinion): Short positions with a stop-loss order at 1.1746 and the initial downside target at 1.1343 are justified from the risk/reward perspective. We will keep you informed should anything change, or should we see a confirmation/invalidation of the above.
GBP/USD
Quoting our Thursday’s alert:
(…) GBP/USD climbed above the 50% Fibonacci retracement and approached the upper line of the very short-term blue rising trend channel, which suggests that even if the pair moves higher from here, the space for growth may be limited and the bears attack should not surprise us in the coming days.
If the situation develops in tune with our assumptions, GBP/USD will likely drop to the lower line of the above-mentioned blue rising trend channel.
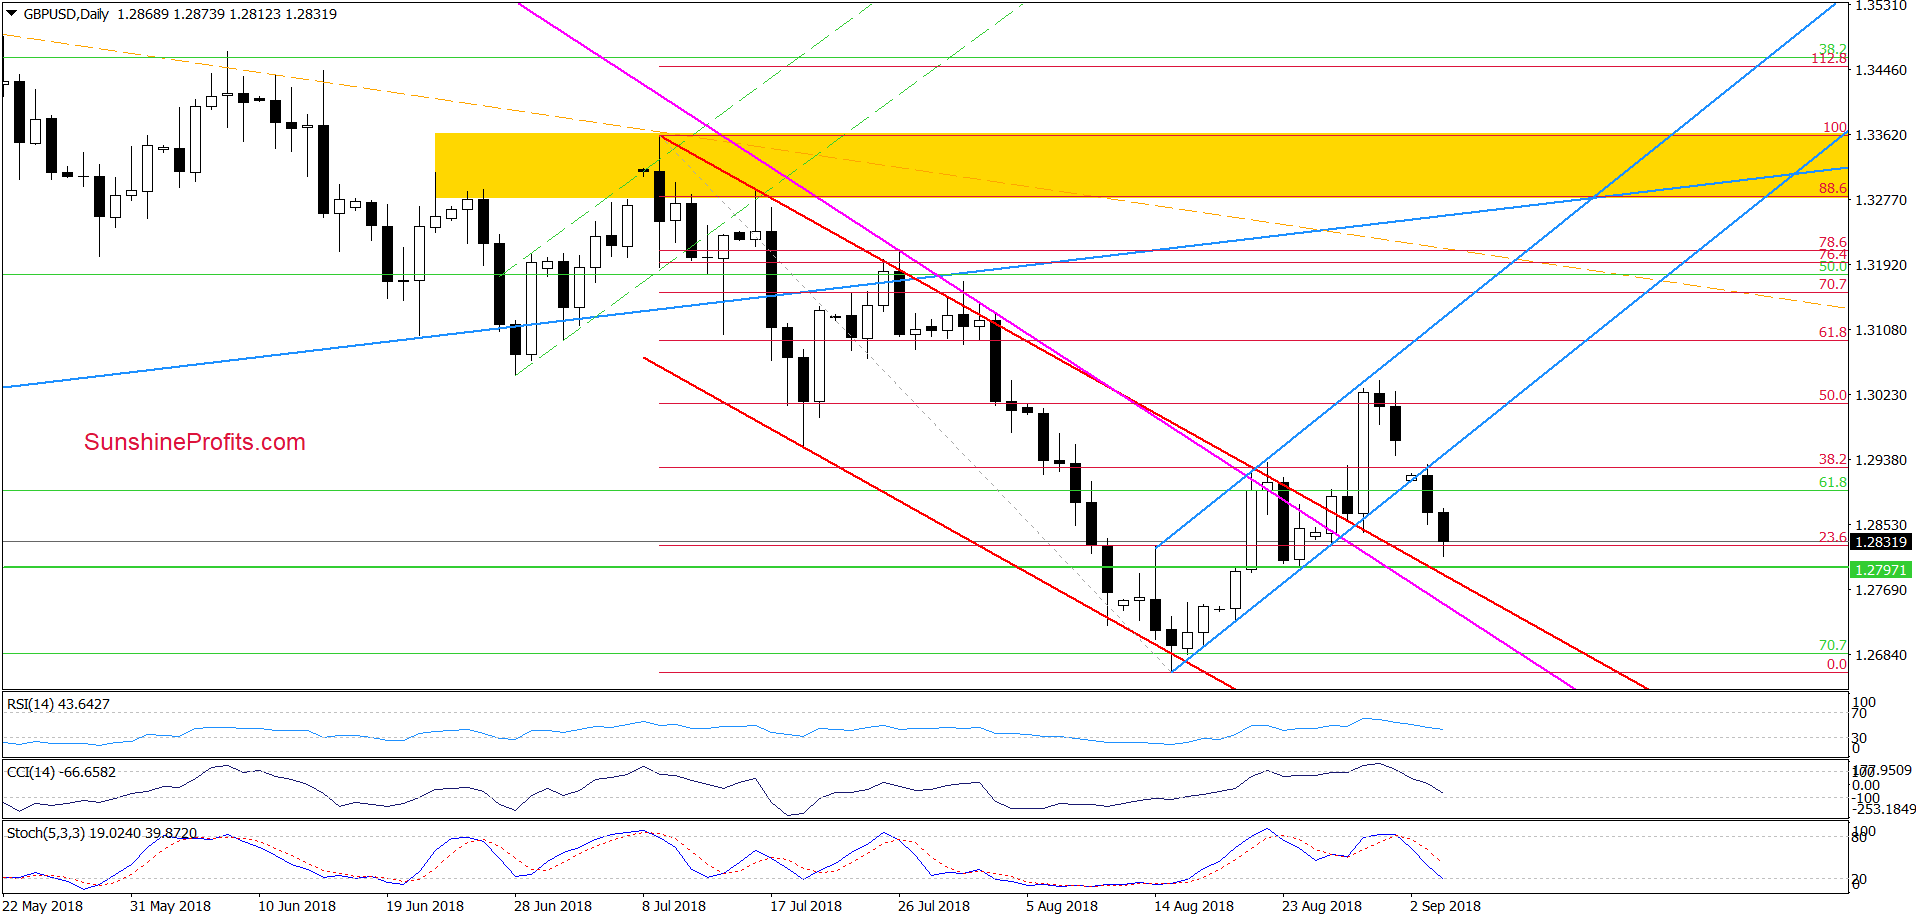
Looking at the daily chart, we see that the pair not only slipped to our first downside target, but also closed yesterday’s session below it, which is a bearish sign. Additionally, the sell signals generated by the indicators continue to support the sellers, which suggests lower values of GBP/USD in the following days.
How low could the exchange rate go in the following days?
In our opinion, the next (and the nearest) target for the bears will be the previously-broken upper line of the red declining trend channel and then the pink declining support lines. If they are broken, GBP/USD will test the recent lows.
Although this scenario is reinforced by the above-mentioned situation in the USD Index, we think that the way to the south is not open as wide as in the case of EUR/USD, therefore, we do not open short positions yet.
However, an invalidation of the breakout above the upper line of the red declining trend channel will be likely enough reason for us to do it. Stay tuned, because we will keep you informed should anything change, or should we see a confirmation/invalidation of the above.
Trading position (short-term; our opinion): No positions are justified from the risk/reward perspective at the moment of writing this alert, but if we see at least one more bearish development, we’ll likely go short in the very near future.
USD/CAD
Quoting our Wednesday’s alert:
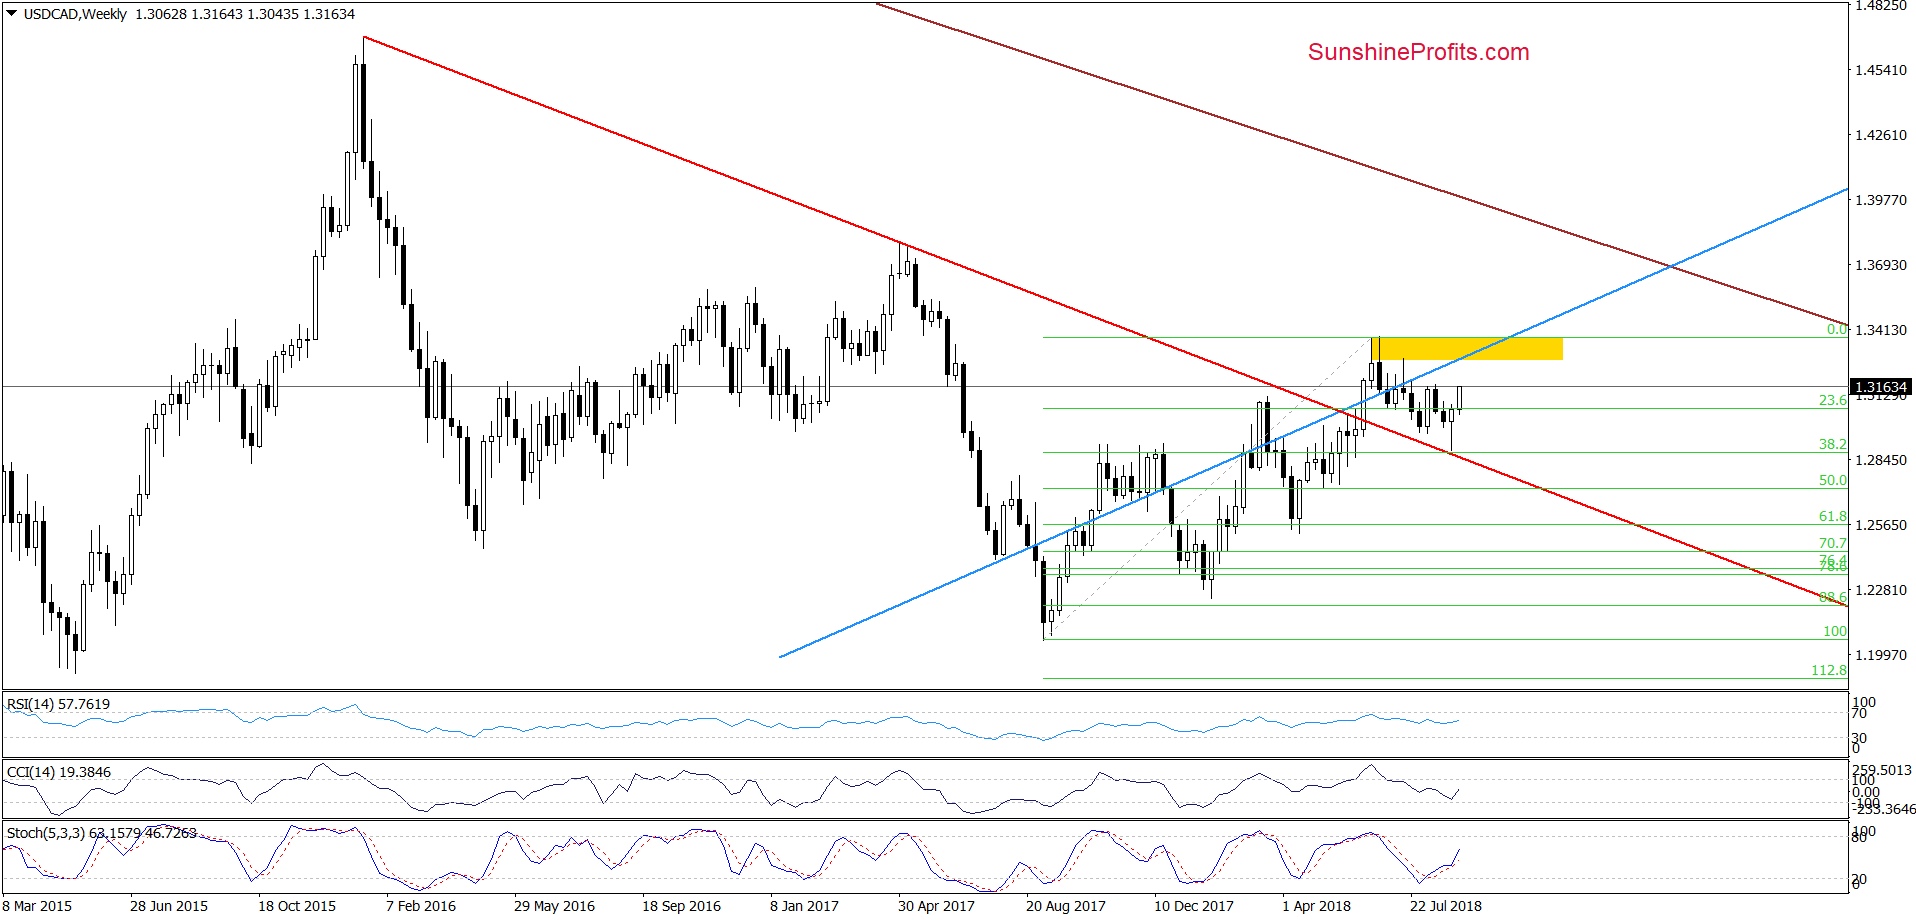
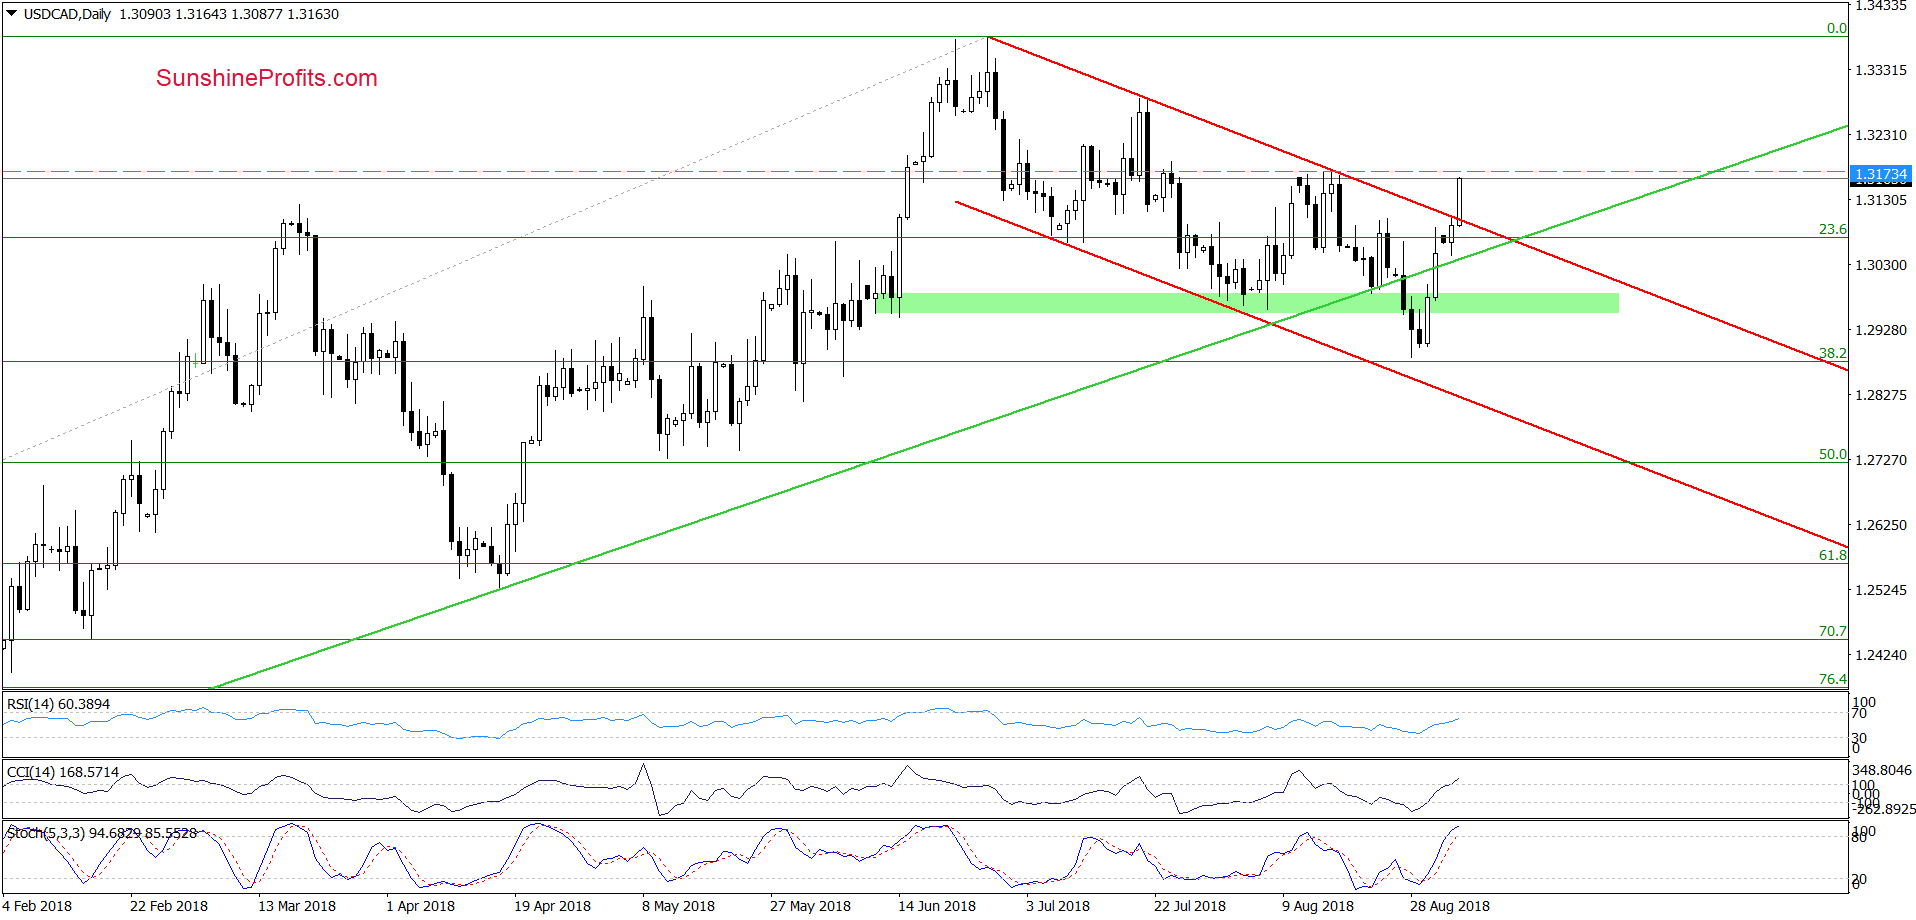
(…) the combination of the previously-broken long-term red declining support line (seen more clearly on the weekly chart), the 38.2% Fibonacci retracement and the proximity to the lower border of the red declining trend channel (marked on the daily chart) paused earlier declines.
Will this area manage to stop the sellers in the following days?
Such scenario is very likely – especially when we consider the recent decline as a verification of the earlier breakout above the previously-broken long-term red declining support line marked on the medium-term chart.
Therefore, if we see a rebound from here, USD/CAD will likely not only invalidate the breakdown under the green zone, but also test the upper border of the red declining trend channel in the following days. (…) such scenario will be even more likely and reliable if the CCI and the Stochastic Oscillator generate buy signals in the very near future. If we see the combination of these factors, we’ll consider opening long positions.
From today’s point of view, we see that the situation developed in line with our assumptions, which resulted in a breakout above the upper line of the red declining trend channel. Taking this bullish development into account and combining it with the medium-term picture and the buy signals generated by the indicators, we think that USD/CAD will extend gains in the coming week.
Where will the bulls head next?
If the exchange rate breaks above the mid-August peaks, the next target will be around 1.3278 (July highs) or we’ll even see a test of the June peaks in the coming week(s). Taking all the above into account, we believe that opening long positions is justified from the risk/reward perspective. All details below.
Trading position (short-term; our opinion): Long positions with a stop-loss order at 1.3018 and the initial upside target at 1.3333 are justified from the risk/reward perspective. We will keep you informed should anything change, or should we see a confirmation/invalidation of the above.
Thank you.
Nadia Simmons
Forex & Oil Trading Strategist
Przemyslaw Radomski, CFA
Founder, Editor-in-chief, Gold & Silver Fund Manager
Gold & Silver Trading Alerts
Forex Trading Alerts
Oil Investment Updates
Oil Trading Alerts

