

The highlight of the previous week was the breakout above the very long-term resistance line based on the peaks created in the second half of 2015. Is it possible that the correction that we observed in recent days thwarted the pro-growth scenario?
EUR/USD: short (a stop-loss order at 1.1833; the initial downside target at 1.1588)
GBP/USD: none
USD/JPY: long (a stop-loss order at 111.15; the initial upside target at 113.50)
USD/CAD: none
USD/CHF: none
AUD/USD: short (a stop-loss order at 0.7510; the initial downside target at 0.7315)
EUR/USD
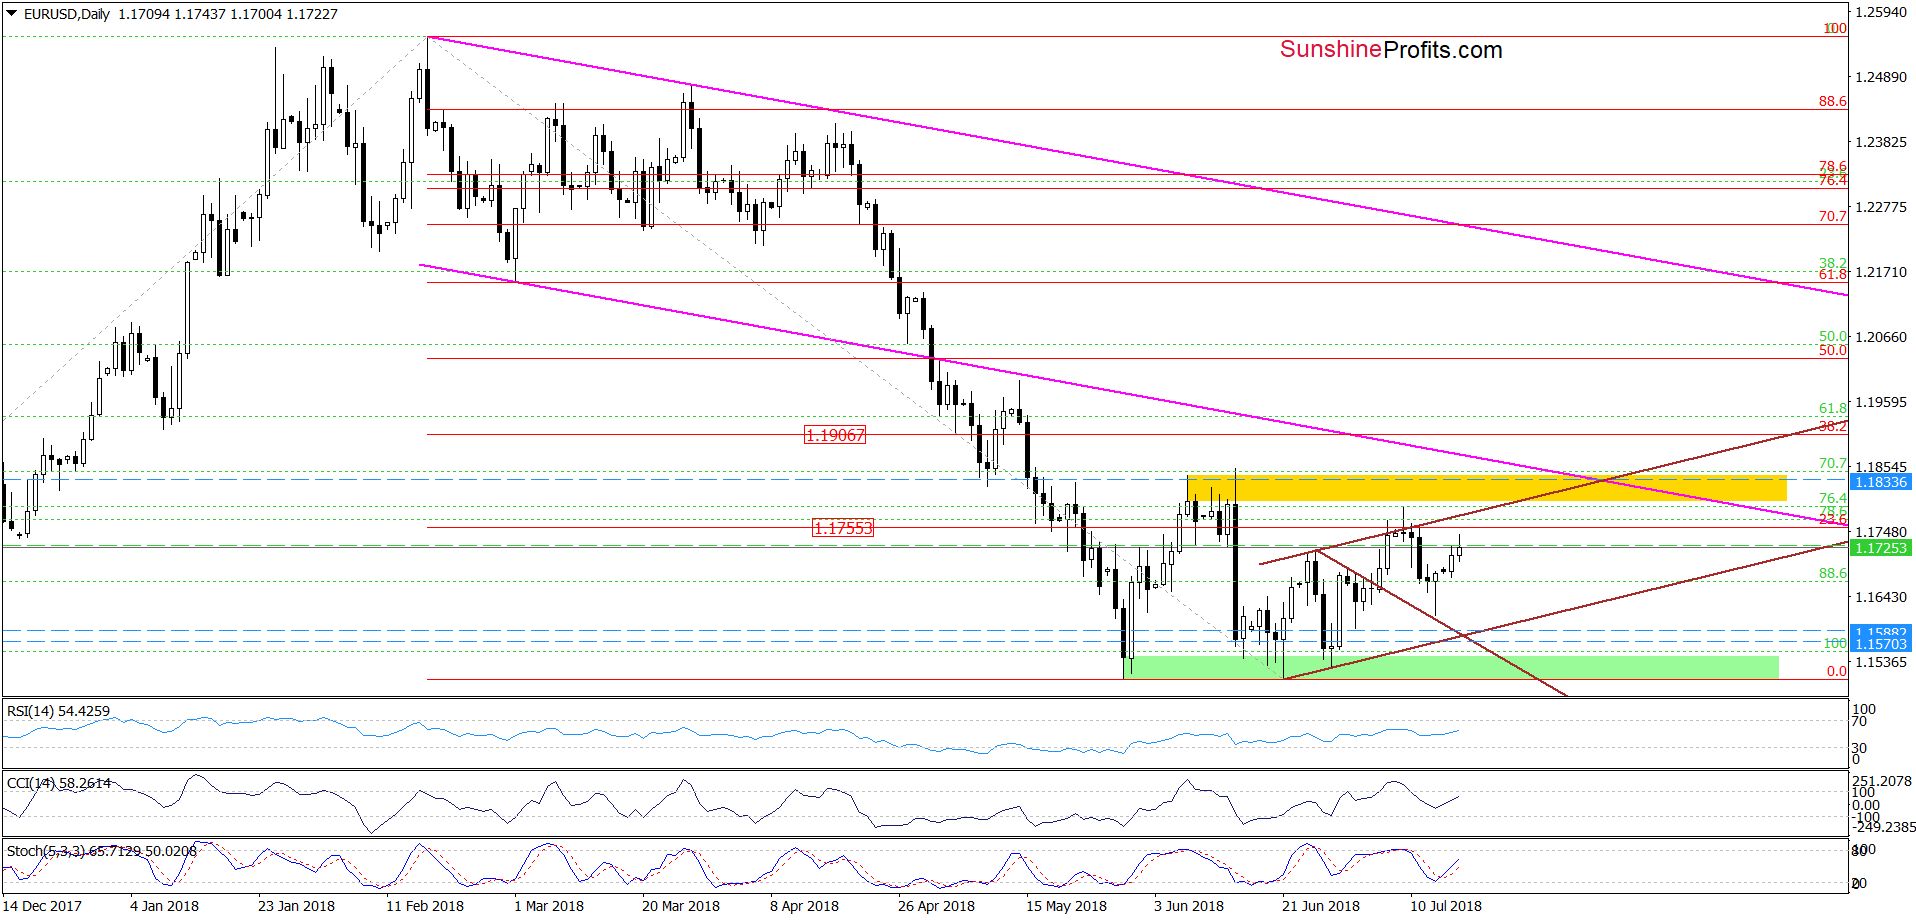
From today’s point of view, we see that the overall situation in the short term hasn’t changed much as EUR/USD is still trading inside the brown rising trend channel, which suggests that as long as there is no breakout above the upper line of the formation higher values of EUR/USD are not likely to be seen and another attempt to move lower should not surprise us in the coming week.
If this is the case, and currency bears show their claws once again, the first downside target will be the lower border of the brown rising trend channel (currently around 1.1588).
Trading position (short-term; our opinion): Short positions with a stop-loss order at 1.1833 and the initial downside target at 1.1588 are justified from the risk/reward perspective. We will keep you informed should anything change, or should we see a confirmation/invalidation of the above.
USD/JPY
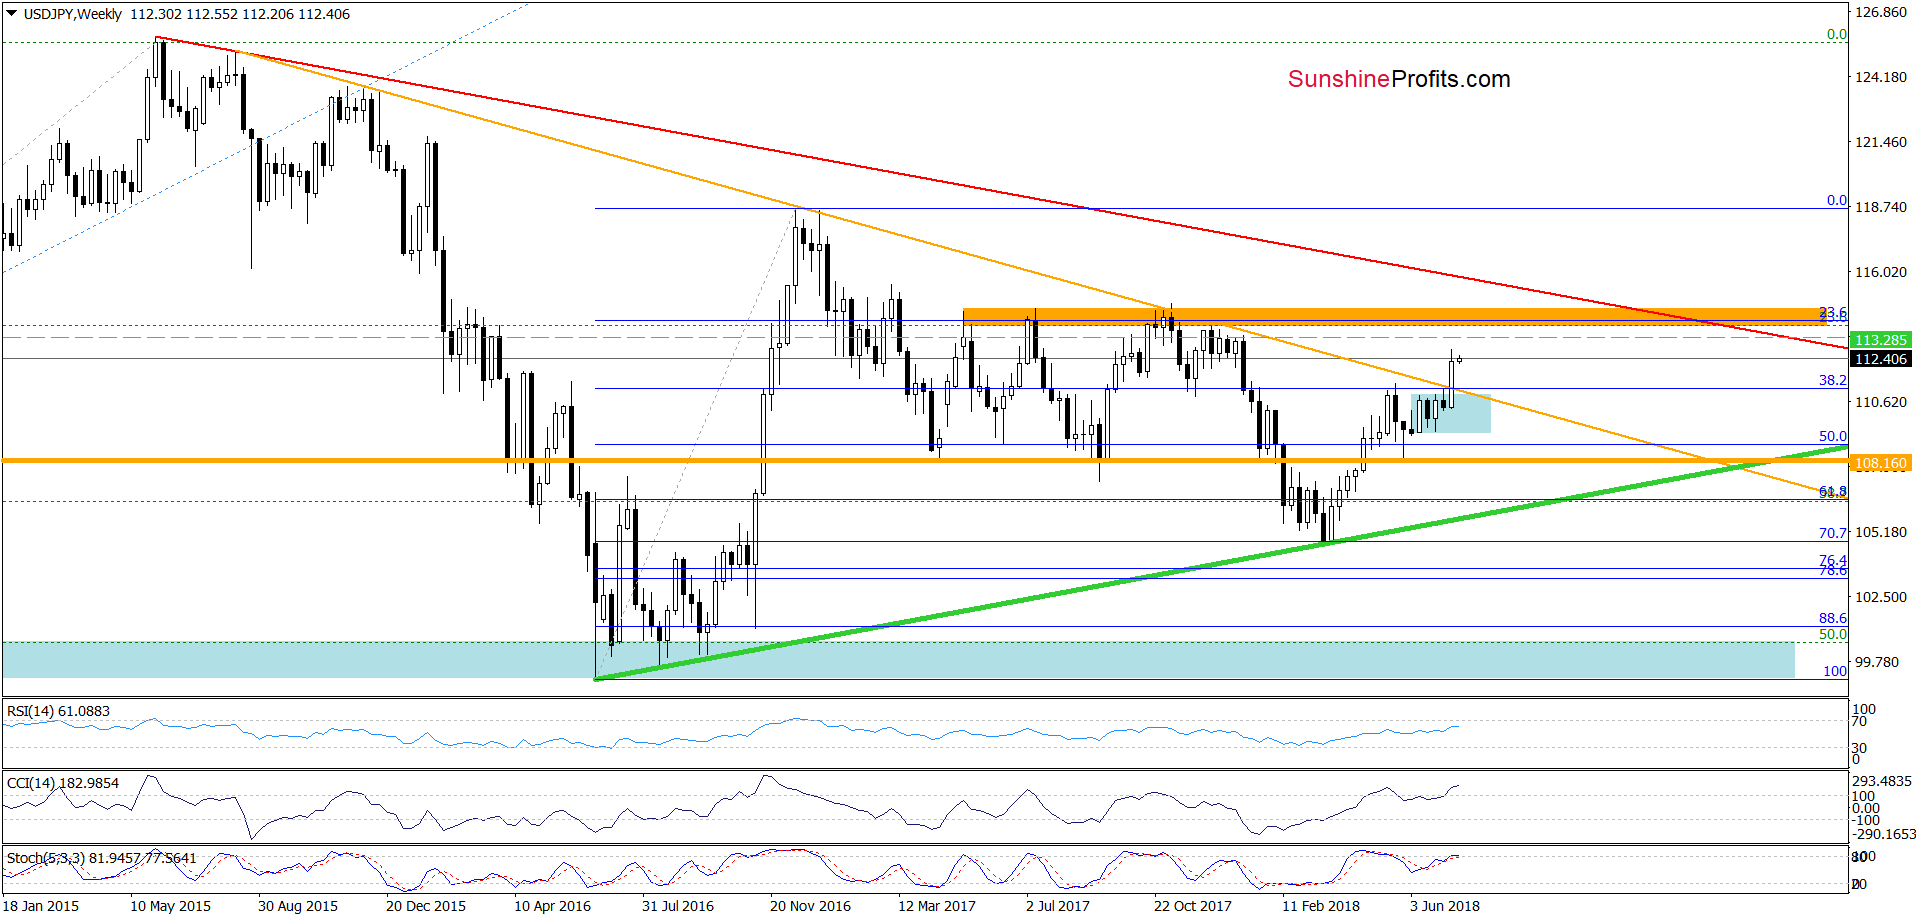
On the medium-term chart, we see that although USD/JPY pulled back a bit, last week’s breakout above the major resistance (the orange declining line based on the August 2015, December 2015 and January 2017 peaks) and its positive impact on the price are still in effect, supporting the buyers and higher values of USD/JPY.
How high could the exchange rate climb?
In our opinion, if the pair extends gains from current levels, we could see even a test of the orange resistance zone in the following week(s).
Additionally, this pro-bullish scenario is also reinforced by the short-term picture of the exchange rate. Let’s take a closer look at the daily chart below.
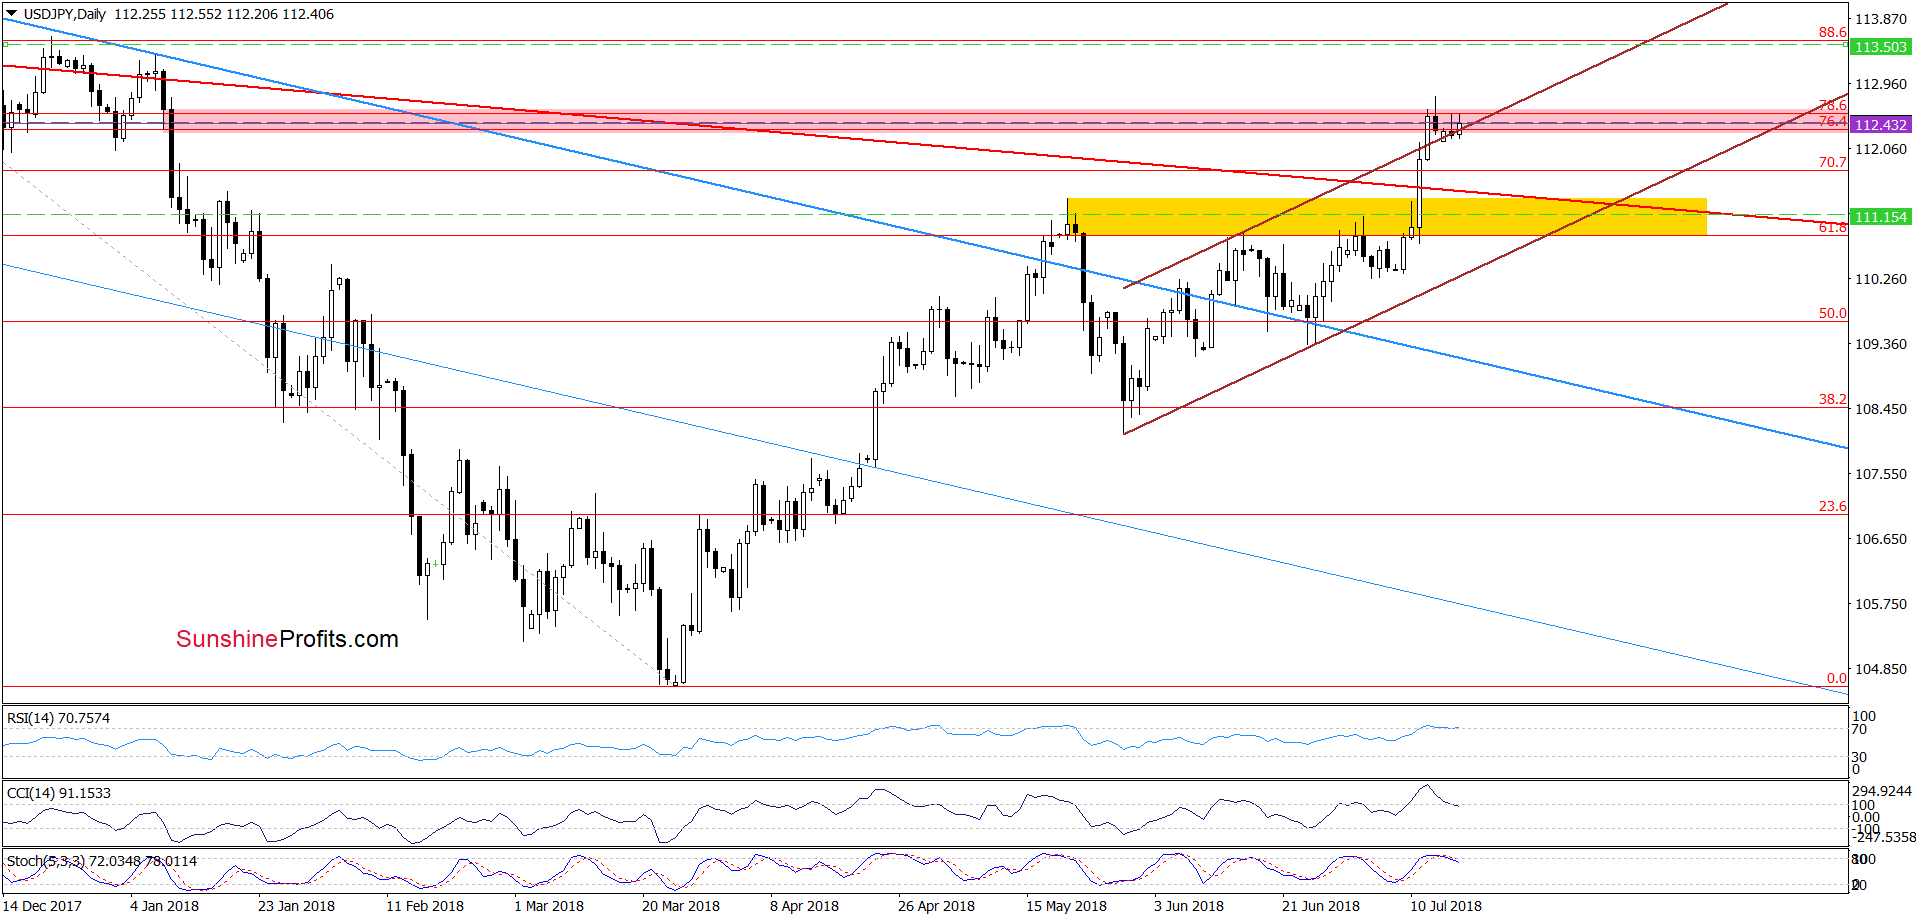
From this perspective, we see that although USD/JPY moved lower on Friday, invalidating the earlier breakout above the pink resistance zone, the previously-broken upper border of the brown rising trend channel withstood the selling pressure.
Yesterday, we noticed a daily closure inside the channel, but currency bulls quickly shook off this blow, triggering a rebound and invalidating Monday’s drop earlier today. Taking this fact into account and combining it with the medium-term picture, we believe that higher values of the exchange rate are just around the corner.
Nevertheless, if we see any reliable sign of currency bulls’ weakness, we’ll consider taking existing profits off the table.
Trading position (short-term; our opinion): Long positions with a stop-loss order at 111.15 and the initial upside target at 113.50 are justified from the risk/reward perspective. We will keep you informed should anything change, or should we see a confirmation/invalidation of the above.
USD/CAD
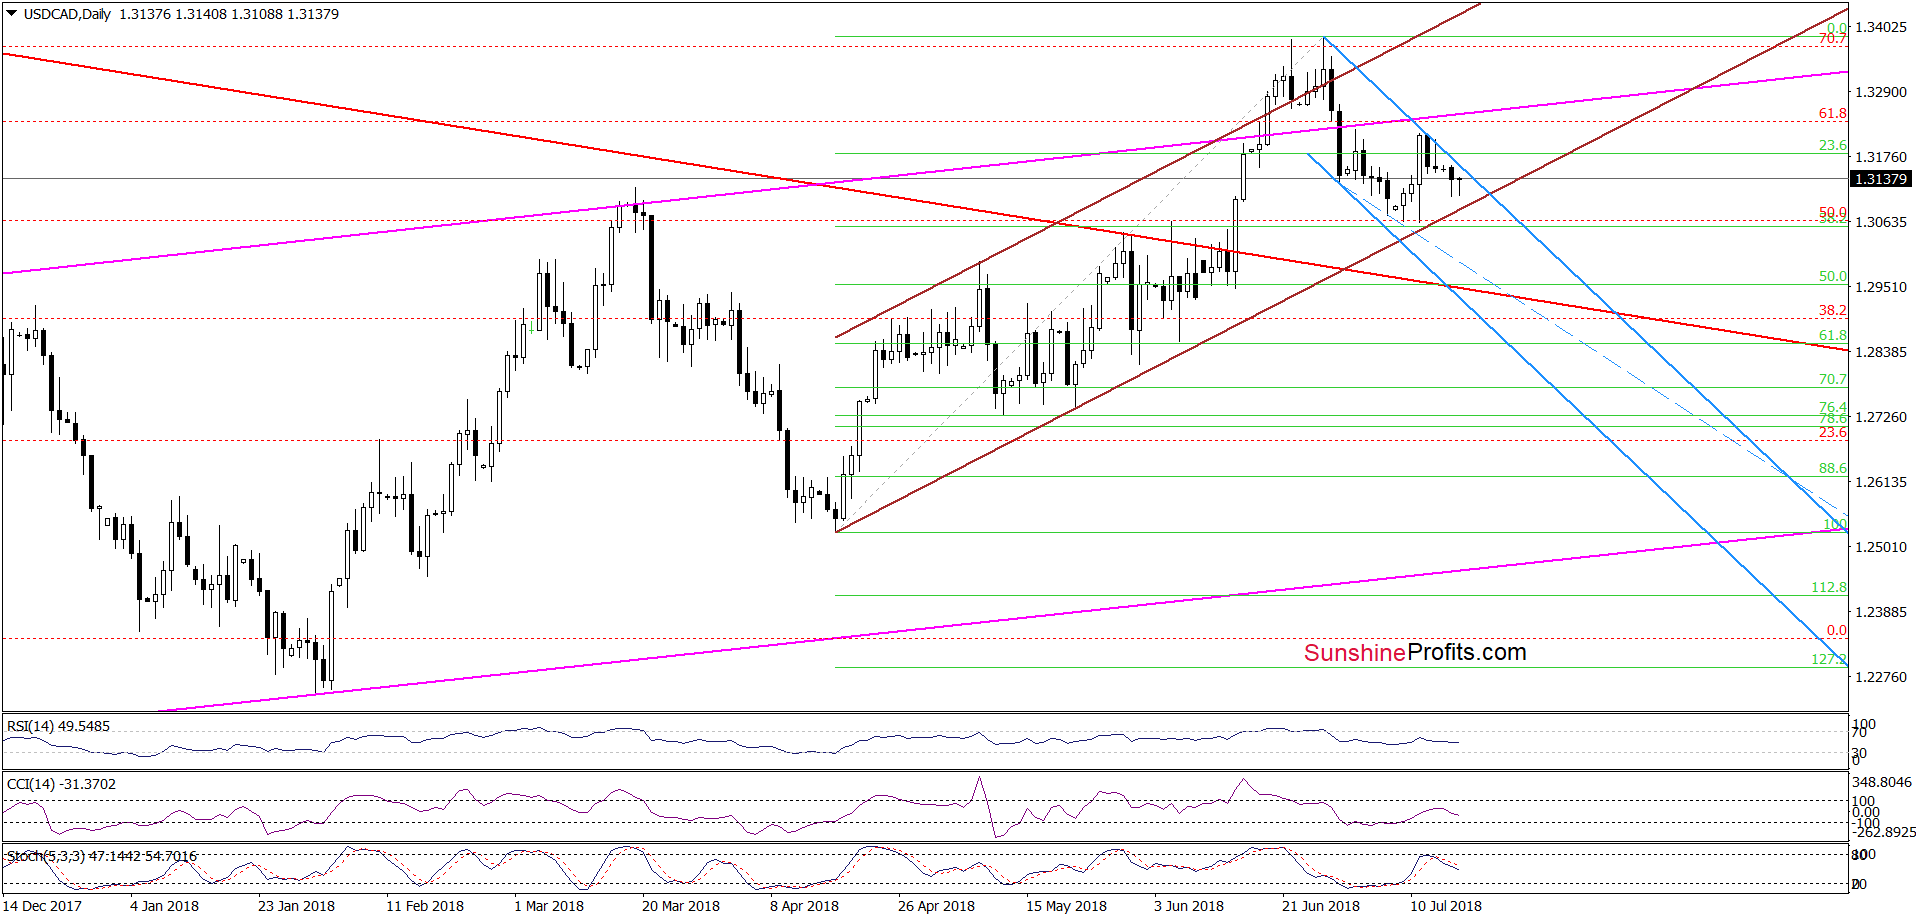
Looking at the daily chart, we see that the very short-term picture of USD/CAD is a bit unclear at the moment of writing this alert, because the exchange rate is trading inside three trend channels: the long-term pink rising trend channel, the brown rising trend channel and the blue declining trend channel.
Therefore, in our opinion, as long as there is no breakout above the upper line of the blue channel, we won’t see a test of the upper line of the pink channel (yes, it sounds a bit complicated).
On the other hand, as long as the pair is trading above the lower line of the brown trend channel, lower values of USD/CAD are not likely to be seen.
Taking all the above into account, we think that waiting at the sidelines for another profitable opportunity is the best investment decision at the moment of writing these words. As always, we’ll keep you - our subscribers - informed should anything change.
Trading position (short-term; our opinion): No positions are justified from the risk/reward perspective. We will keep you informed should anything change, or should we see a confirmation/invalidation of the above.
AUD/USD
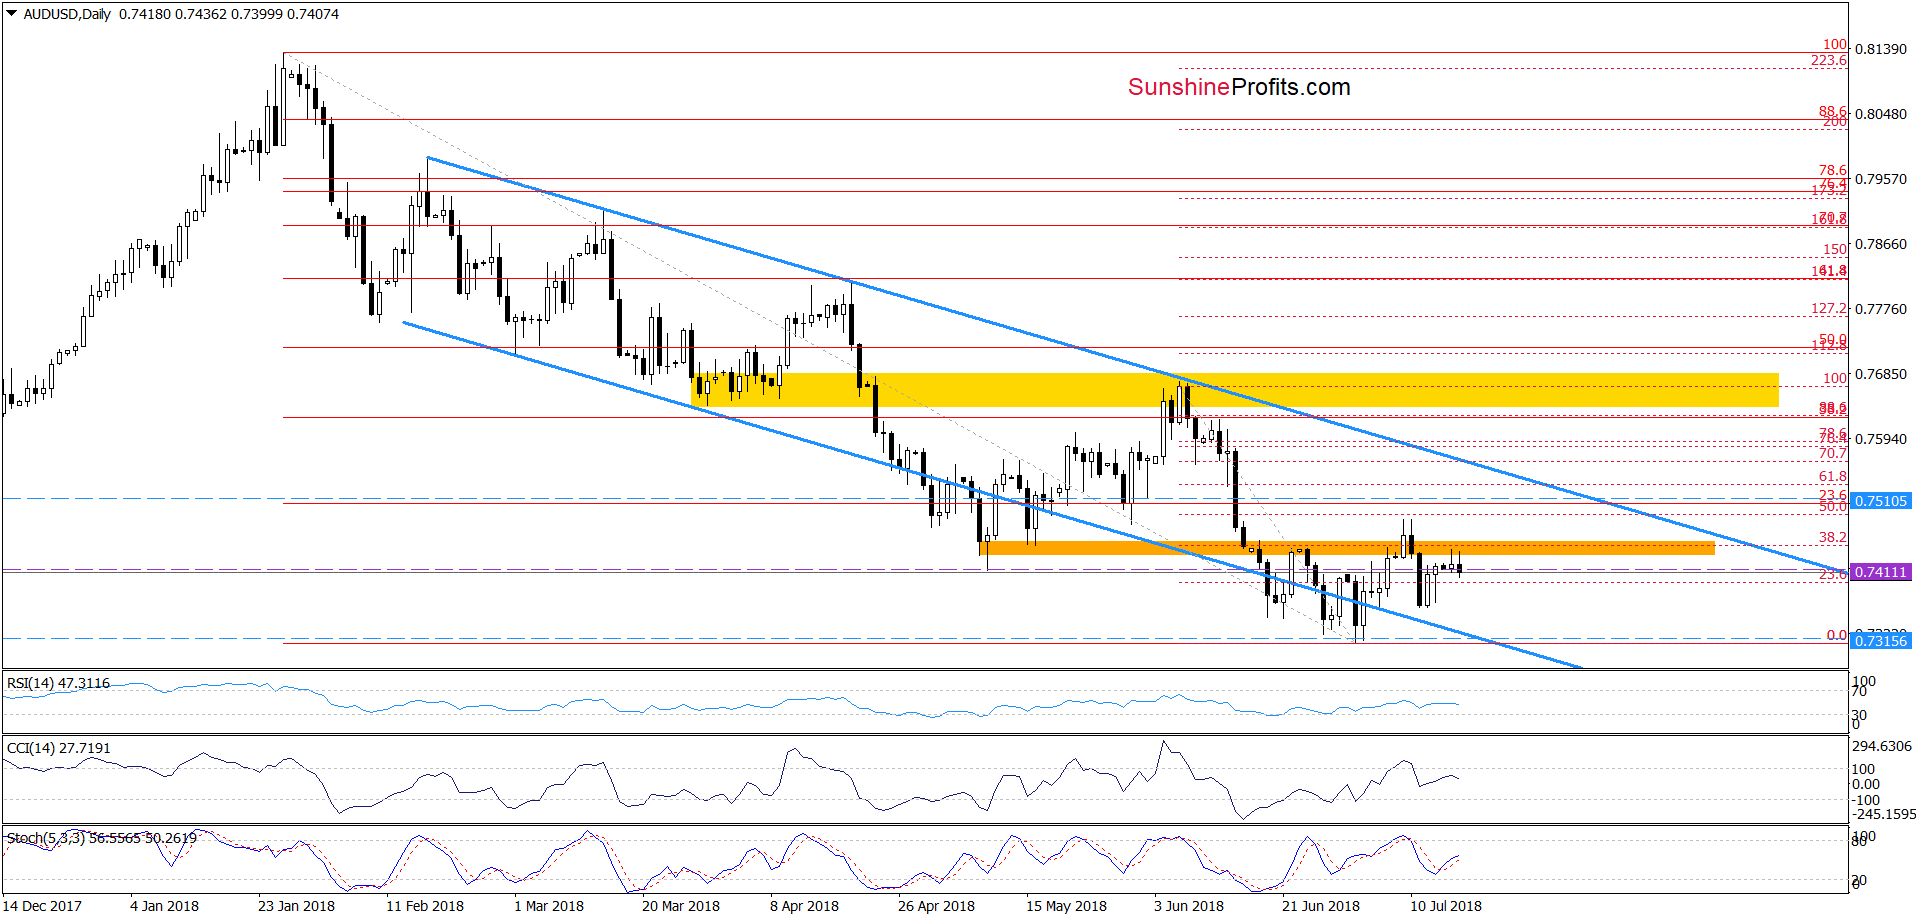
On Monday, AUD/USD extended its trip to the north, but despite this improvement, the orange resistance zone stopped the buyers. Earlier today, history repeated itself once again as currency bulls didn’t manage to push the pair higher.
This show of weakness encouraged their opponents to come back to the market, which triggered further deterioration in the following hours. Taking this fact into account, we think that lower values of the exchange rate are just around the corner.
If this is the case and the pair extends losses from here, we’ll likely see not only a test of the lower border of the blue declining trend channel, but also a decrease to last month’s lows in the coming days.
Trading position (short-term; our opinion): Short positions with a stop-loss order at 0.7510 and the initial downside target at 0.7315 are justified from the risk/reward perspective. We will keep you informed should anything change, or should we see a confirmation/invalidation of the above.
Thank you.
Nadia Simmons
Forex & Oil Trading Strategist
Przemyslaw Radomski, CFA
Founder, Editor-in-chief, Gold & Silver Fund Manager
Gold & Silver Trading Alerts
Forex Trading Alerts
Oil Investment Updates
Oil Trading Alerts

