

Earlier today EUR/USD and GBP/USD extended gains and reached their important resistance areas. Will currency bears use them to push the exchange rates lower?
In our opinion the following forex trading positions are justified - summary:
- EUR/USD: short (a stop-loss order at 1.2250; the initial downside target at 1.1510)
- GBP/USD: short (a stop-loss order at 1.3773; the initial downside target at 1.3000)
- USD/JPY: none
- USD/CAD: none
- USD/CHF: none
- AUD/USD: none
EUR/USD
Quoting our Monday alert:
(…) taking into account Friday drop to the green horizontal support line (based on the mid-August low) and the buy signals generated by the daily indicators, it seems that we may see a short-lived rebound (…) in the coming days.
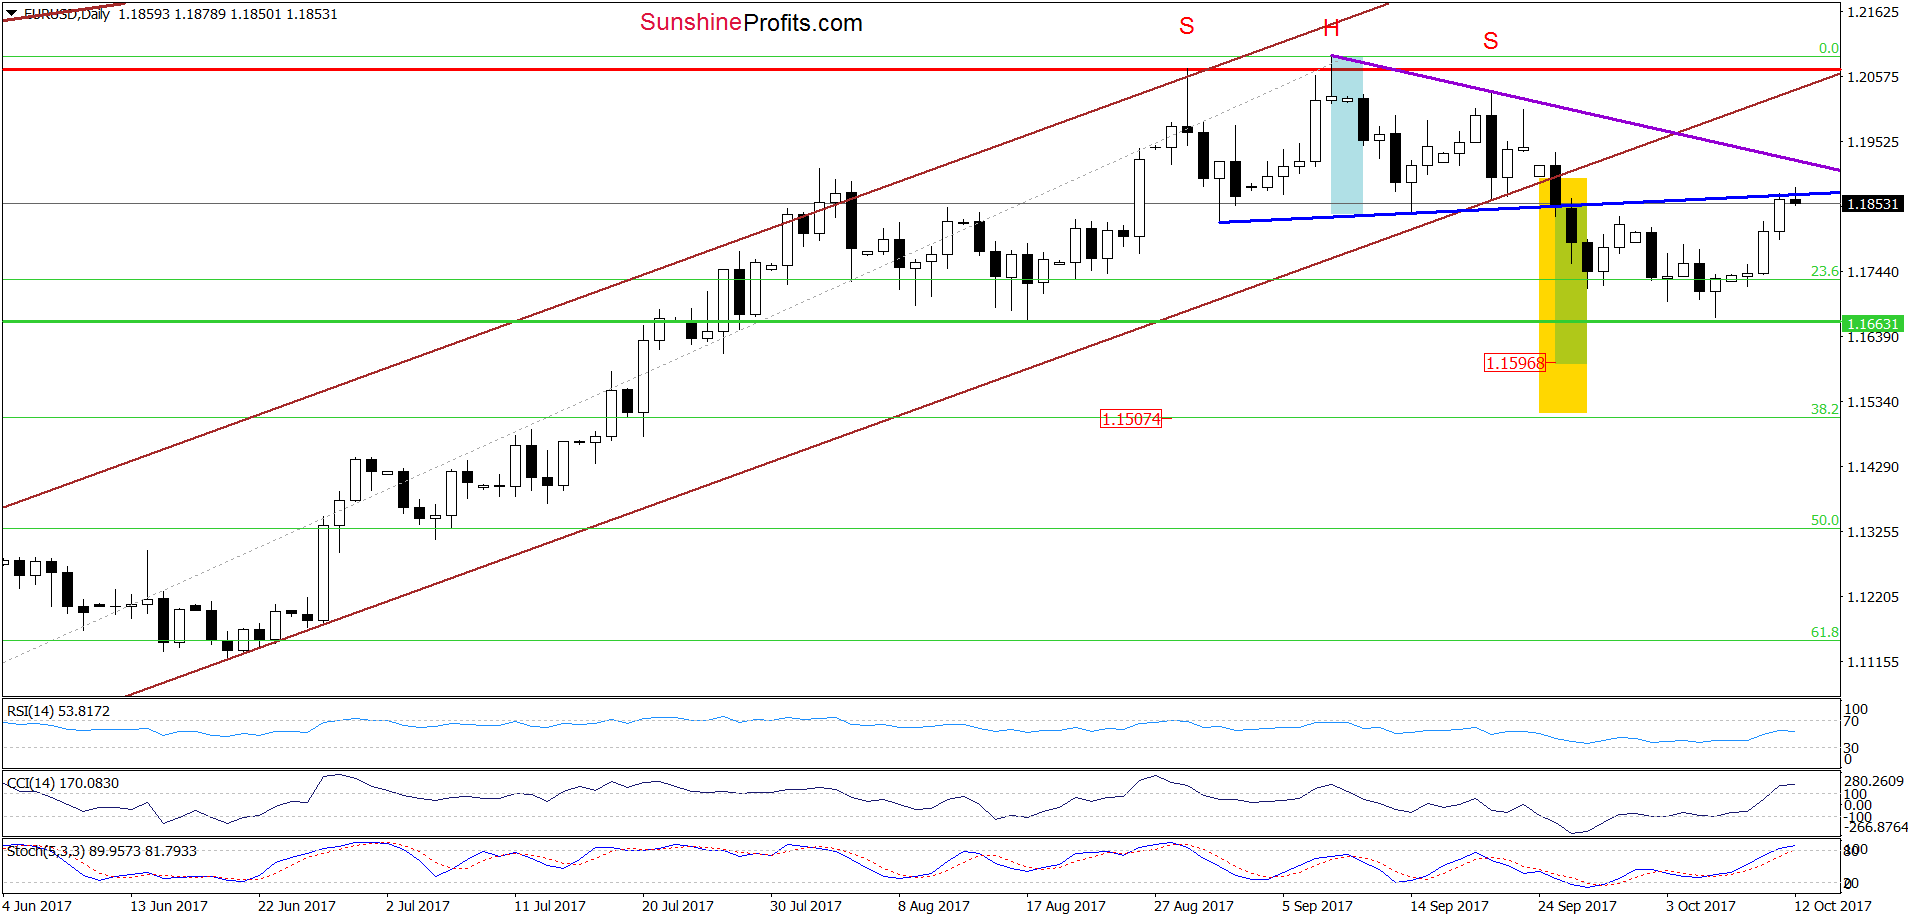
Will such price action change anything? In our opinion, it’s doubtful, because as long as the exchange rate remains under the neck line of the head and shoulders formation (the blue resistance line), this bearish pattern is underway, suggesting lower values of EUR/USD.
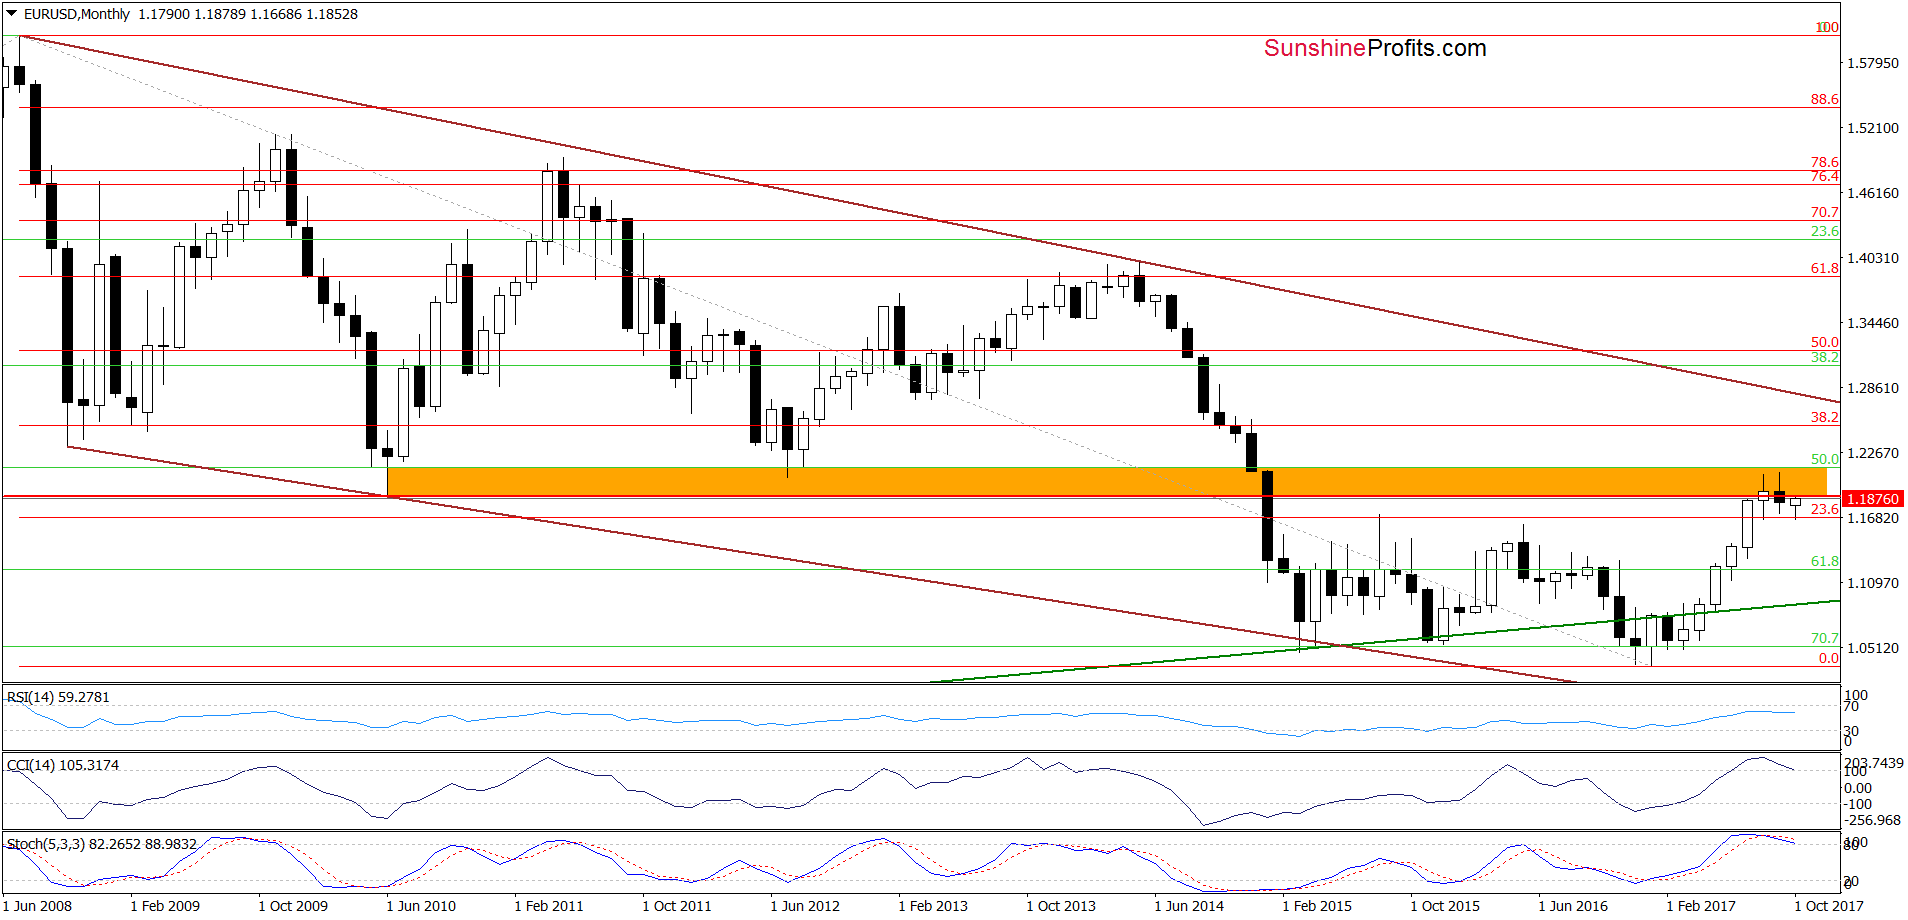
The pro bearish scenario is also reinforced by the (…) orange resistance zone, which together with the sell signals generated by the indicators suggests that lower values of EUR/USD are still ahead of us (…).
From today’s point of view, we see that the situation developed in line with the above scenario and EUR/USD extended gains, reaching the neck line of the head and shoulders formation and the lower border of the orange resistance zone seen on the monthly chart.
Taking this fact, the current position of the daily indicators (they are overbought and close to generating sell signals) and the sell signals generated by the long-term CCI and the Stochastic Oscillator, we think that the recent upward move was nothing more than a verification of the earlier breakdown below the above-mentioned resistance. If this is the case, EUR/USD will decline from current levels and re-test the green horizontal support line based on the mid-August low in the coming days.
Very short-term outlook: mixed with bearish bias
Short-term outlook: bearish
MT outlook: mixed
LT outlook: mixed
Trading position (short-term; our opinion): Short profitable positions (with a stop-loss order at 1.2250 and the initial downside target at 1.1510) are justified from the risk/reward perspective. We will keep you informed should anything change, or should we see a confirmation/invalidation of the above.
GBP/USD
On Tuesday, we wrote the following:
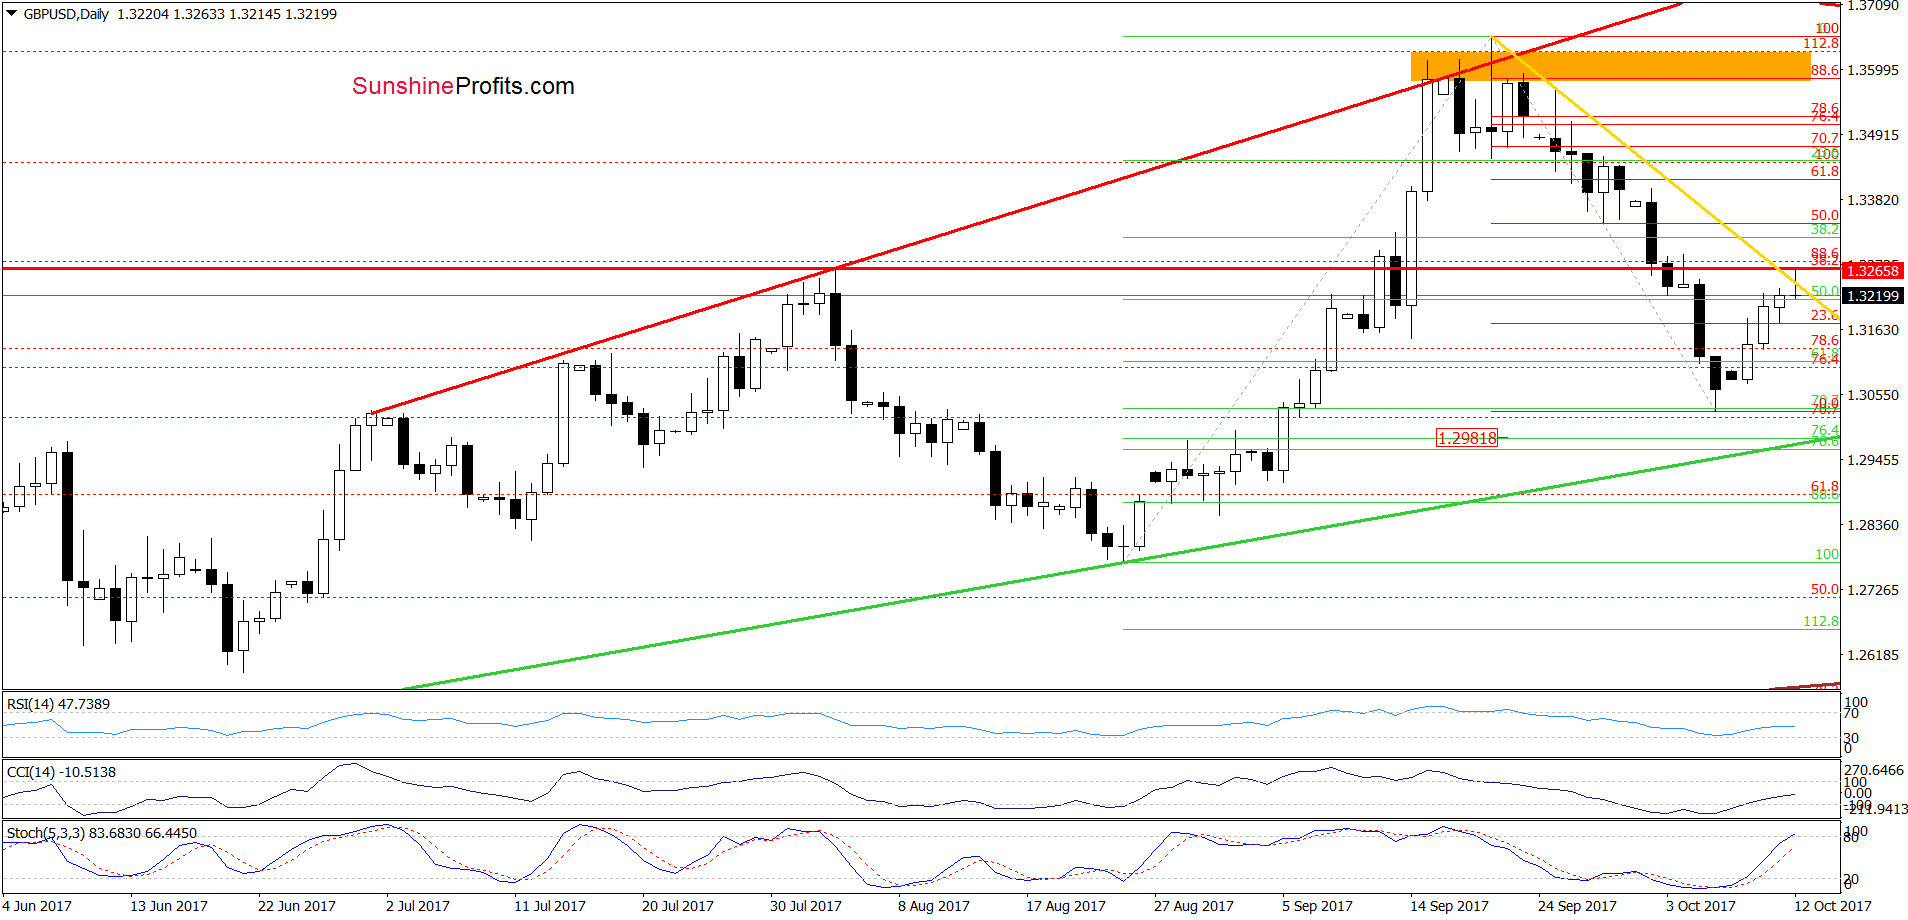
(…) the 70.7% Fibonacci retracement (…) encouraged currency bulls to act, which resulted in a rebound in recent days. (…) taking into account only the buy signals generated by the daily indicators (…), it seems that GBP/USD could extend gains and even verify the earlier breakdown under the August peak. At this point it is worth noting that in this area is also the 38.2% Fibonacci retracement (based on the entire recent downward move) and the yellow resistance line, which together will likely stop further improvement and trigger a decline to our next downside targets – the lower border of the brown rising trend channel marked on the daily chart and the support zone created by the 76.4% and 78.6% retracements (around 1.3000) in the following days.
Looking at the daily chart, we see that the situation developed in tune with our assumptions and GBP/USD moved lower after an increase to our resistance zone earlier today. Thanks to today’s downswing the exchange rate invalidated the earlier tiny breakout above the yellow resistance line, which suggests further deterioration in the coming day(s). If this is the case and the pair extends losses from here, we’ll realization of our bearish scenario from Tuesday in the following days.
Finishing today’s commentary on this currency pair, please keep in mind what we wrote about the situation in the long term:
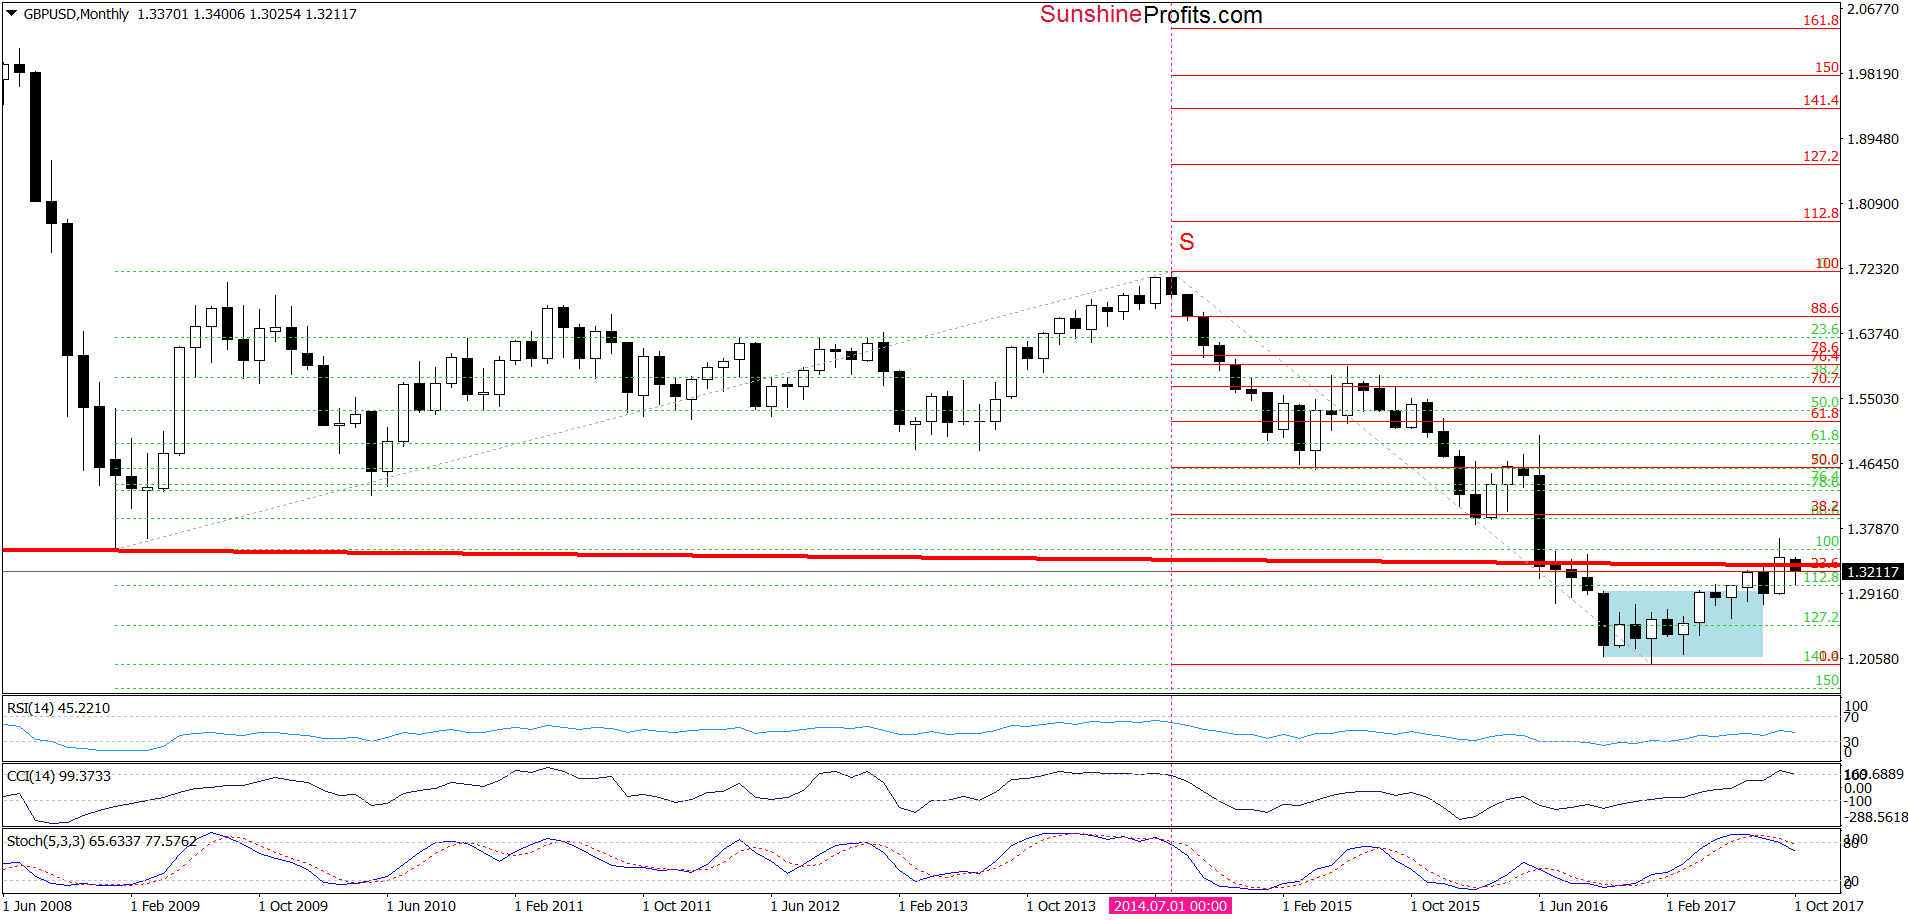
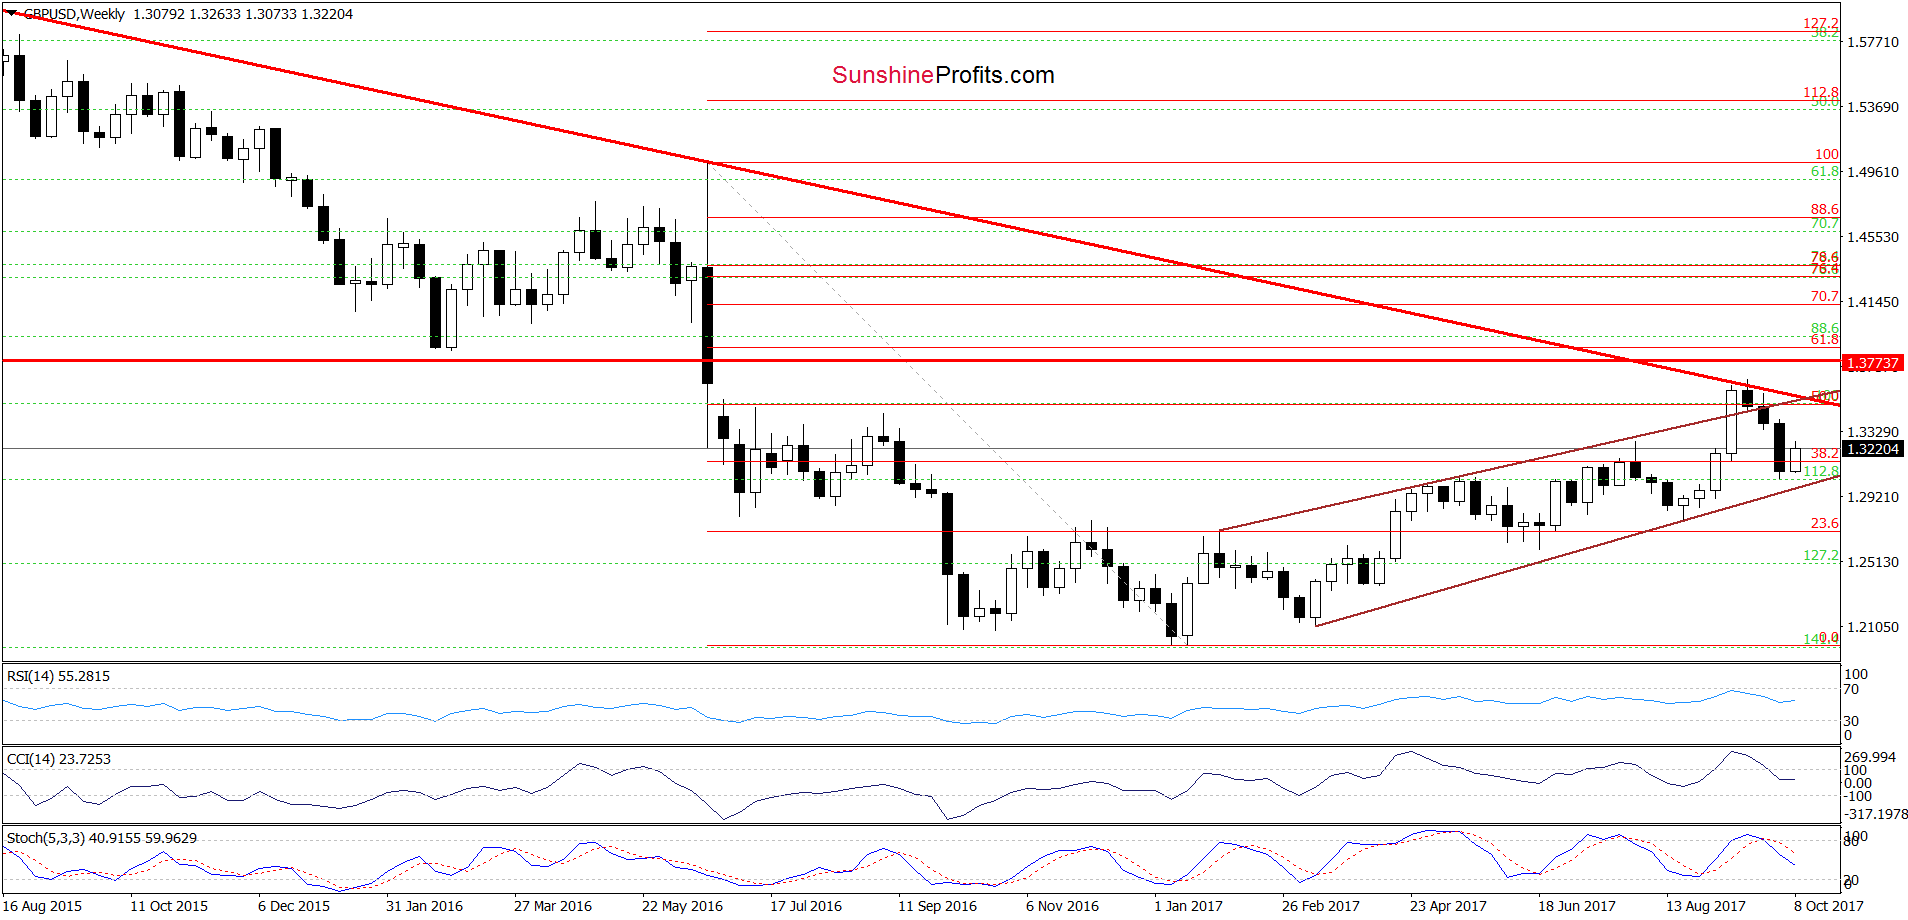
(…) this month’s decline took the exchange rate below the previously-broken red line (the neck line of the very long-term head and shoulders formation), which resulted in an invalidation of the earlier breakout.
Additionally, the Stochastic Oscillator generated the sell signal (while the CCI is very close to doing the same) for the first time since July 2014, which suggests further deterioration in the coming month(s). Why? When we take a closer look at the long-term chart, we see that similar readings of the indicators preceded a significant decline in the following months, which suggests that we’ll see a similar price action later in 2017. Therefore, short profitable positions continue to be justified from the risk/reward perspective.
Very short-term outlook: bearish
Short-term outlook: mixed with bearish bias
MT outlook: mixed with bearish bias
LT outlook: mixed
Trading position (short-term; our opinion): Short profitable positions (with a stop-loss order at 1.3773 and the next downside target at 1.3000) are justified from the risk/reward perspective. We will keep you informed should anything change, or should we see a confirmation/invalidation of the above.
AUD/USD
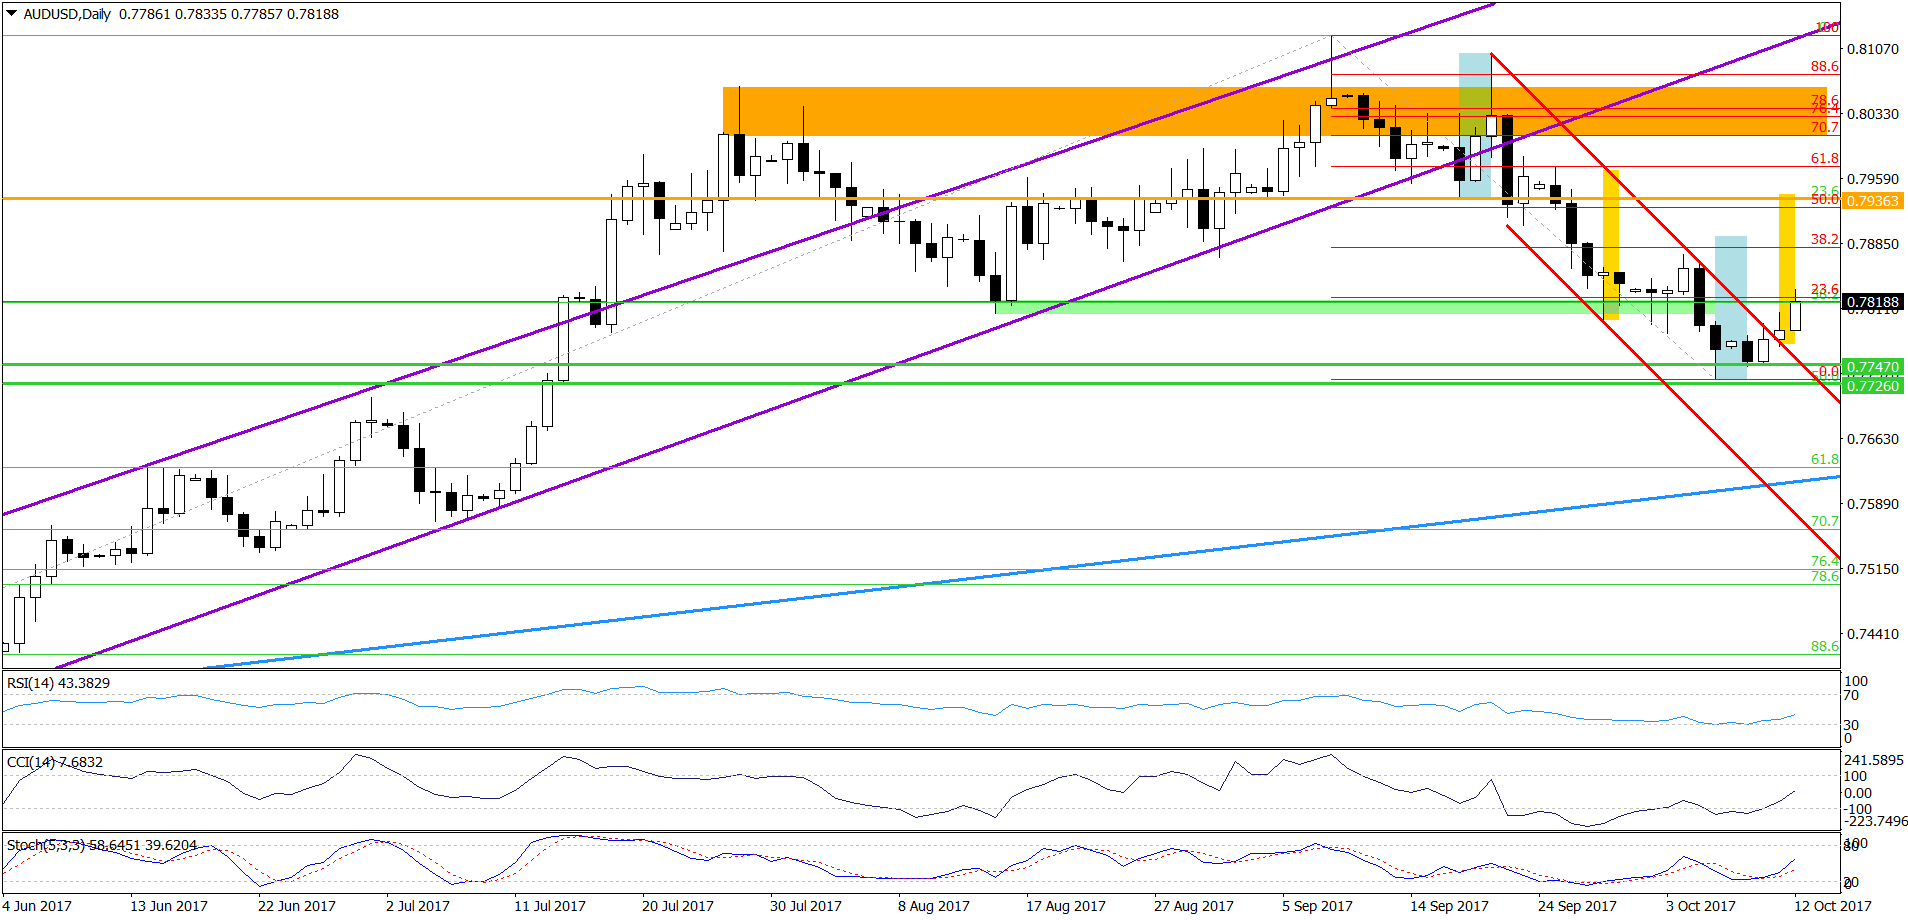
On the daily chart, we see that the combination of the green horizontal support lines and the 50% Fibonacci retracement stopped currency bears, triggering a rebound. Yesterday, AUD/USD climbed above the upper border of the red declining trend channel and closed the day above it, which resulted in further improvement earlier today. Additionally, indicators generated buy signals, supporting higher values of the exchange rate. How high AUD/USD could go? In our opinion, the initial upside target will be around 0.7879, where the 38.2% Fibonacci retracement is. If this resistance is broken, the next upside target will be around 0.79.27-0.7936, where the size of the upward move will correspond to the height of the red declining trend channel and where the 50% retracement is.
Very short-term outlook: mixed with bullish bias
Short-term outlook: mixed
MT outlook: mixed
LT outlook: mixed
Trading position (short-term; our opinion): No positions are justified from the risk/reward perspective. We will keep you informed should anything change, or should we see a confirmation/invalidation of the above.
Thank you.
Nadia Simmons
Forex & Oil Trading Strategist
Przemyslaw Radomski, CFA
Founder, Editor-in-chief, Gold & Silver Fund Manager
Gold & Silver Trading Alerts
Forex Trading Alerts
Oil Investment Updates
Oil Trading Alerts

