

At the beginning of the week, EUR/USD bounced of the support area, which managed to stop the sellers several times in the past. Earlier today, currency bulls extended recent gains and reached our first upside target, but the price action we saw raises some doubts about their strength. Is this the right assumption?
EUR/USD: none
GBP/USD: none
USD/JPY: long (a stop-loss order at 110.21; the initial upside target at 113.50)
USD/CAD: none
USD/CHF: none
AUD/USD: short (a stop-loss order at 0.7510; the initial downside target at 0.7315)
EUR/USD
Yesterday, we wrote the following:
(…) What’s next for the exchange rate?
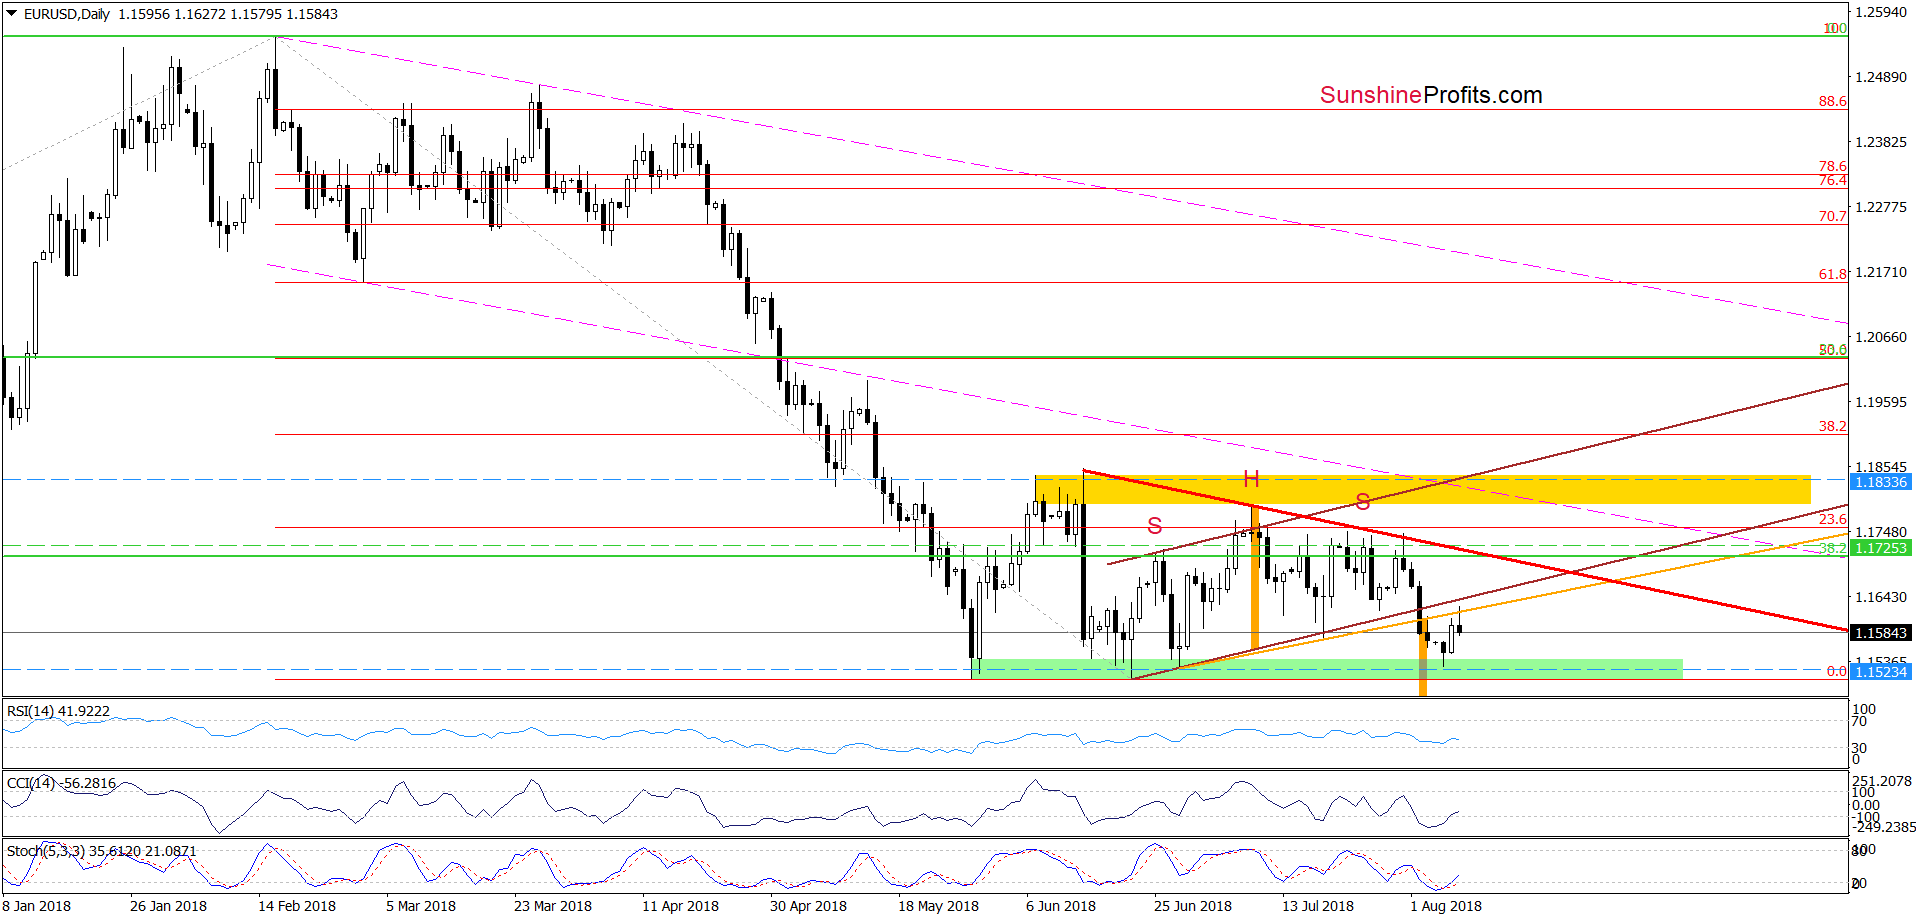
Taking into account the current position of the daily indicators (the Stochastic Oscillator generated a sell signal, while the CCI is very close to doing the same), we think that the pair will test the previously-broken orange line based on the late June and mid-July lows (the neck line of the head and shoulders formation) in the very near future.
Looking at the daily chart, we see that the situation developed in line with the above scenario and EUR/USD reached our first upside target earlier today. Despite this improvement, the orange resistance line stopped the buyers triggering a pullback in the following hours.
On one hand, such price action looks like a verification of the earlier breakdown under this line (a negative sign, which could result in a comeback to the south). However, on the other hand, the buy signals generated by the indicators suggest higher values of the exchange rate in the very near future.
What does it mean for us? In our opinion, no less or more than the fact that waiting outside the market for another profitable opportunity is justified from the risk/reward perspectiveat the moment.
What can be a pro-growth scenario?
If we see the bulls’ strength and an invalidation of the earlier breakdown (under the orange line and the lower border of the brown rising trend channel), EUR/USD can climb even to the red declining resistance line based on the previous peaks (currently around 1.1725) in the following days.
At this point, please note that if the situation develops in tune with the above assumptions, we’ll consider opening long positions (of course, if the other technical factors also speak for the pro-growth scenario).
Nevertheless, if currency bulls do not take advantage of buy signals generated by the indicators and show weakness in this area, we’ll consider re-opening short positions.
Trading position (short-term; our opinion): No positions are justified from the risk/reward perspective. We will keep you informed should anything change, or should we see a confirmation/invalidation of the above.
GBP/USD
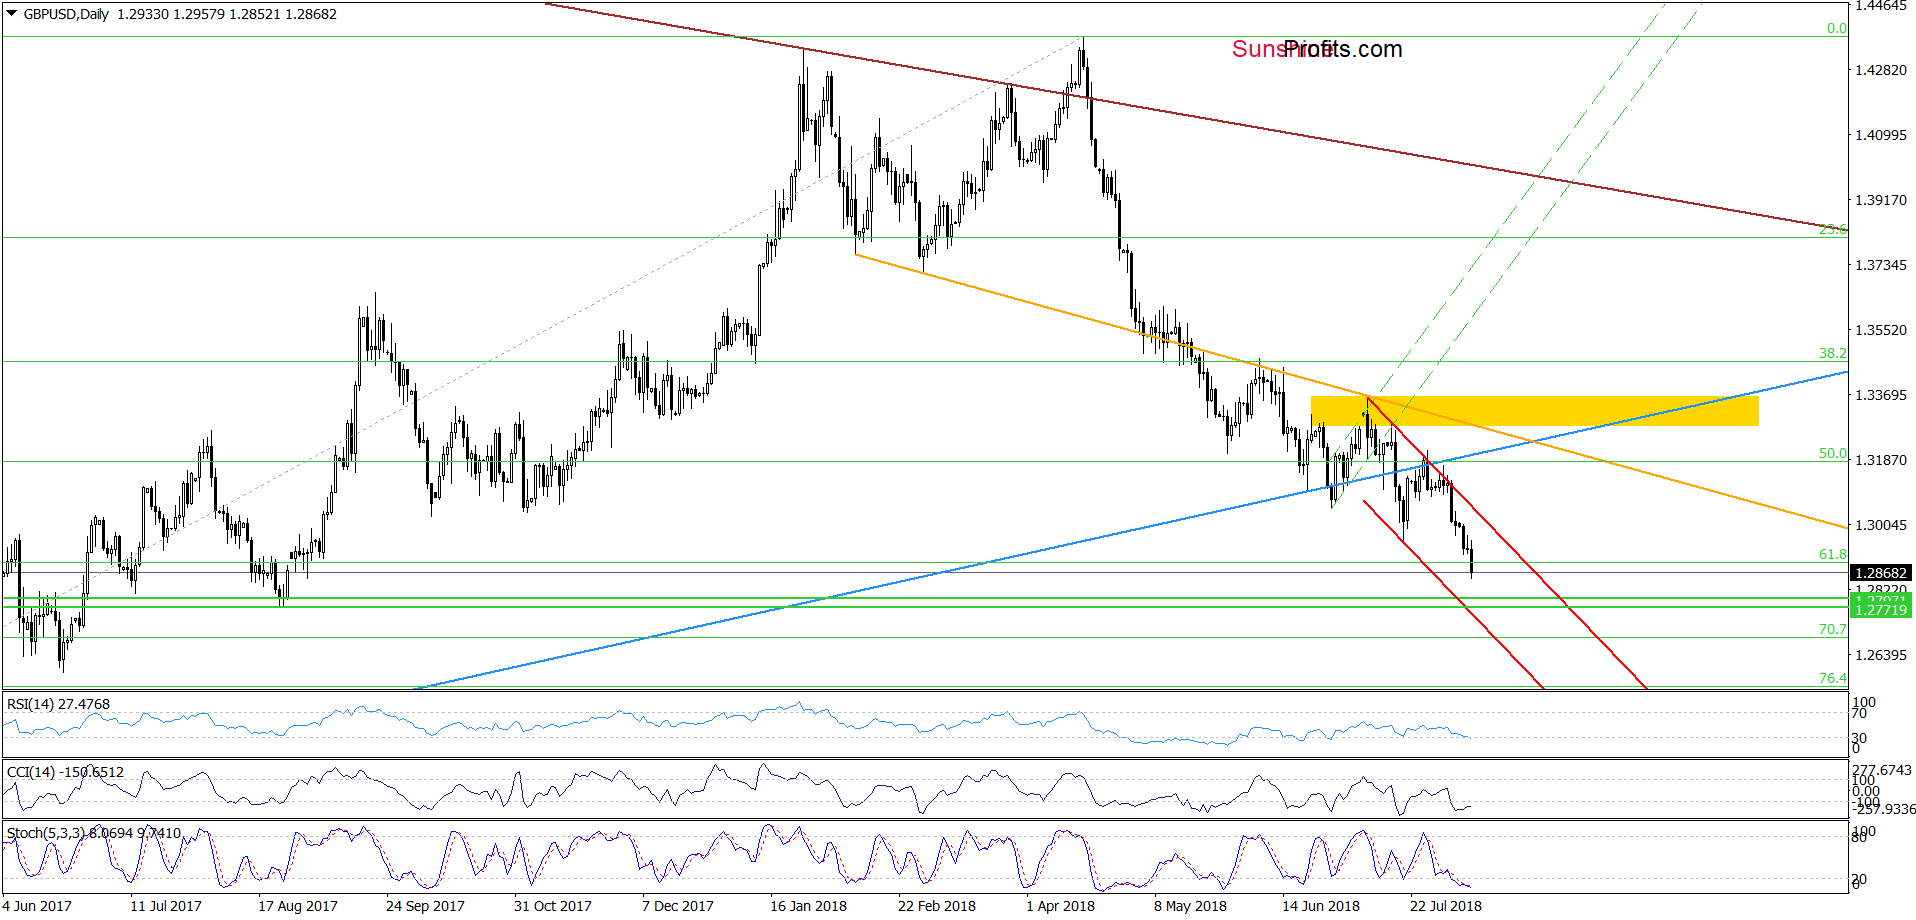
From today’s point of view, we see that currency bears managed to break under the 61.8% Fibonacci retracement, which opened the way to lower levels.
But is it as easy as it might seem at first glance?
In our opinion, it is not, because even if the pair extends losses from current levels the space for declines seems limited. Why? Because not far from here, you can see two green horizontal support lines based on late August 2017 lows.
Slightly below them is also the lower border of the very short-term red declining trend channel, which could encourage currency bulls o act in the very near future – especially when we factor in the current position of the daily indicators.
Taking all the above into account, we think that waiting at the sidelines for a confirmation/invalidation of the above is the best decision at the moment.
Trading position (short-term; our opinion): No positions are justified from the risk/reward perspective. We will keep you informed should anything change, or should we see a confirmation/invalidation of the above.
AUD/USD
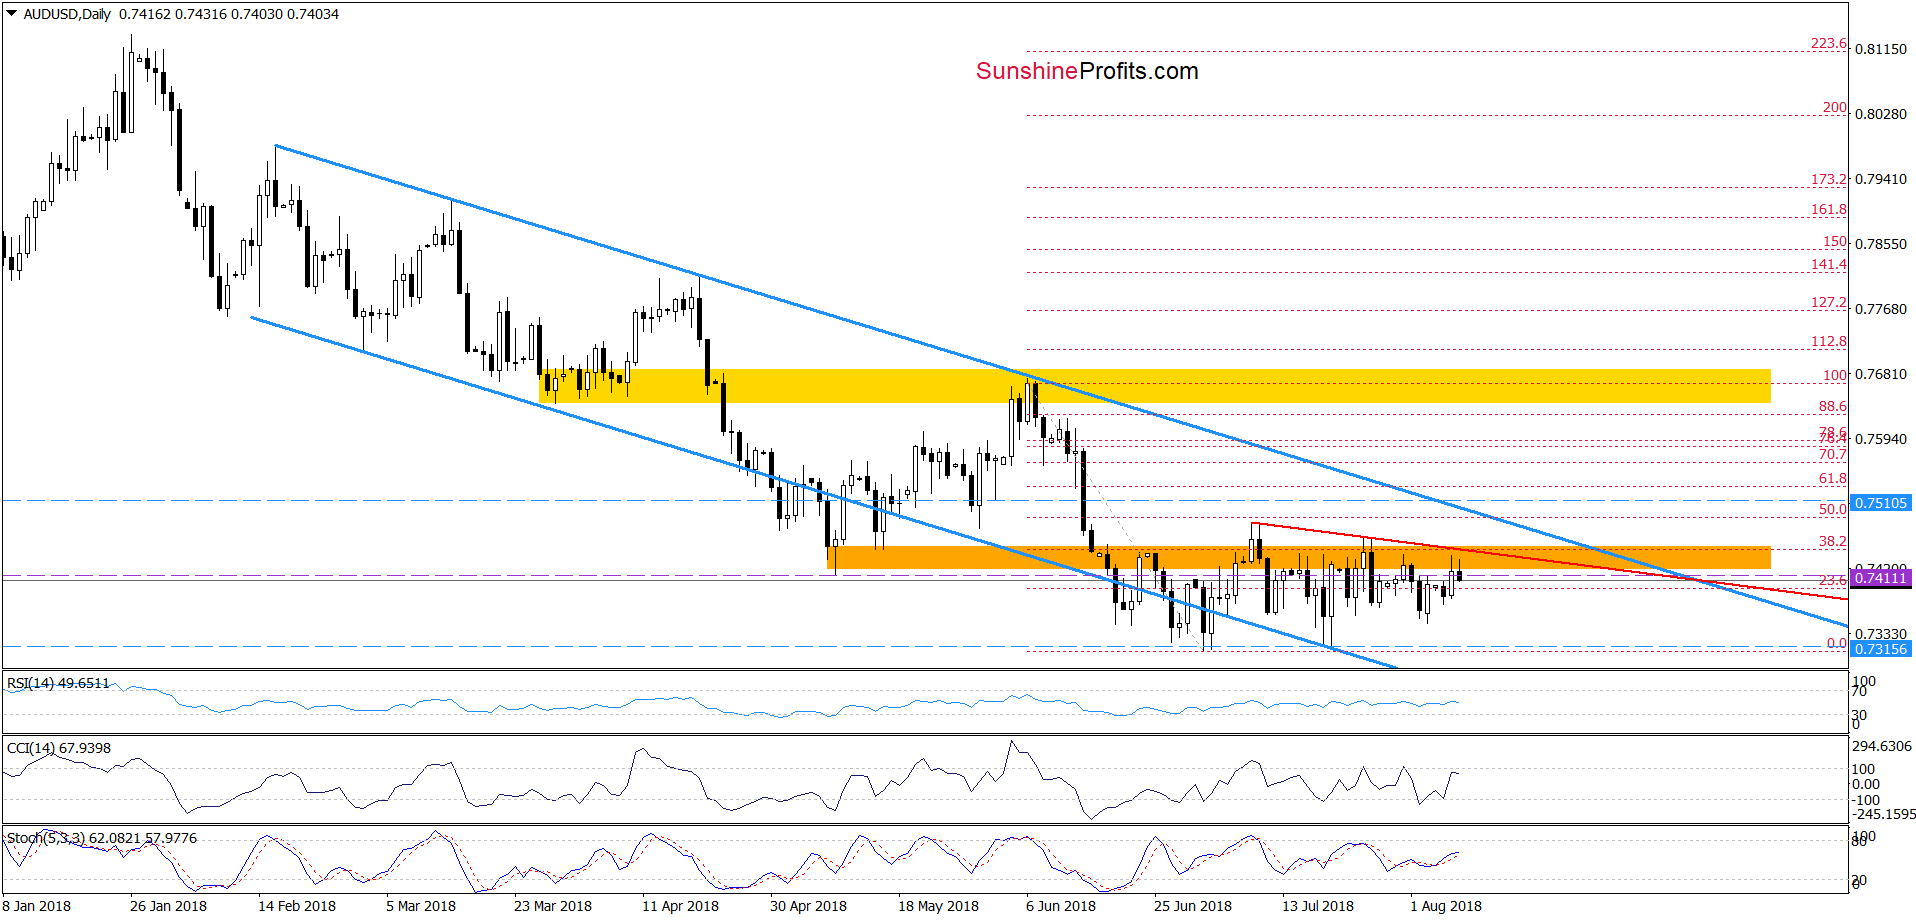
As you see on the daily chart, the overall situation in the short term hasn’t changed much as AUD/USD is still trading under the orange resistance zone and slightly below the purple dashed horizontal line (AUD/USD was trading at around this level when we decided to open short positions).
Therefore, we believe that as long as the above-mentioned strong resistance zone continues to keep gains in check (for almost a month), higher values of AUD/USD are not likely to be seen and further deterioration is just around the corner.
How low could the pair go if currency bears extend losses in the coming week?
In our opinion, if AUD/USD moves lower once again, the exchange rate will (at least) decline to our downside target, which is currently slightly above July lows.
Trading position (short-term; our opinion): short positions with a stop-loss order at 0.7510 and the initial downside target at 0.7315 are justified from the risk/reward perspective. We will keep you informed should anything change, or should we see a confirmation/invalidation of the above.
Thank you.
Nadia Simmons
Forex & Oil Trading Strategist
Przemyslaw Radomski, CFA
Founder, Editor-in-chief, Gold & Silver Fund Manager
Gold & Silver Trading Alerts
Forex Trading Alerts
Oil Investment Updates
Oil Trading Alerts

