

Wednesday's session caused a big headache among fans of higher values of AUD/USD. What happened? Australian dollar fell against its U.S. counterpart to the lowest level since 2016. Is the road to the south still wide open and further declines are waiting for us in the coming days?
- EUR/USD: short (a stop-loss order at 1.1746; the initial downside target at 1.1343)
- GBP/USD: none
- USD/JPY: none
- USD/CAD: long (a stop-loss order at 1.3018; the initial upside target at 1.3333)
- USD/CHF: none
- AUD/USD: none
EUR/USD
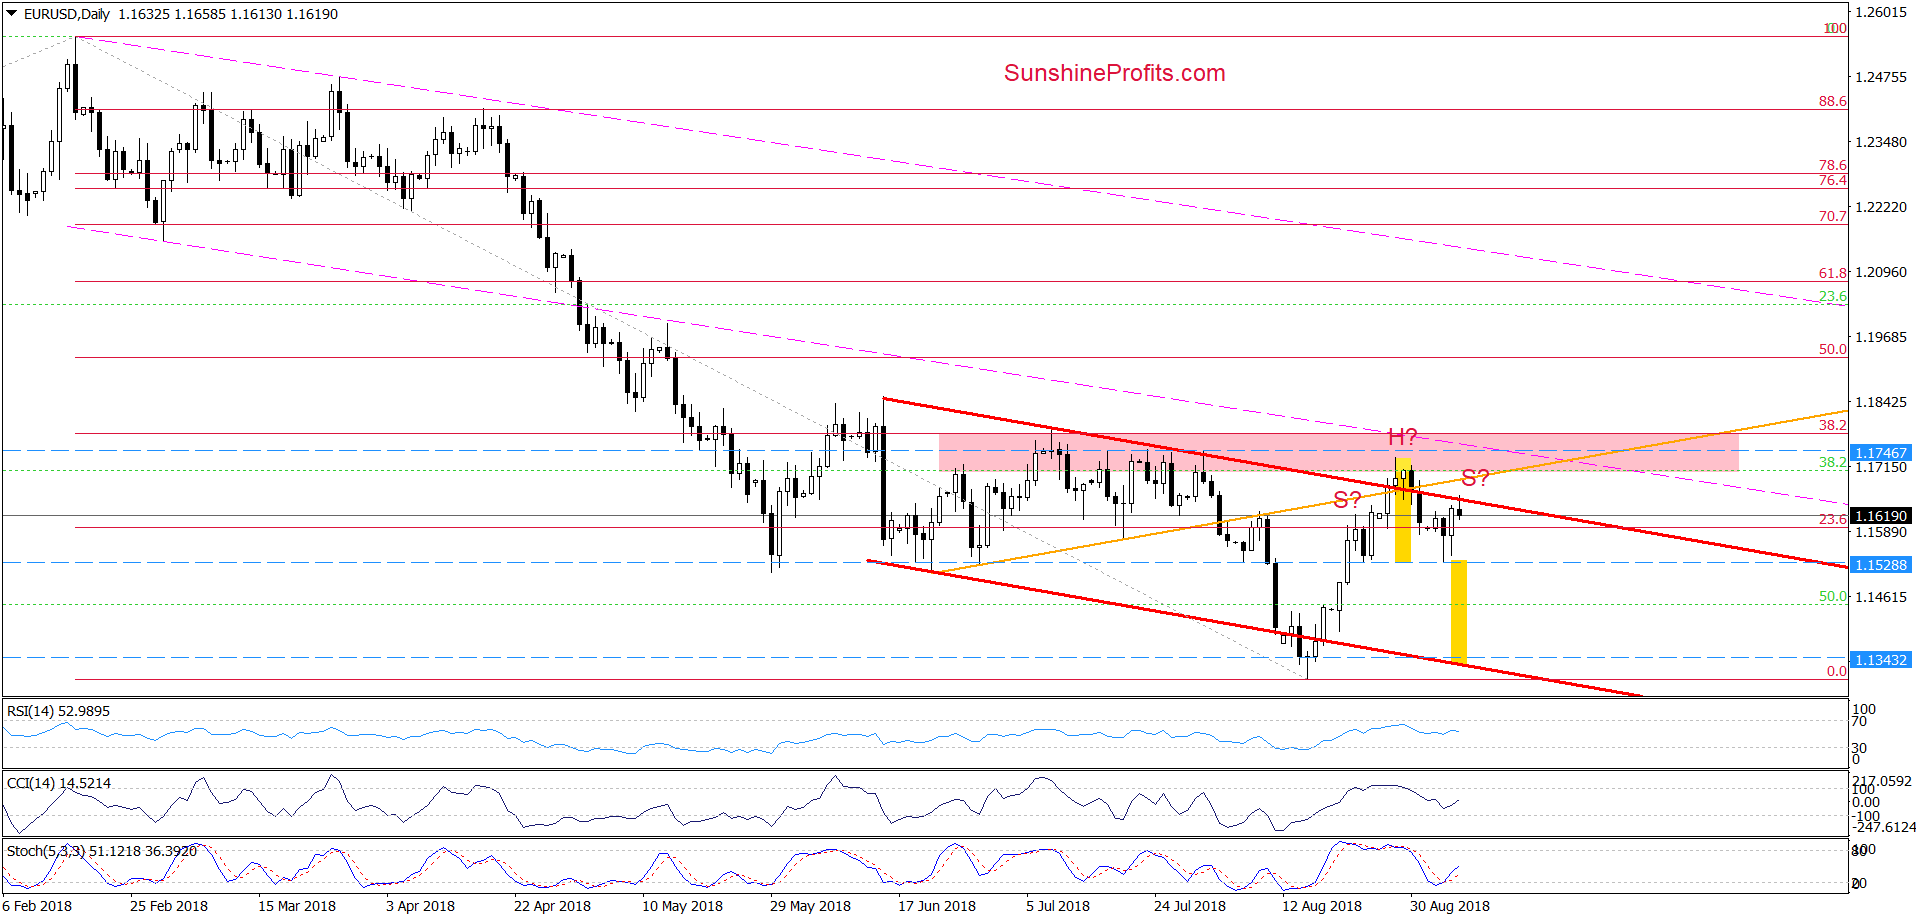
Looking at the daily chart, we see that currency bulls extended the recent rebound and took EUR/USD to the previously-broken upper border of the red declining trend channel earlier today.
Despite this improvement, they didn’t manage to hold gained levels, which resulted in a pullback in the following hours. As a result, the pair invalidated the earlier tiny breakout, which suggests that currency bears will likely create the right shoulder of the potential head and shoulders top formation in the coming days. If this is the case, EUR/USD will come back to the neck line of the pattern in the very near future.
What could happen if we see a breakdown under this support (marked with the blue dashed horizontal line)? In our opinion, the exchange rate will drop not only to our initial downside target, but also test the recent lows (in terms of daily closures) and the lower line of the red declining trend channel.
Focus on the Greenback
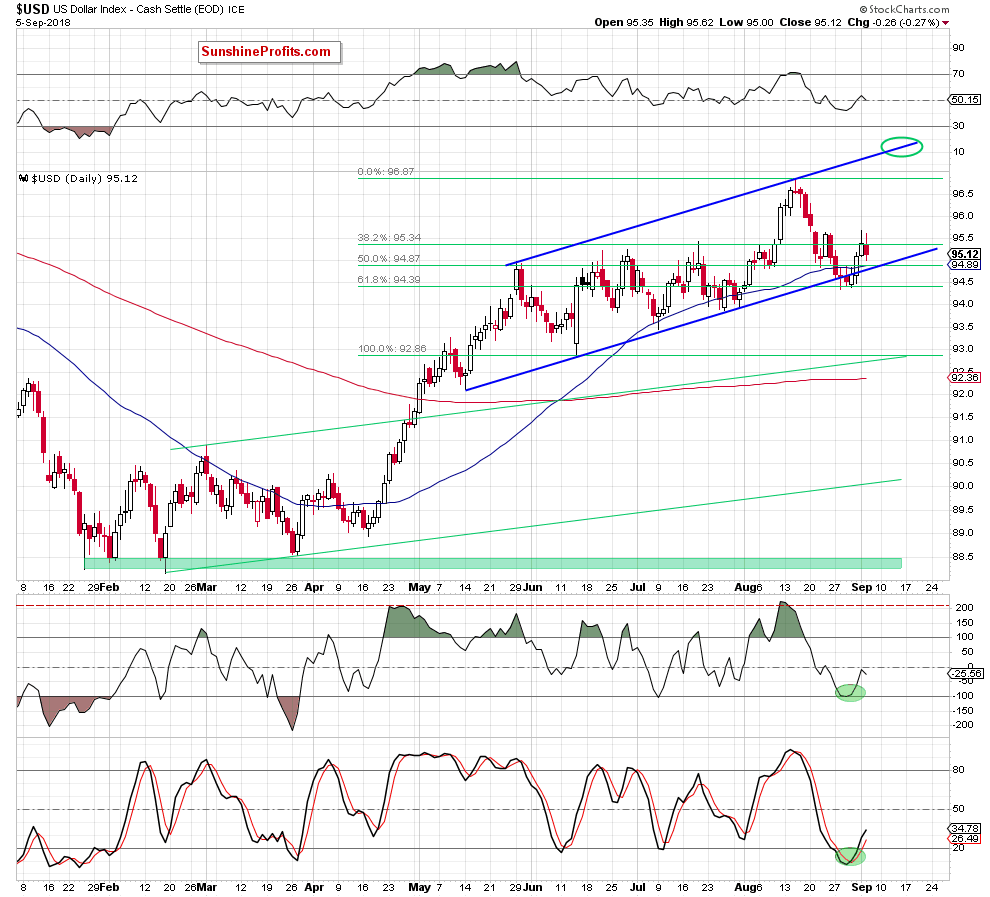
From today’s point of view, we see that the overall situation in the very short term hasn’t changed much as the USD Index closed Wednesday’s session above the previously-broken 61.8% Fibonacci retracement, the lower border of the blue rising trend channel and the 50-day moving average.
Therefore, what we wrote in our last commentary remains up-to-date also today:
(…) the buy signals generated by the CCI and the Stochastic Oscillator continue to support the bulls, increasing the probability of another bigger move to the upside.
If this is the case and the index extends its trip to the north, we’ll likely see not only a breakout above yesterday’s high, but also an increase to the recent highs (around 96.90) or even the upper border of the blue rising tend channel in the following week(s).
Trading position (short-term; our opinion): Short positions with a stop-loss order at 1.1746 and the initial downside target at 1.1343 are justified from the risk/reward perspective. We will keep you informed should anything change, or should we see a confirmation/invalidation of the above.
GBP/USD
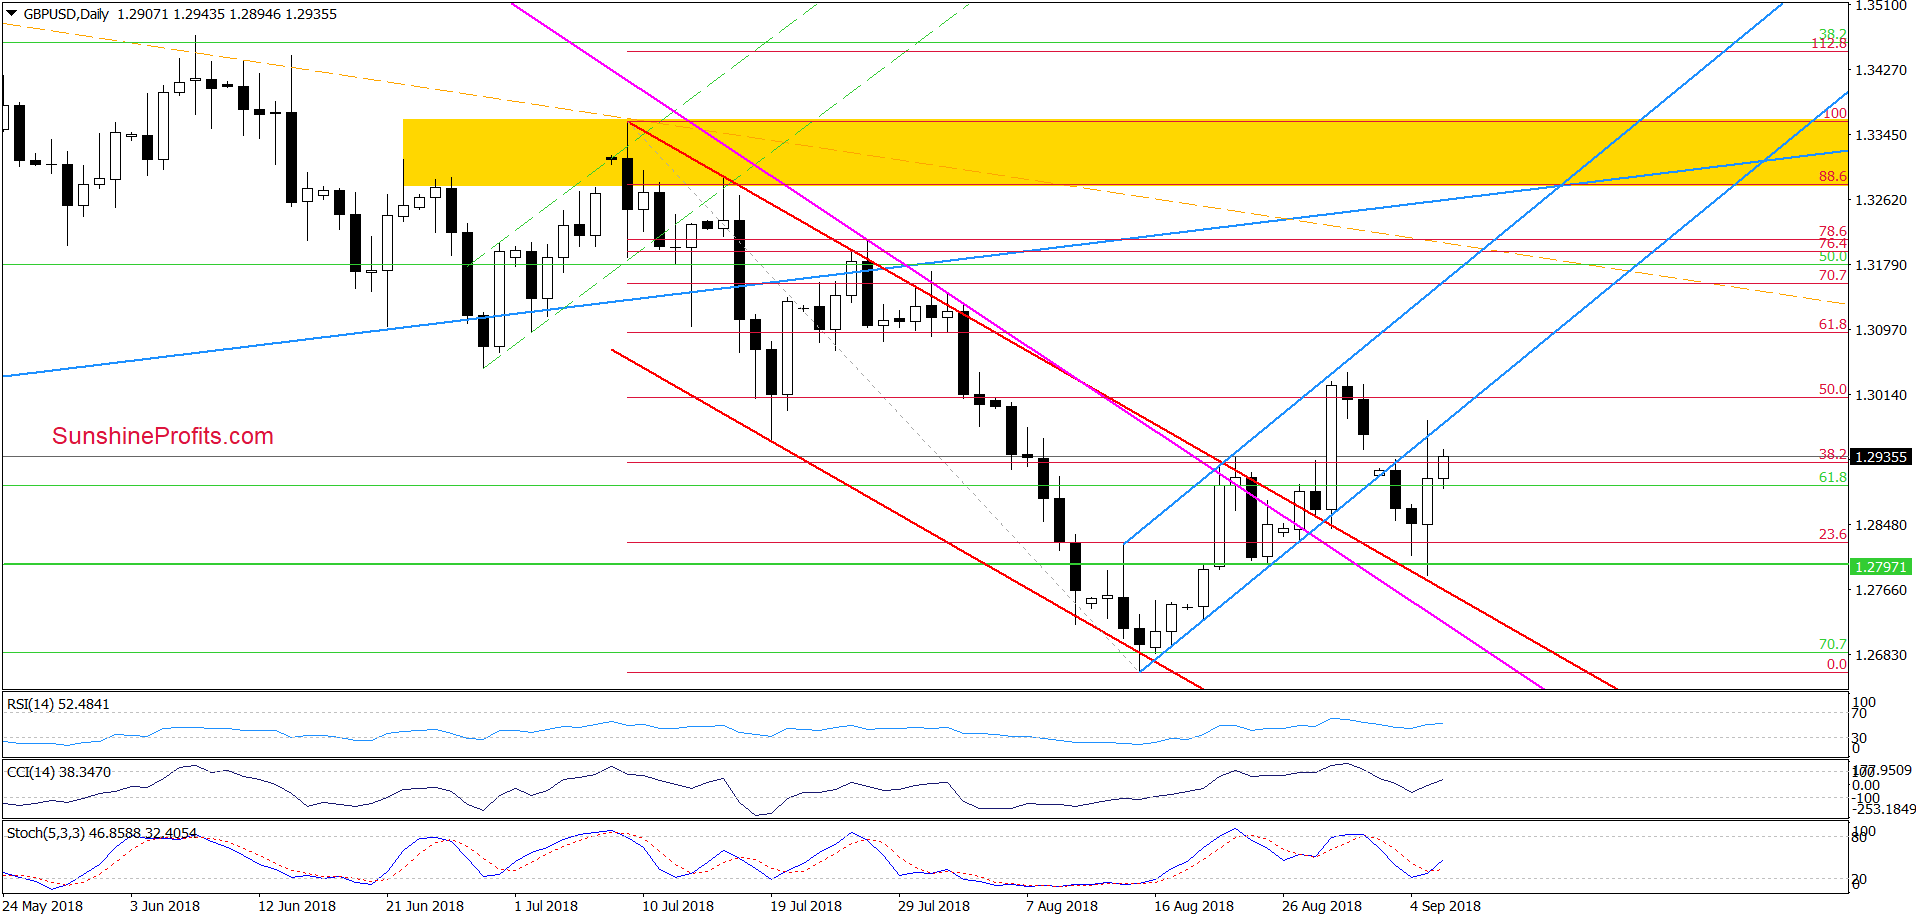
On Tuesday, we wrote:
(…) the next (and the nearest) target for the bears will be the previously-broken upper line of the red declining trend channel and then the pink declining support lines. (…)
As you see on the daily chart, currency bears took GBP/USD lower and tested our first downside target yesterday. Despite this move, the upper line of the red declining trend channel encouraged the buyers to act, which resulted in a quite sharp rebound.
Thanks to this upswing, the exchange rate climbed to the previously-broken lower line of the blue rising trend channel, which looks like a verification of the earlier breakdown (at least at the first glance).
Nevertheless, earlier today, currency bulls triggered one more upswing, which increases the likelihood that we’ll see one more test of this nearest resistance in the very near future (maybe even later in the day).
But when can we expect a sizable move to the north?
In our opinion, such price action will be more likely and reliable only if GBP/USD invalidates the earlier breakdown under the lower line of the blue trend channel and climbs above the late-August highs. Therefore, we think that waiting at the sidelines for a confirmation/invalidation of the above is justified from the risk/reward perspective.
Trading position (short-term; our opinion): No positions are justified from the risk/reward perspective.
AUD/USD
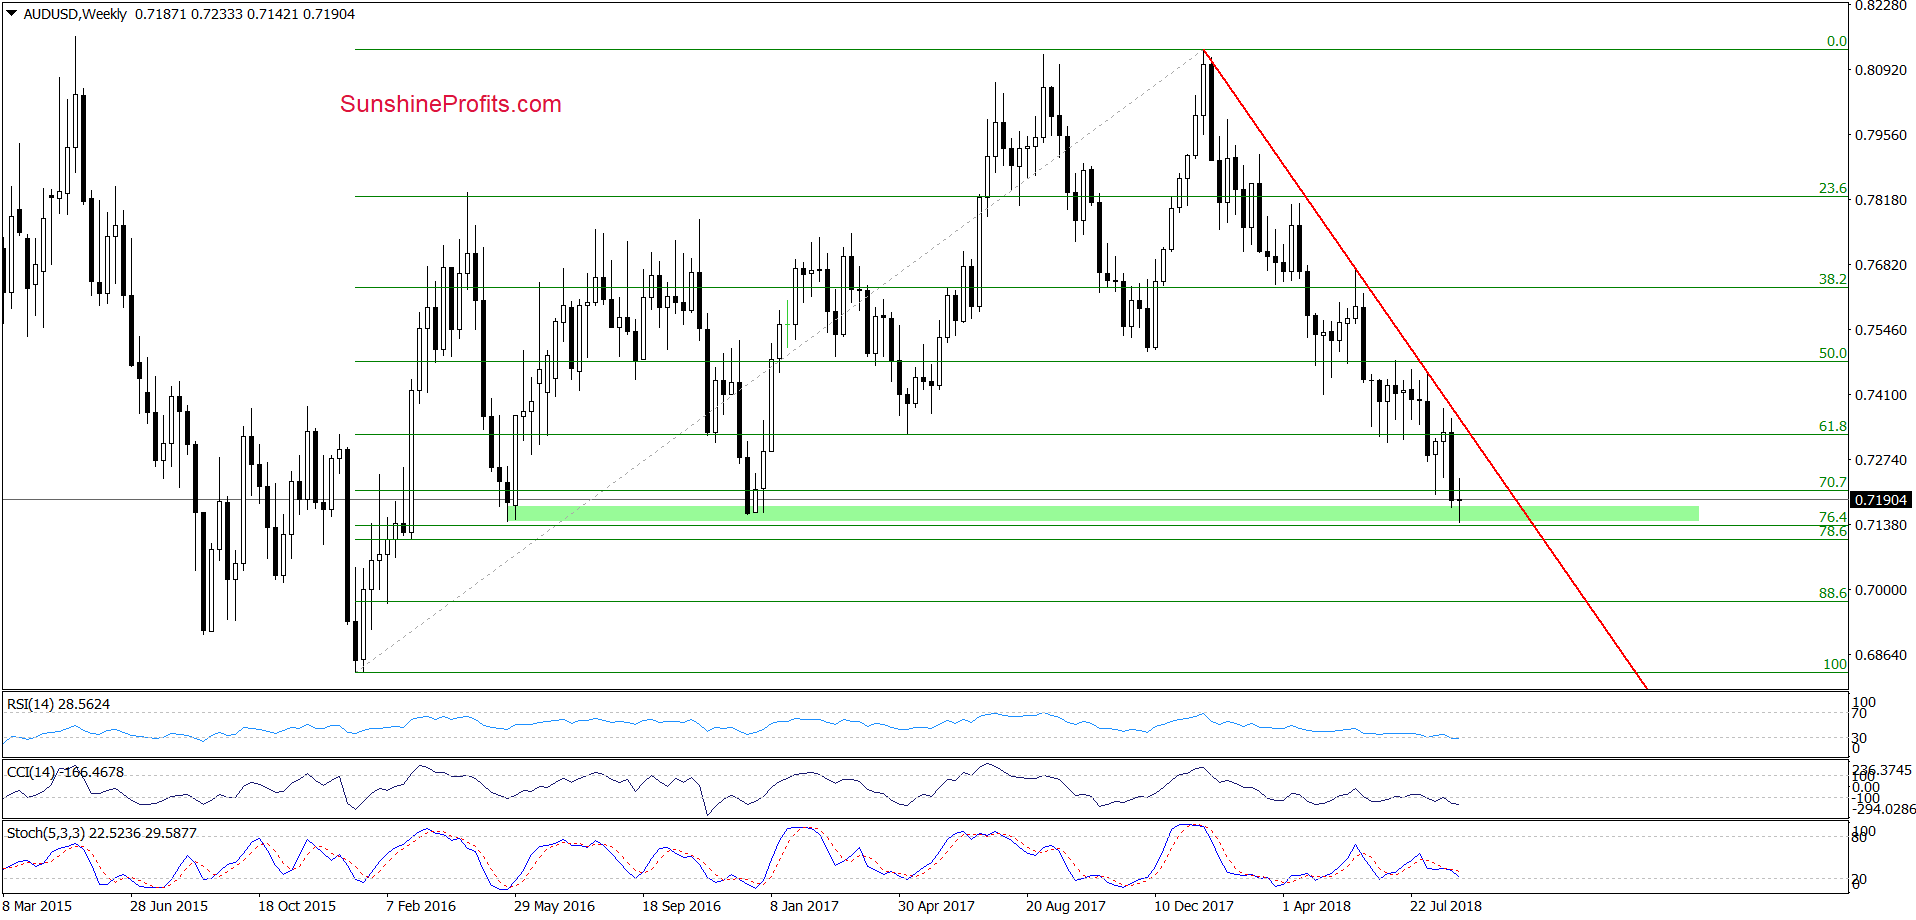
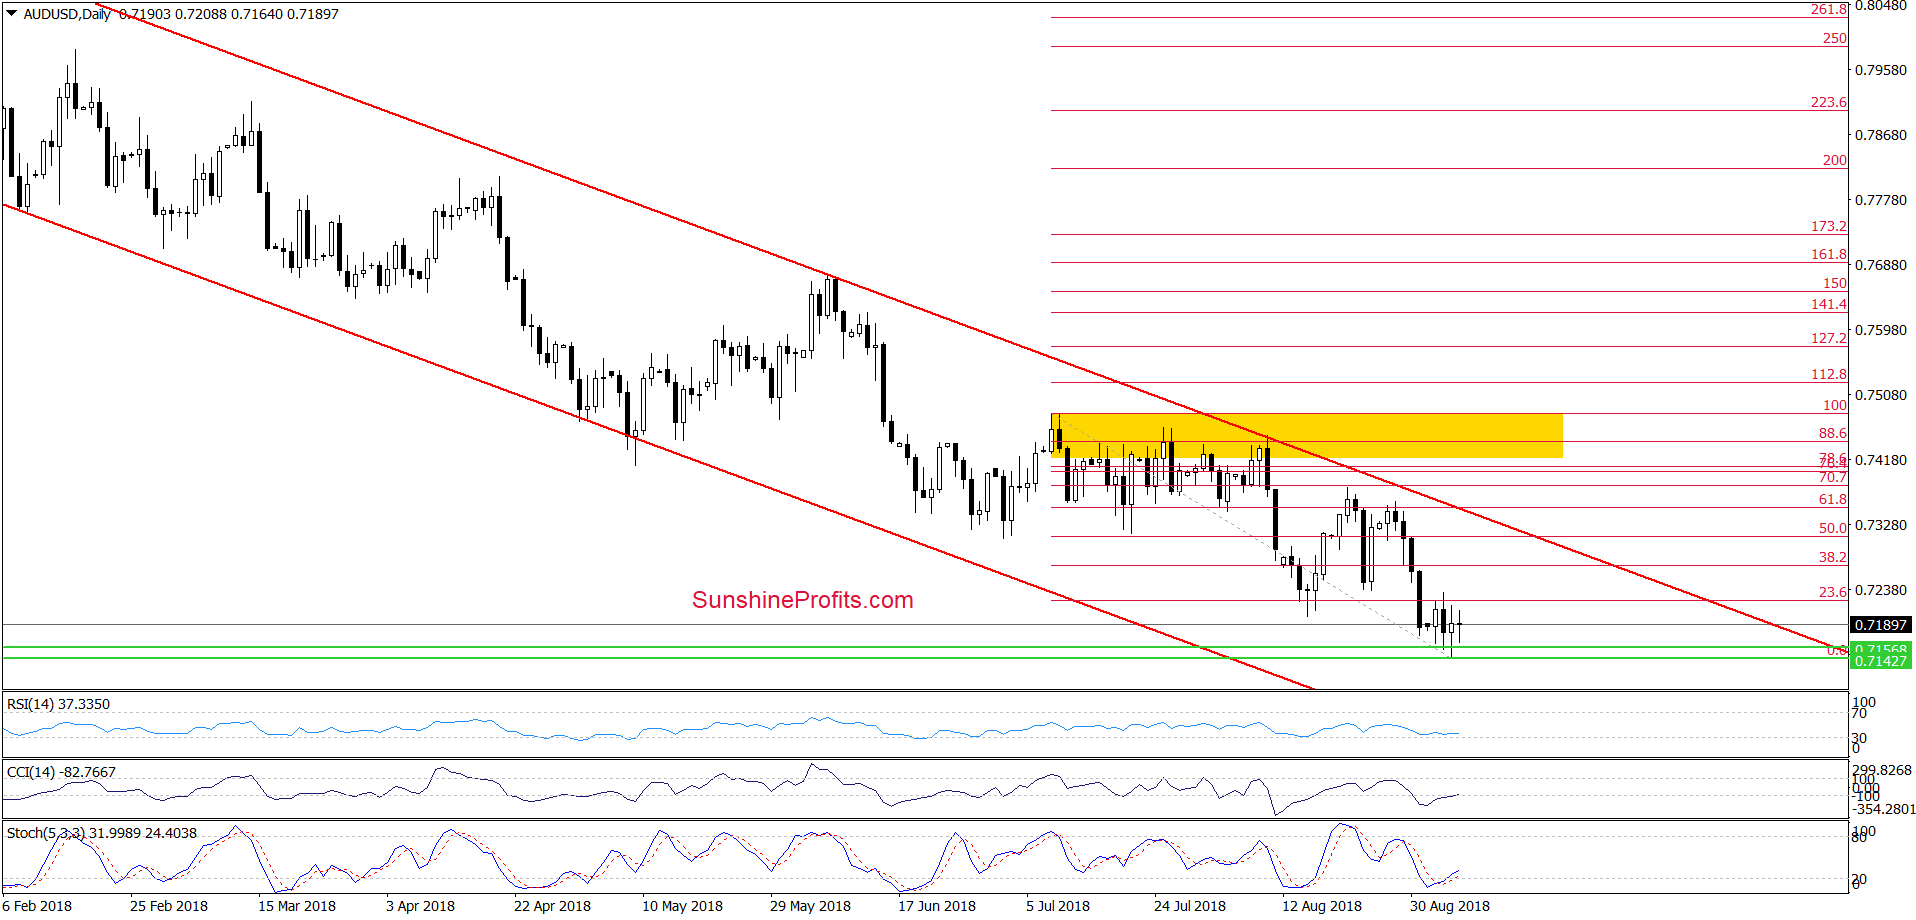
Looking at the above charts, we see that the proximity to the upper line of the red declining trend channel encouraged currency bears to trigger one more move to the downside.
Thanks to their determination AUD/USD not only hit a fresh 2018 low, but also slipped to the green support zone (marked on the weekly chart) created by the May 2016 and December 2017 lows.
Additionally, the exchange rate almost touched the next support area based on the 76.4% and 78.6% Fibonacci retracements, which suggests that reversal and bigger rebound is just around the corner.
If this is the case, and the buyers take control on the trading floor, the first upside target will be the upper border of the trend channel. However, if AUD/USD breaks above it, we could see a climb to (at least) the yellow resistance zone seen on the daily chart.
Trading position (short-term; our opinion): No positions are justified from the risk/reward perspective. We will keep you informed should anything change, or should we see a confirmation/invalidation of the above.
Thank you.
Nadia Simmons
Forex & Oil Trading Strategist
Przemyslaw Radomski, CFA
Founder, Editor-in-chief, Gold & Silver Fund Manager
Gold & Silver Trading Alerts
Forex Trading Alerts
Oil Investment Updates
Oil Trading Alerts

