

Looking at the chart of AUD/USD, we can observe that from session to session currency bulls grow in strength and effectively push this exchange rate higher. Is the road to the north open to them? Where can their rivals be lurking?
EUR/USD
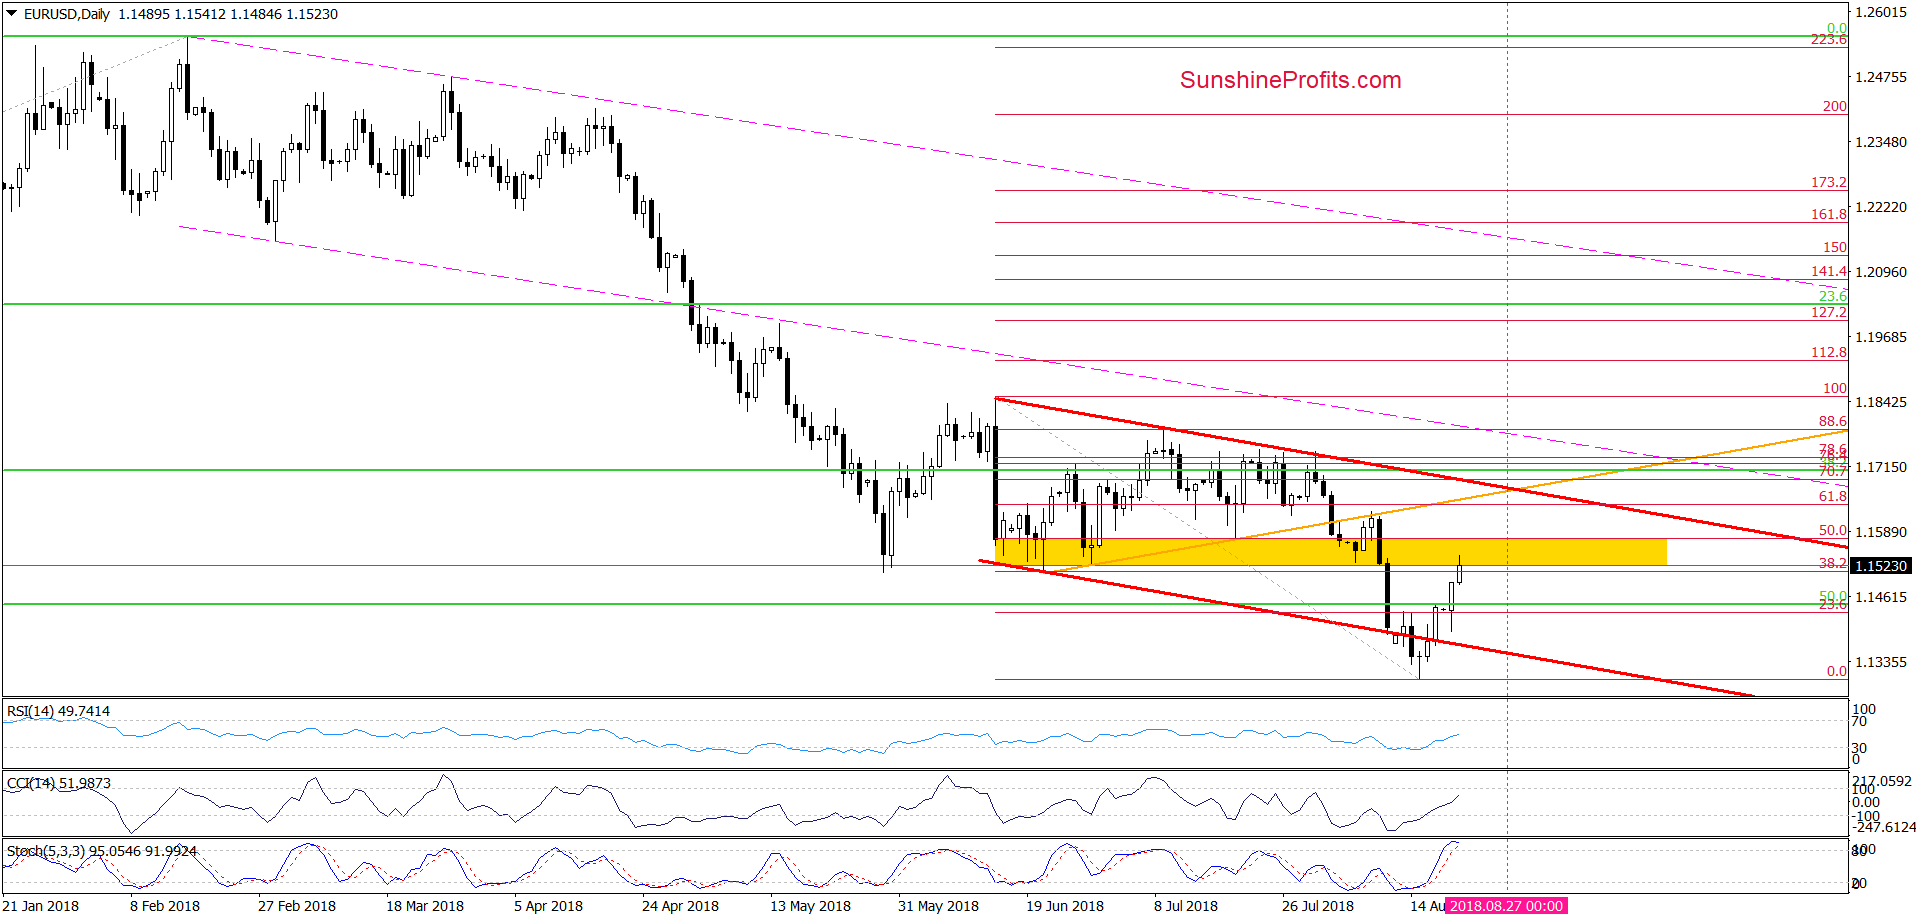
Despite yesterday’s move to the downside after the session’s open, currency bulls stopped their opponents and triggered a rebound, which activated our stop-loss order and protected our capital from further losses.
Earlier today, the exchange rate moved even higher, breaking above the 38.2% Fibonacci retracement and reaching the yellow resistance zone based on June lows. Additionally, the Stochastic Oscillator climbed to its overbought area, which suggests that another downswing may be just around the corner.
Nevertheless, as long as there is no a sell signal(s) and currency bulls do not show weakness a test of the previously-broken orange line (which serves as the nearest resistance) can’t be ruled out.
Trading position (short-term; our opinion): No positions are justified from the risk/reward perspective. We will keep you informed should anything change, or should we see a confirmation/invalidation of the above.
USD/CAD
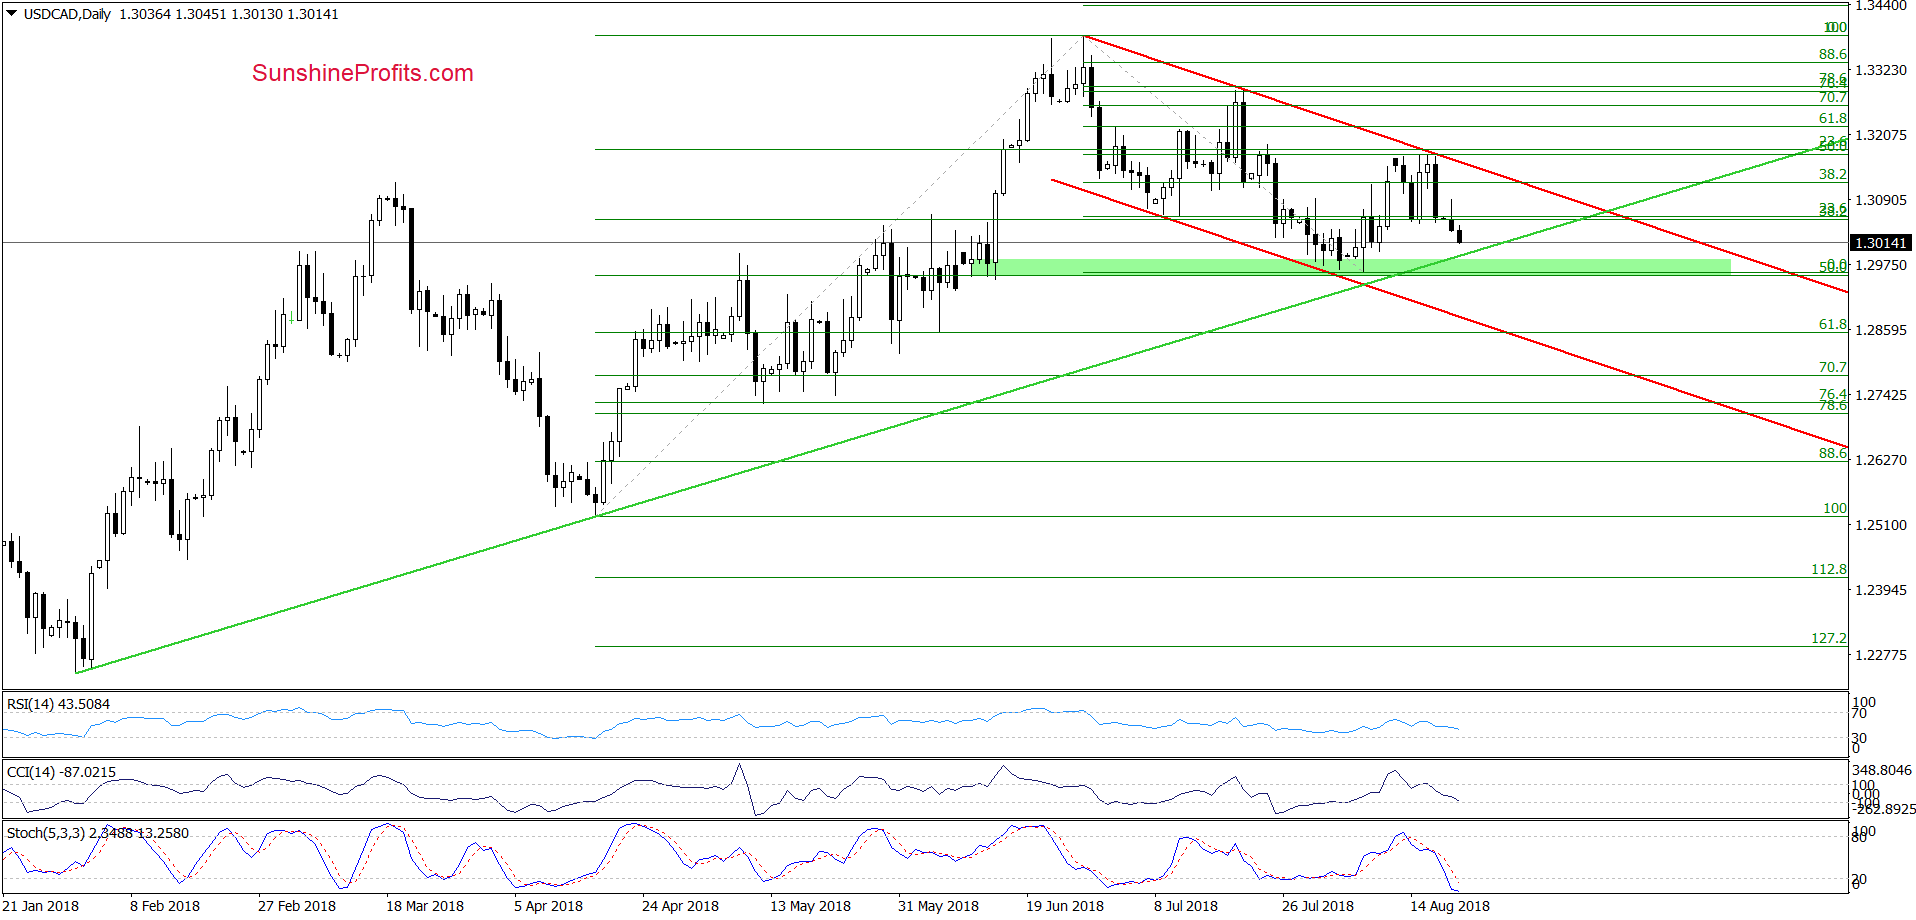
From today’s point of view, we see that USD/CAD extended losses since the beginning of the week, which increases significantly the likelihood that we’ll see a realization of the pro-bearish scenario about which we wrote on Friday:
(…) currency bears took control earlier today after another unsuccessful climb above the upper line of the red declining trend channel.
Taking this fact into account and combining it with the sell signals generated by the CCI and the Stochastic Oscillator, we think that the exchange rate will extends declines and we’ll see a test of the medium-term green line based on February and April lows in the following days.
Finishing today’s alert, please note that this support intersects the green support zone based on recent lows, which increases its importance for currency bulls and further moves. Why? Because if the pair drops below these levels, we could see even a test of the lower line of the red trend channel and the 61.8% Fibonacci retracement in the coming week.
Trading position (short-term; our opinion): No positions are justified from the risk/reward perspective. We will keep you informed should anything change, or should we see a confirmation/invalidation of the above.
AUD/USD
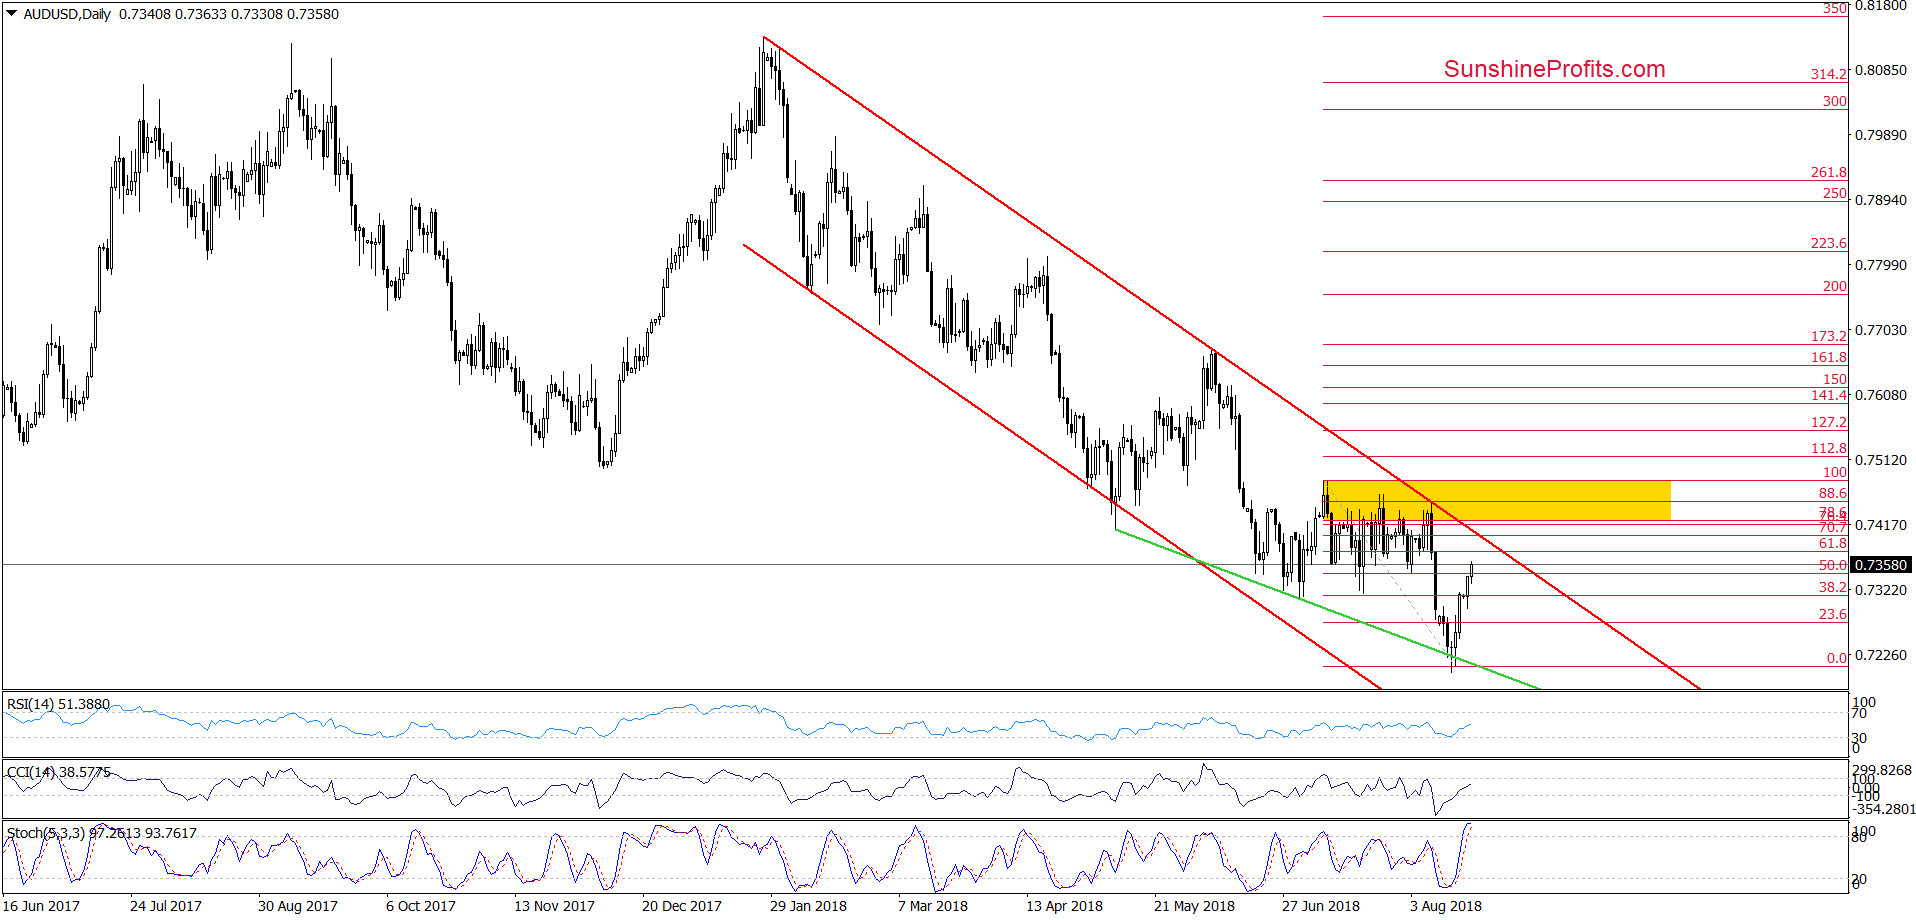
Looking at the daily chart, we see that an invalidation of the tiny breakdown under the green support line based on the previous lows encouraged currency bulls to act and resulted in a bigger rebound.
Thanks to this move, AUD/USD erased over 50% of the July-August decline, which suggests that we’ll likely see a test of the upper border of the red declining trend channel in the very near future.
At this point, however, it is worth noting that the Stochastic Oscillator is very close to generating a sell signal, which increases the probability that reversal is just a matter of time (very short time).
If this is the case, and we’ll see any reliable signs of currency bulls’ weakness, we’ll consider re-opening short positions. Stay tuned.
Trading position (short-term; our opinion): No positions are justified from the risk/reward perspective. We will keep you informed should anything change, or should we see a confirmation/invalidation of the above.
Thank you.
Nadia Simmons
Forex & Oil Trading Strategist
Przemyslaw Radomski, CFA
Founder, Editor-in-chief, Gold & Silver Fund Manager
Gold & Silver Trading Alerts
Forex Trading Alerts
Oil Investment Updates
Oil Trading Alerts

