

In recent days, the U.S. dollar moved sharply lower against the yen, which erased almost entire upward move seen in May. Is it possible that the space for declines is limited?
In our opinion the following forex trading positions are justified - summary:
EUR/USD
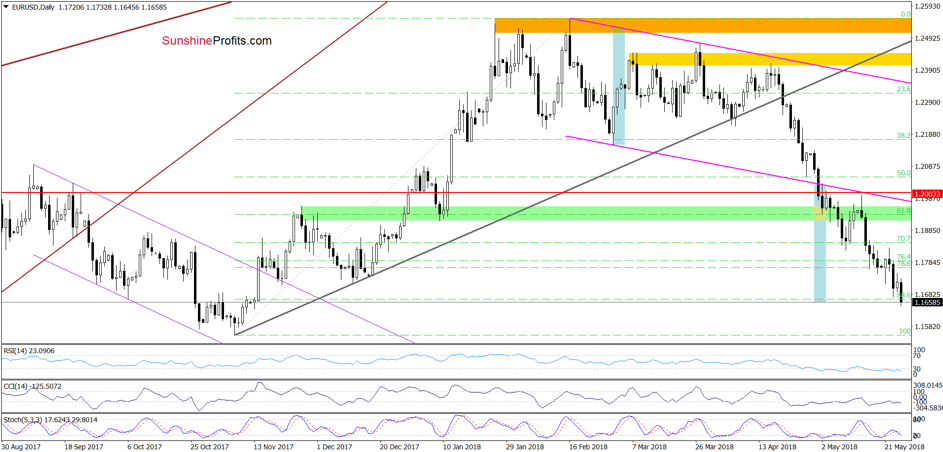
On Wednesday, we wrote the following:
(...) not far from current levels, the size of the downward move will correspond to the height of the pink declining trend channel (marked (...) with the blue rectangle), which will likely weaken the strength of sellers ñ especially when we factor in the 88.6% Fibonacci retracement and the position of the daily indicators.
From today's point of view, we see that currency bears pushed EUR/USD lower, which resulted in a drop to our downside target. What's next? If the above-mentioned area stops the sellers, we'll likely see a rebound. Nevertheless, the sell signal generated by the Stochastic Oscillators suggests that further deterioration and a test of the next support zone (created by the November lows in terms of an intraday lows and openings) can't be ruled out.
Trading position (short-term; our opinion): No positions are justified from the risk/reward perspective. We will keep you informed should anything change, or should we see a confirmation/invalidation of the above.
USD/JPY
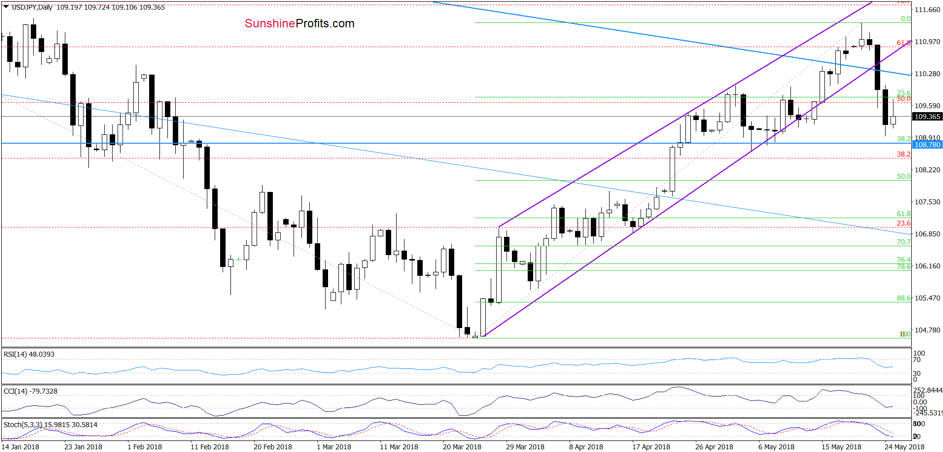
Quoting our last commentary on this currency pair:
(...) USD/JPY broke above the 61.8% Fibonacci retracement yesterday. Although this was a positive event, the proximity to the upper line of the purple rising wedge and the long-term resistance line (marked on the weekly chart below) encouraged the sellers to act earlier today.
Additionally, all daily indicators are very close to generating sell signals, increasing the probability of reversal in the very near future.
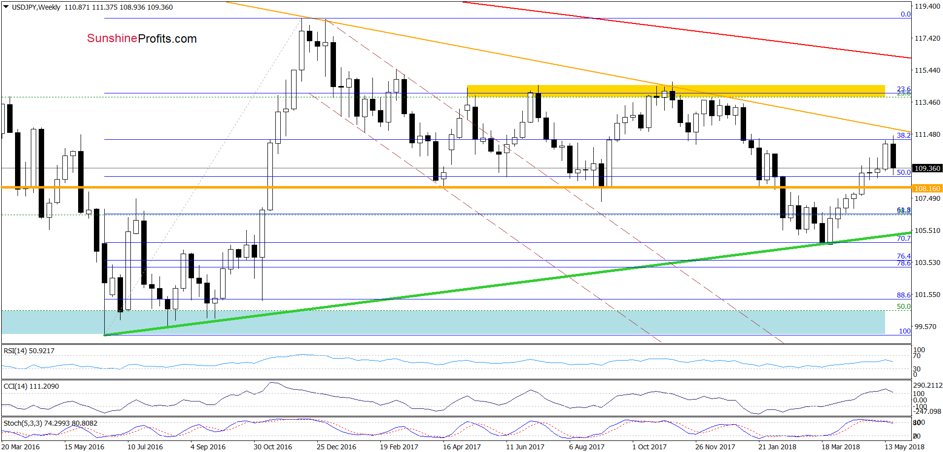
(...) thanks to the recent increase, USD/JPY approached the orange declining resistance line, which stopped currency bulls many times in the past (in December 2016, January 2017, November 2017 and also during last December).
Therefore, even if the exchange rate moves a bit higher from here, the space for rally seem limited.
Looking at the above charts, we see that the situation developed in line with the above scenario and USD/JPY reversed and declined quite sharply in recent days. Although the exchange rate rebounded slightly earlier today, the sell signals generated by the daily indicators remain in the cards, suggesting one more downswing and a test of the 38.2% Fibonacci retracement (at 108.78) marked on the daily chart in the coming days.
Trading position (short-term; our opinion): No positions are justified from the risk/reward perspective.
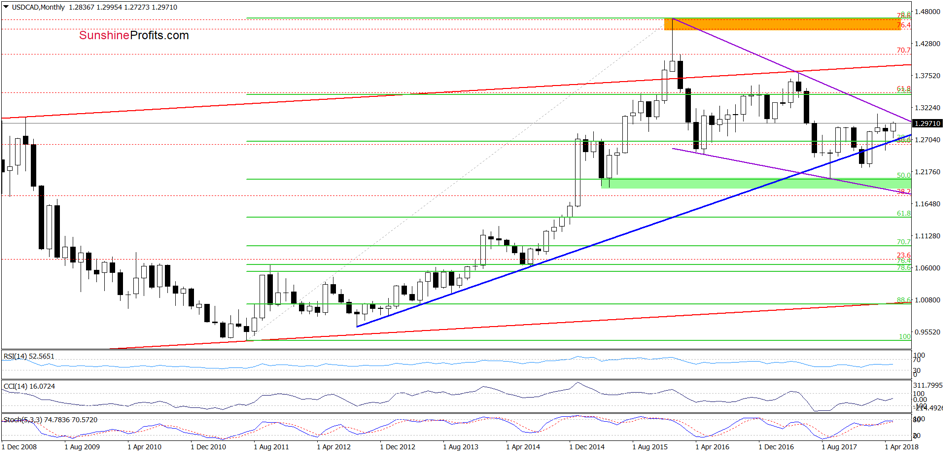
USD/CAD
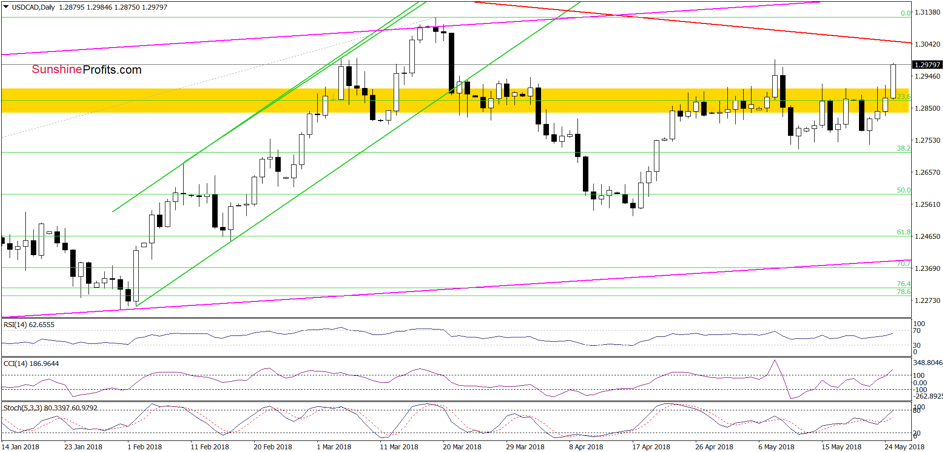
Quoting our Wednesday's alert:
(...) the pair extended gains and came back to the yellow resistance zone, which suggests that a test of the early May can't be ruled out.
As you see on the daily chart, currency bulls took USD/CAD higher as we had expected, and the exchange rate approached the May 8 high.
What's next? We believe that the best answer to this question will be the quote from our last commentary on this currency pair:
(...) Nevertheless, we think that as long as USD/CAD is trading under the purple declining resistance line (marked on the monthly chart below), a bigger move to the upside is not likely to be seen.
Trading position (short-term; our opinion): No positions are justified from the risk/reward perspective. We will keep you informed should anything change, or should we see a confirmation/invalidation of the above.
Thank you.
Nadia Simmons
Forex & Oil Trading Strategist
Przemyslaw Radomski, CFA
Founder, Editor-in-chief
Gold & Silver Trading Alerts
Forex Trading Alerts
Oil Investment Updates
Oil Trading Alerts

