

Although currency bulls had some problems with the previously-broken lower border of the trend channel in recent days, they finally came back above this line, invalidating earlier breakdown. How positive effects can it bring in the coming days?
In our opinion the following forex trading positions are justified - summary:
- EUR/USD: short (a stop-loss order at 1.2568; the initial downside target at 1.2173)
- GBP/USD: short (a stop-loss order at 1.4480; the initial downside target at 1.3851)
- USD/JPY: none
- USD/CAD: short (a stop-loss order at 1.2985; the next downside target at 1.2710)
- USD/CHF: long (a stop-loss order at 0.9329; the initial upside target at 0.9736)
- AUD/USD: none
Before we check the current situation in our currency pairs, let’s take a closer look at the recent price action in the USD Index.
What’s New in the USD Index?
In our Wednesday’s alert, we wrote the following:
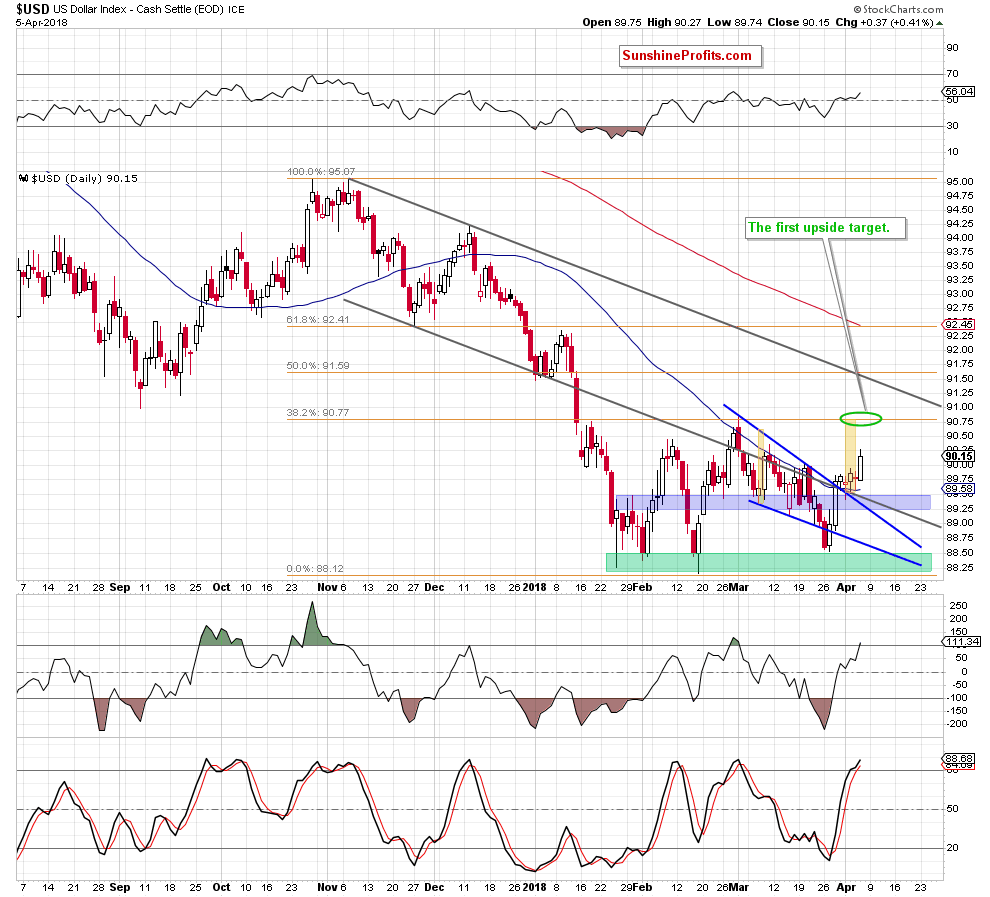
(…) the greenback came back above two important resistance lines – the previously-broken lower border of the black declining trend channel and the upper line of the blue declining wedge.
Yesterday, the index verified this breakout, which together with the buy signals generated by the indicators suggest further improvement.
From today’s point of view, we see that the situation developed in line with the above scenario and the greenback moved quite sharply higher during yesterday’s session. Taking this increase into account and combining it with the buy signals generated by all daily indicators, we believe that higher values of the index are still ahead of us.
How high could the U.S. dollar go in the coming day(s)? We think that the best answer to this question will be the quote from our last commentary on this currency:
In our opinion, the first upside target will be around 90.77, where the 38.2% Fibonacci retracement and the March peak are. Additionally, in this area the size of the upward move will correspond to the height of the rising wedge (we marked it with the green ellipse), which increases the probability of the pro-bullish scenario in near future.
If this is the case and the index climbs to our first upside target, we’ll also see a realization of the bearish scenario in the case of EUR/USD as the exchange rate will test the March low and our downside target at 1.2173.
Once we know the above, let’s check how did this upswing change the very short-term situation in the EUR/USD.
EUR/USD
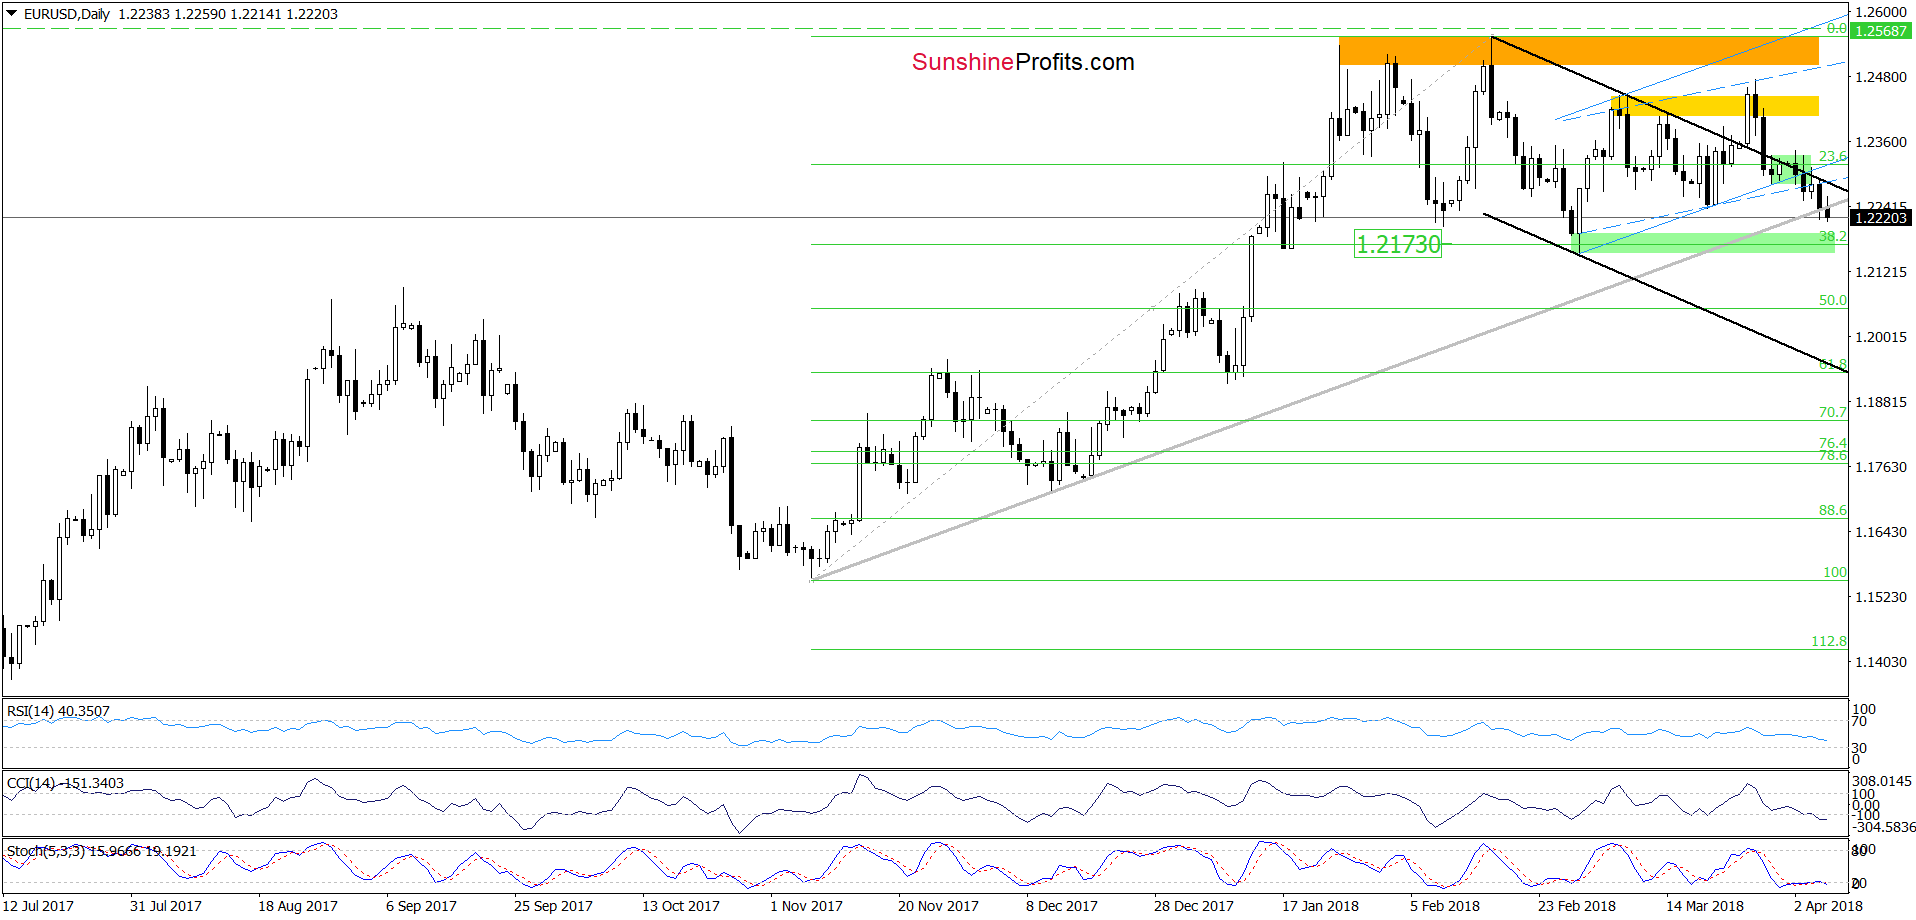
Yesterday, the upper border of the black declining trend channel in combination with the lower line of the blue rising trend channel (in terms of daily openings lows) stopped currency bulls once again.
This show of weakness encouraged their opponents to act and resulted in a decline that took the exchange rate to our first downside target about which we wrote in our Wednesday’s alert.
Although the medium-term support line based on the November and December 2017 lows triggered some rebound, the pair moved lower once again earlier today, which pushed EUR/USD under this important support line, making our short positions more profitable.
What does this drop mean for the exchange rate? In our opinion, if EUR/USD closes today’s session under the above-mentioned line, we’ll see a realization of our pro bearish scenario from Wednesday:
(…) we think that the pair will test not only the medium-term support line based on the November and December 2017 lows, but also the 38.2% Fibonacci retracement and the green support zone in the coming day(s).
Trading position (short-term; our opinion): Profitable short positions (with a stop-loss order at 1.2568 and the initial downside target at 1.2173) are justified from the risk/reward perspective. We will keep you informed should anything change, or should we see a confirmation/invalidation of the above.
USD/CAD
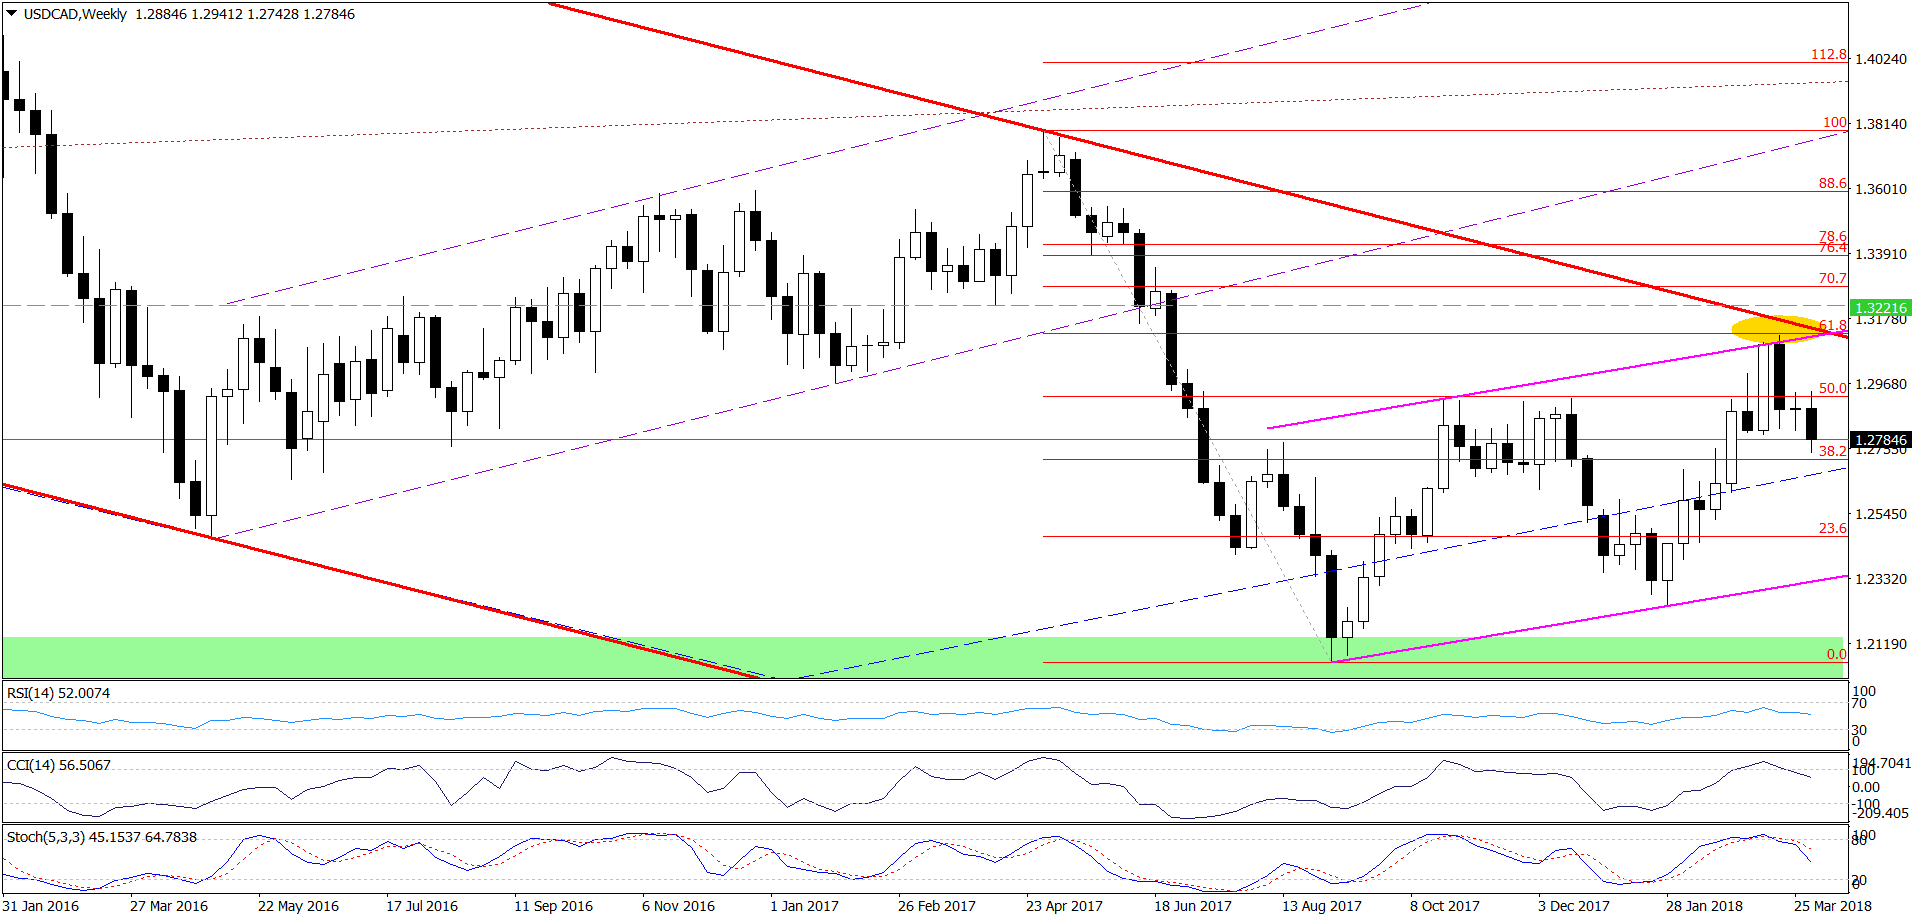
From the medium-term perspective, we see that USD/CAD extended losses earlier this week, which together with the sell signals generated by the weekly indicators supports currency bears and lower values of the exchange rate.
How low could USD/CAD go in the coming week? Let’s examine the chart below.
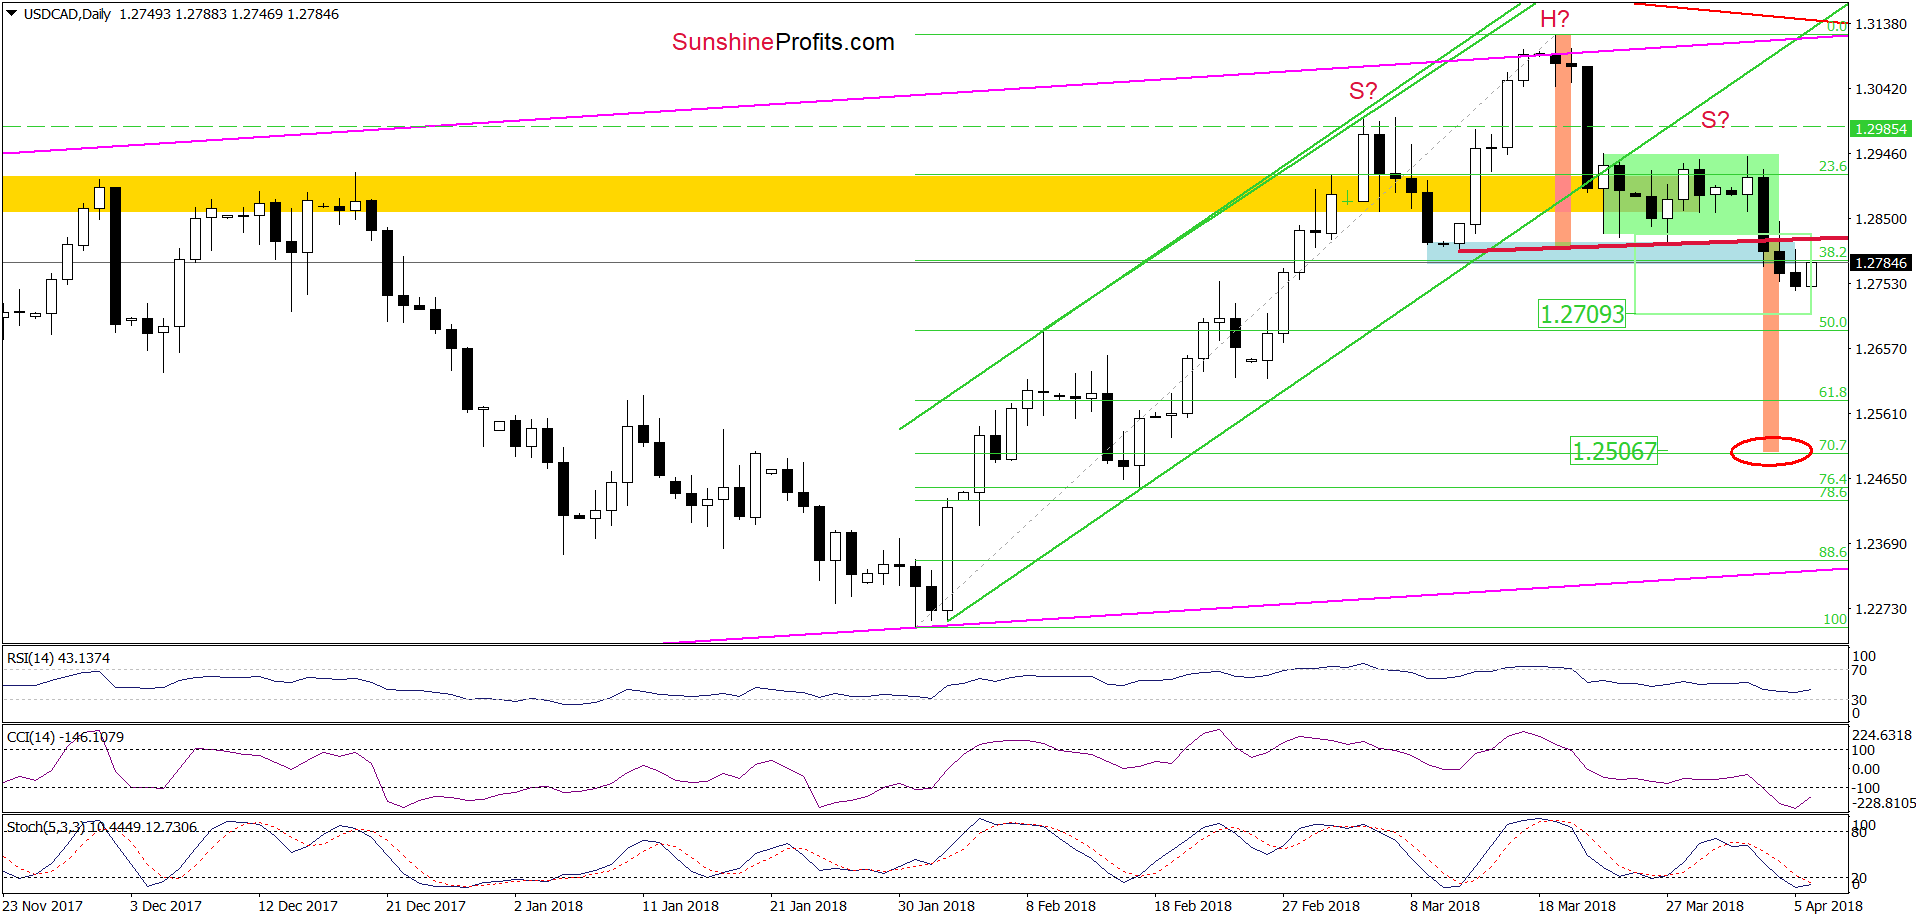
As you see on the daily chart, the exchange rate not only declined under the blue support line on Wednesday, but also closed the session below this support, which triggered further deterioration yesterday.
Earlier today, the pair moved a bit higher but in our opinion, as long as the exchange rate is trading under the blue zone (which serves as the nearest resistance now) and the previously-broken red resistance line (the neck line of the head and shoulders formation) all upswings will be nothing more than verifications of the earlier breakdown.
Taking all the above into account, we believe that the pro-bearish scenario from our last commentary on this currency pair will be in play in the coming week:
(…) the sell signals generated by the indicators remain in the cards, which together with yesterday’s breakdown suggest further deterioration and a drop to around 1.2709, where the size of the move will correspond to the height of the green consolidation.
(…) And speaking about the bearish potential… Looking at the daily chart, you probably already noticed a potential head and shoulders formation. (…) in our opinion, (…) if USD/CAD falls below the blue support zone (…) the likelihood of a decline under the above-mentioned downside target will increase significantly.
(…) how low could the exchange rate go (…)?
In our opinion, the next downside target will be around 1. 2506, where the size of the downward move will correspond to the height of the head and shoulders formation.
Nevertheless, before we see the pair at this level, currency bears will have to break under 50% and 61.8% Fibonacci retracements first. Therefore, we will continue to monitor the market and keep you informed should we see a confirmation/invalidation of the above.
Trading position (short-term; our opinion): Profitable short positions (with a stop-loss order at 1.2985 and the next downside target at 1.2710) are justified from the risk/reward perspective now. We will keep you informed should anything change, or should we see a confirmation/invalidation of the above.
USD/CHF
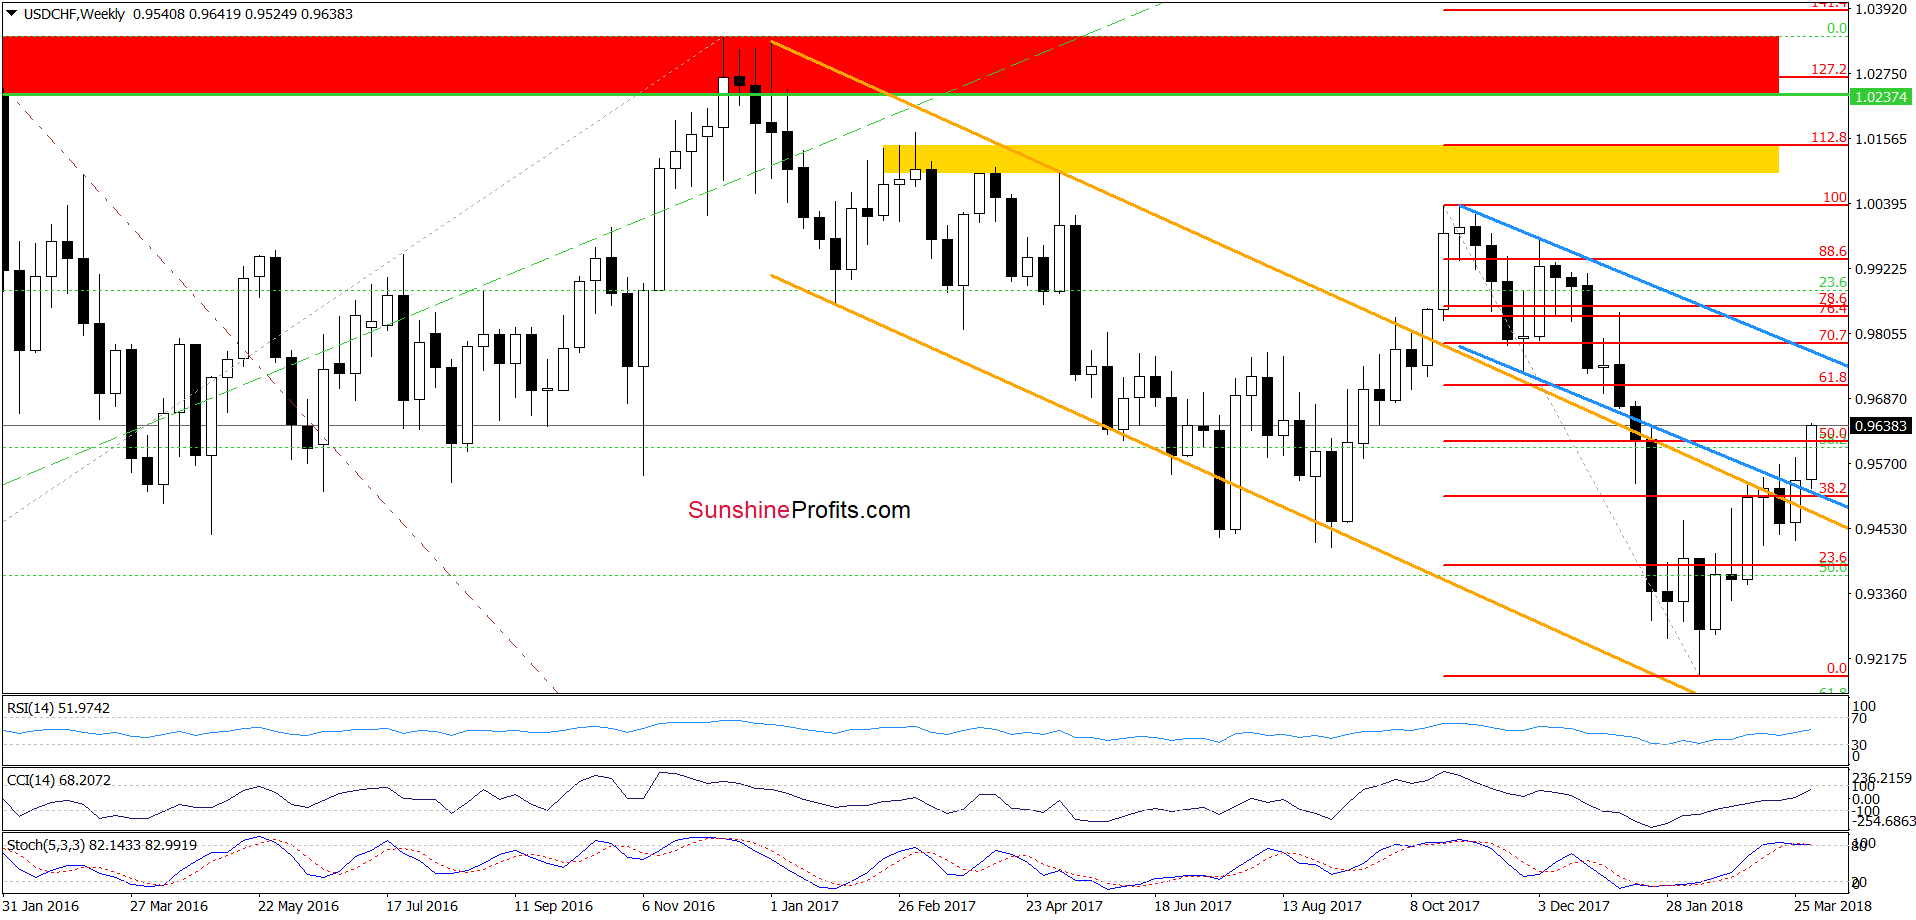
Looking at the medium-term chart, we see that USD/CHF extended gains and broke above the 50% Fibonacci retracement, opening the way to higher levels. But will we see such price action in the coming week? Let’s examine the daily chart to find out.
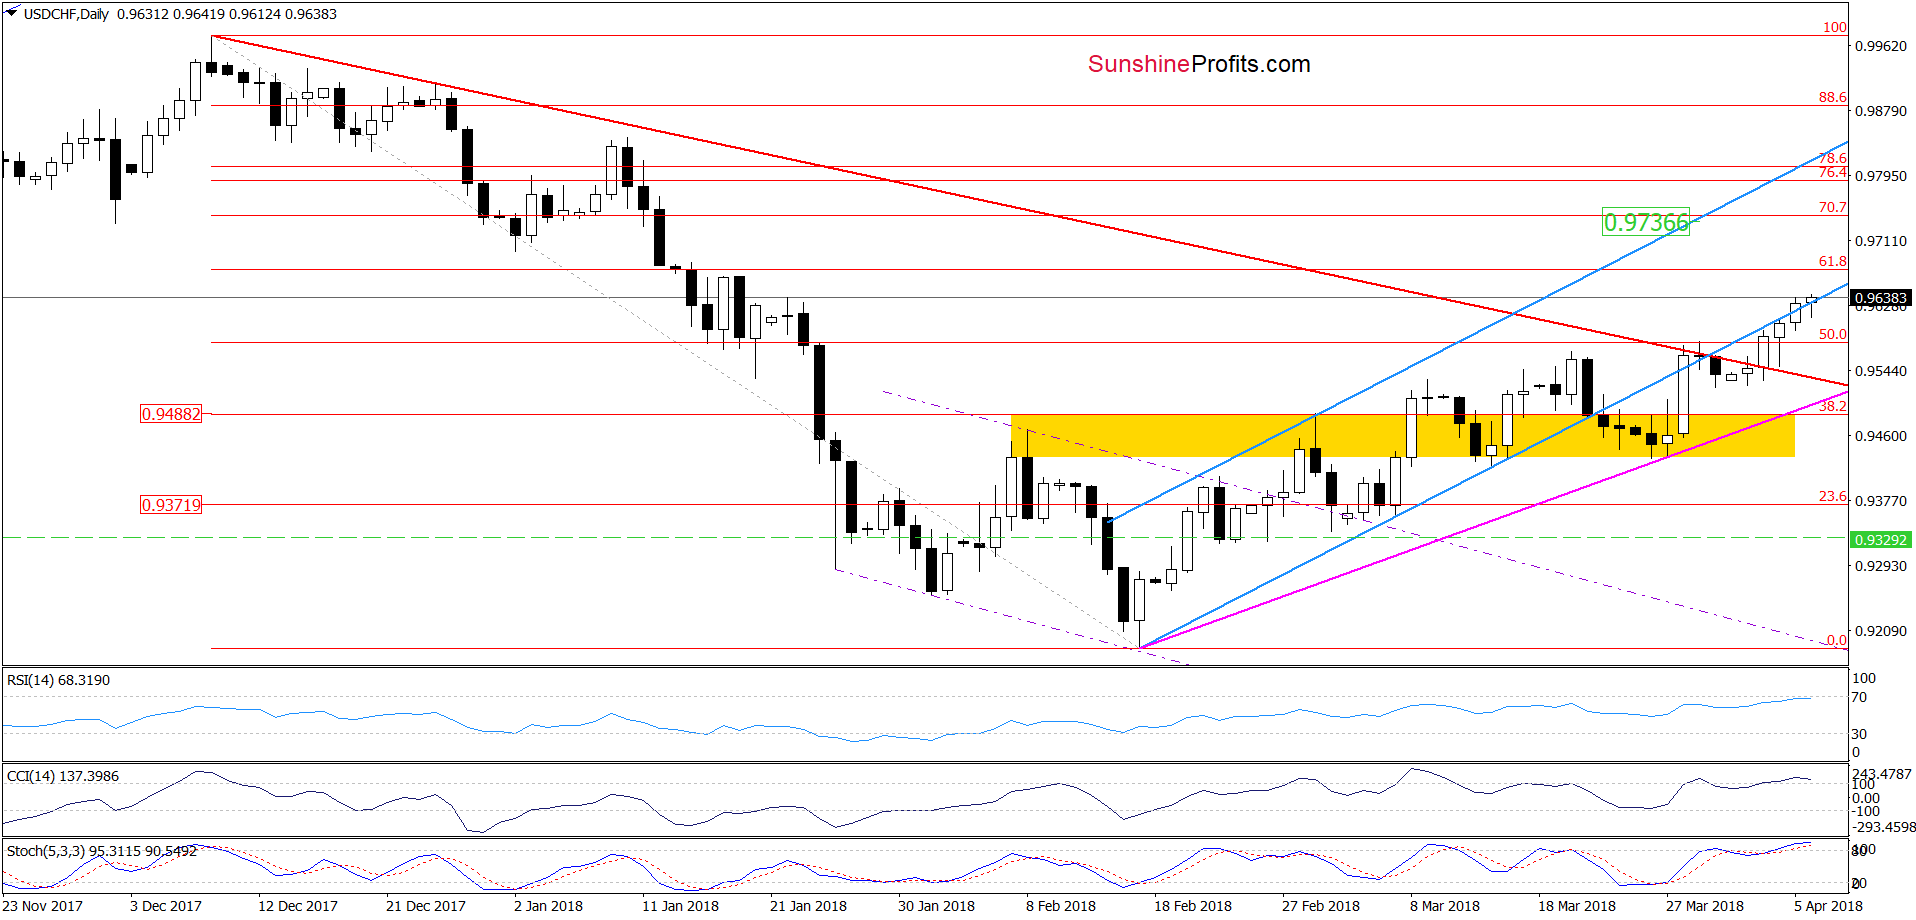
From this perspective, we see that although USD/CHF moved a bit lower on Wednesday (after another unsuccessful attempt to climb above the lower border of the blue rising trend channel), the proximity to the previously-broken red declining line (which serves as the nearest support) was enough to encourage currency bulls to act.
Thanks to their attack, the pair rebounded and invalidated the earlier breakdown under the lower line of the blue rising trend channel yesterday. Earlier today, we noticed one more upswing, which suggests that we’ll see (at least) a test of the 61.8% Fibonacci retracement (at 0.9672) in the very near future.
Trading position (short-term; our opinion): Profitable long positions (with a stop-loss order at 0.9329 and the initial upside target at 0.9736) are justified from the risk/reward perspective. We will keep you informed should anything change, or should we see a confirmation/invalidation of the above.
Thank you.
Nadia Simmons
Forex & Oil Trading Strategist
Przemyslaw Radomski, CFA
Founder, Editor-in-chief, Gold & Silver Fund Manager
Gold & Silver Trading Alerts
Forex Trading Alerts
Oil Investment Updates
Oil Trading Alerts

