

The last week’s increases erased almost 50% of the June-August downward move. Is this a positive development? Yes. Will we see its continuation in the coming days? Well, technical factors have their chosen ones.
EUR/USD
In our last commentary on this currency pair, we wrote the following:
(…) How low could the exchange rate go?
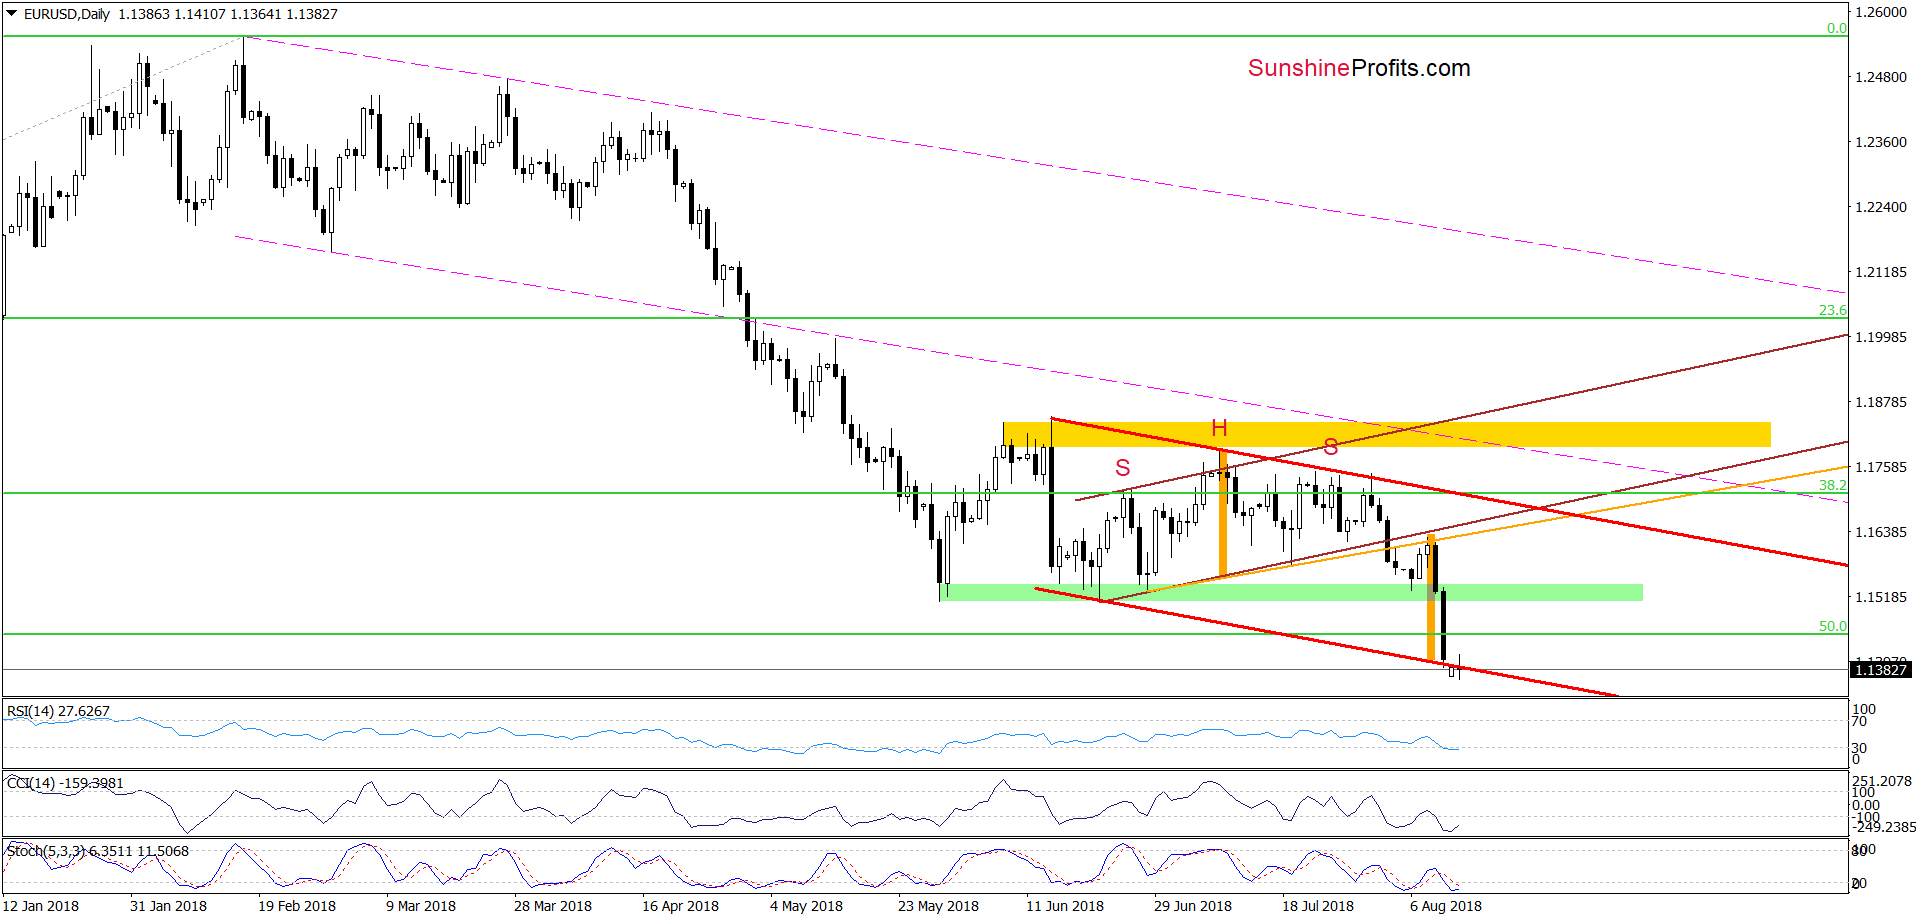
In our opinion, EUR/USD will extend losses and test the lower border of the red declining trend channel in the very near future (very likely that even later in the day). At this point it is worth noting that in this area the size of the downward move will also correspond to the height of the head and shoulders formation, which could reduce the selling pressure and trigger a rebound at the beginning of the coming week.
Looking at the daily chart, we see that the situation developed in tune with our assumptions and EUR/USD slipped to our Friday’s downside target.
What’s next for the exchange rate?
As we mentioned in our last alert, in this area the selling pressure could decrease – especially when we factor in the current position of the daily indicators. Why? Because the RSI slipped under the level of 30 for the first time since late May. Back then, such low reading of this indicators preceded a bigger rebound, which increases the probability that we could see something similar in the coming days.
Therefore, if EUR/USD closes today’s session above the lower border of the red declining trend channel, currency bulls will receive an important reason to act (an invalidation of the earlier breakdown) and we’ll likely see a rebound to (at least) the green zone based on May, June and early August lows, which serves as the nearest resistance area at the moment.
Trading position (short-term; our opinion): No positions are justified from the risk/reward perspective. We will keep you informed should anything change, or should we see a confirmation/invalidation of the above.
USD/CAD
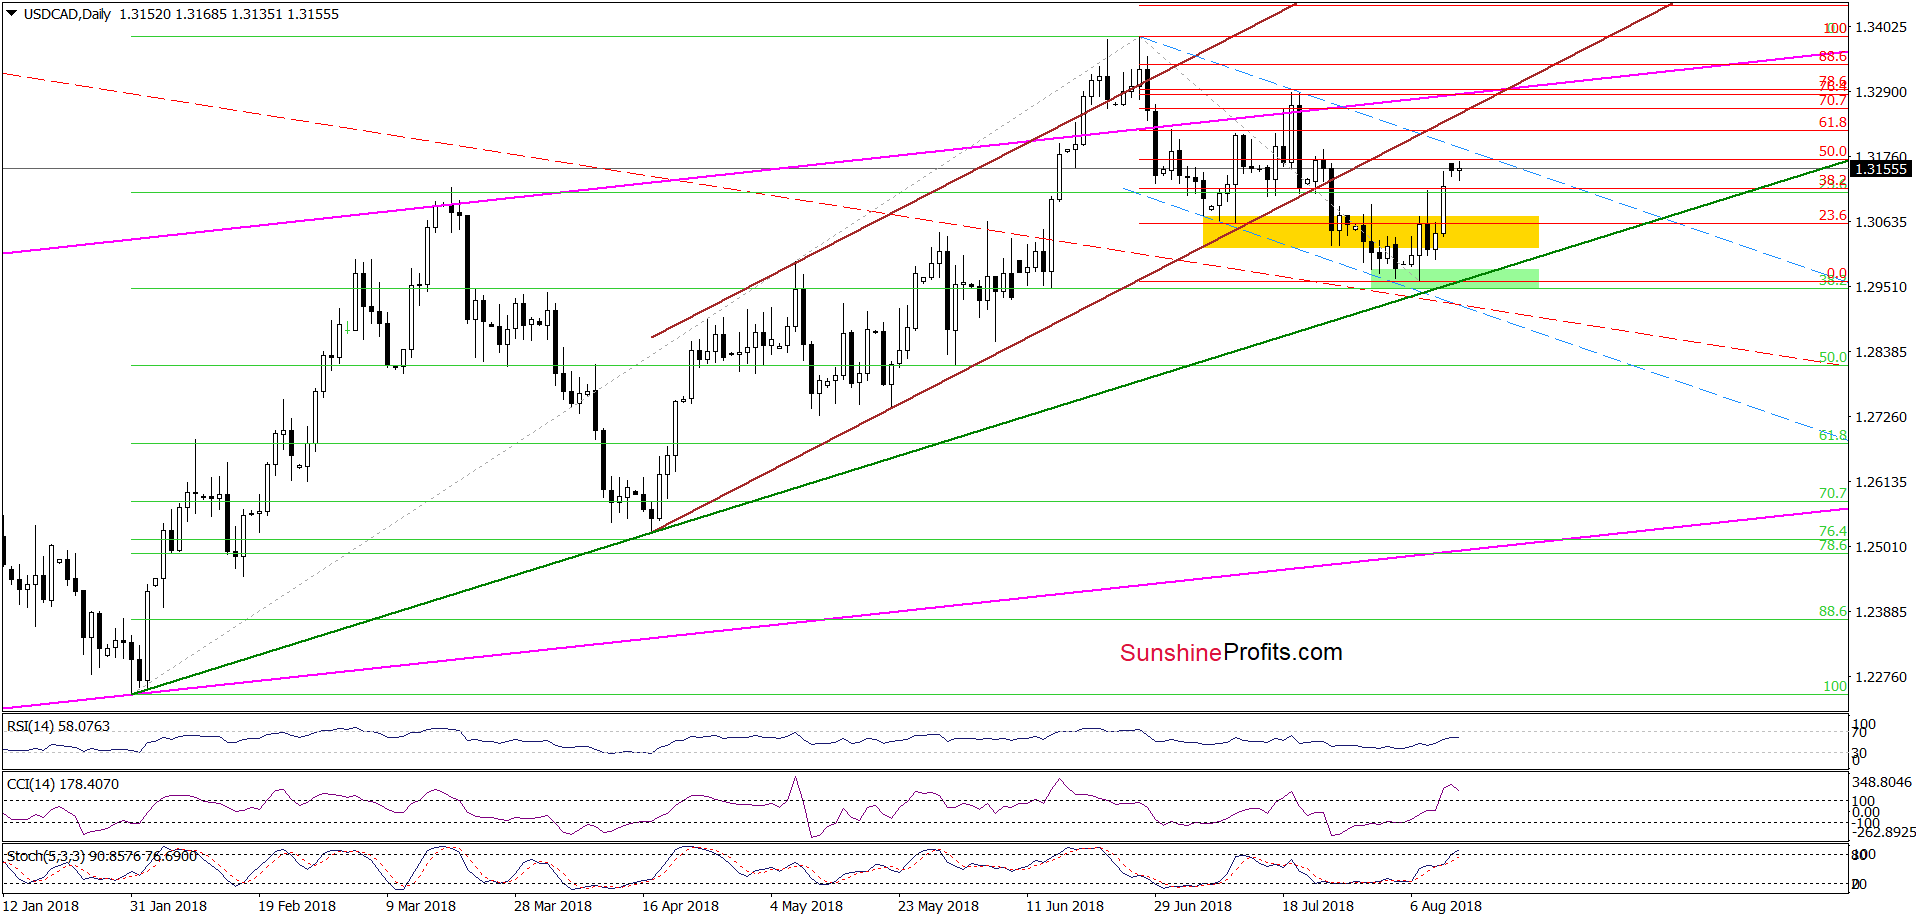
From today’s point of view, we see that USD/CAD moved sharply higher on Friday, which resulted in a breakout not only above the yellow zone, but also above the late July peak and the 38.2% Fibonacci retracement.
This bullish development, triggered further improvement and the exchange rate approached the next retracement, the July 24 high and the upper border of the blue declining trend channel (marked with dashed lines).
Will this resistance area stop the buyers in the coming week?
Looking only at the current position of the daily indicators, it’s very likely, because the RSI, the CCI and the Stochastic Oscillator climbed to their highest levels since the formation of the July peaks. Back then, they preceded a sharp reversal, which suggests that the history could repeat itself once again and we’ll see a move to the south.
If the situation develops in line with the above-assumption, USD/CAD will likely test the green support zone and recent lows in the following days.
Nevertheless, please keep in mind that such price action will be more likely and reliable if daily indicators generate sell signals and support the sellers. Until this time, waiting at the sidelines, is justified from the risk/reward perspective.
Trading position (short-term; our opinion): No positions are justified from the risk/reward perspective. We will keep you informed should anything change, or should we see a confirmation/invalidation of the above.
USD/CHF
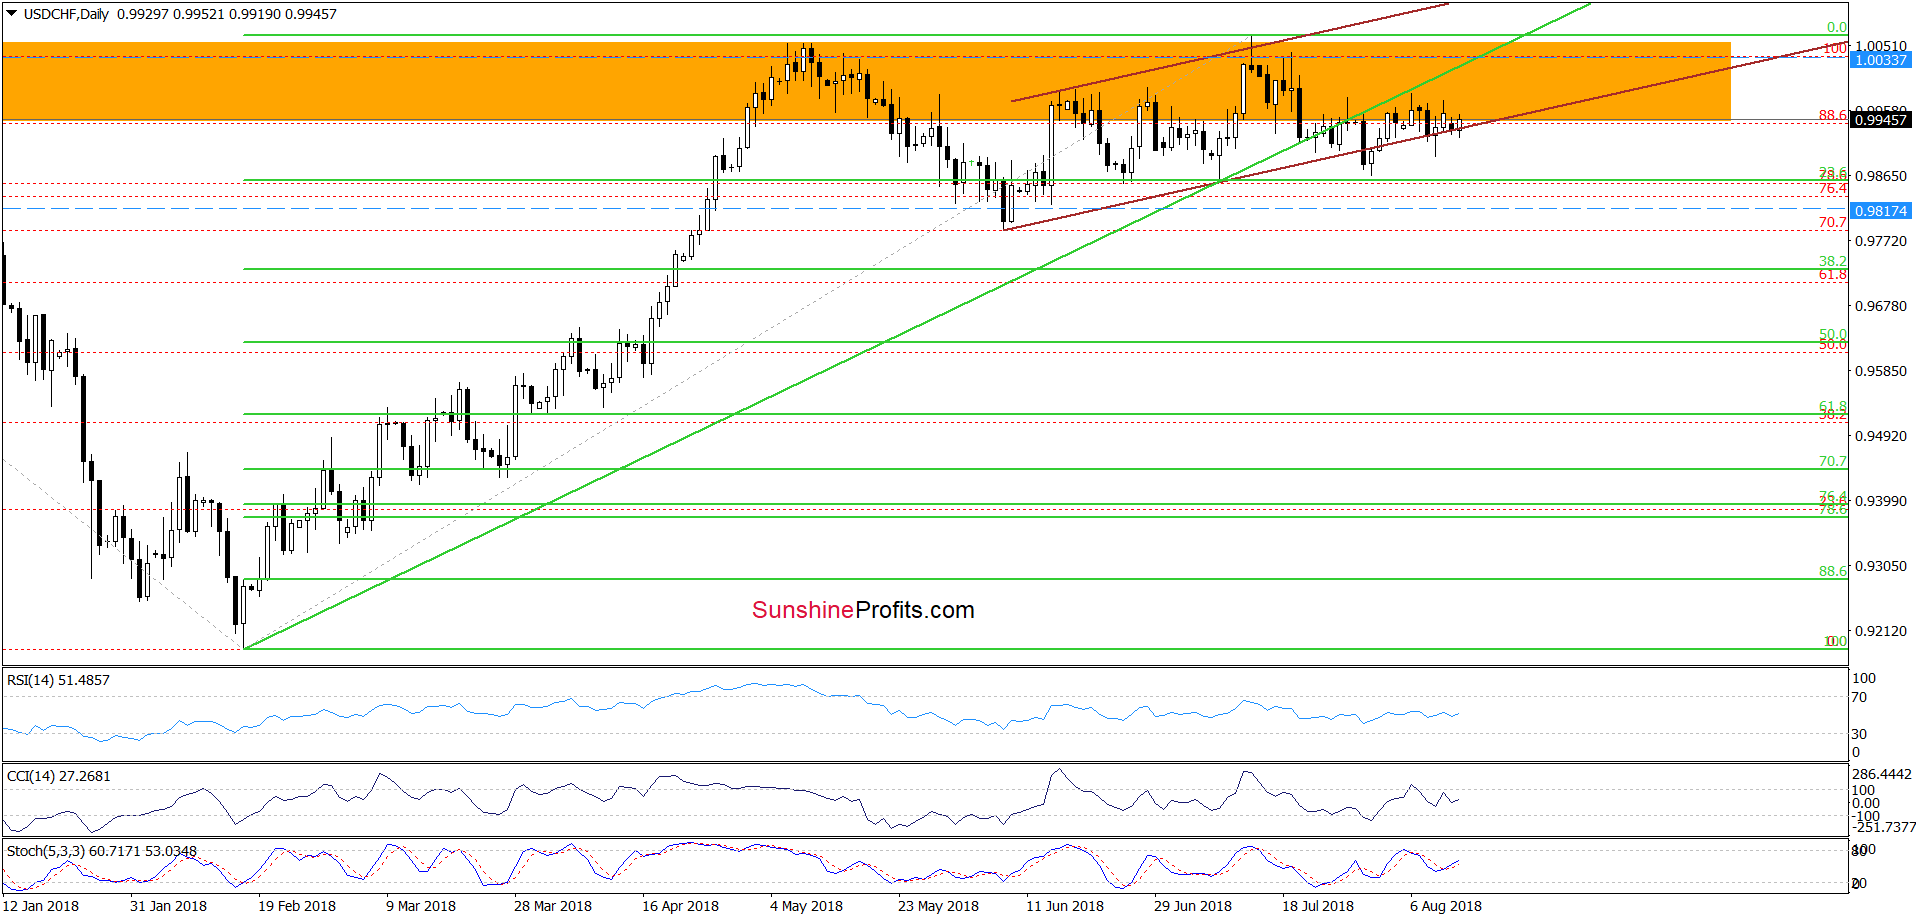
Up and down and turn around. The recent price action in USD/CHF looks a bit like a rollercoaster. On one hand, currency bears managed to break under the lower border of the brown rising trend channel several times, which suggested further deterioration.
But despite all the above-mentioned situations, their opponents bravely fight to maintain this support line and at every opportunity thwarted pro-bearish plans, rising hopes for a bigger move to the north. Nevertheless, we should keep in mind that they are not strong enough to come back above the previously-broken medium-term green line.
What does it mean?
In our opinion, as long as there is no invalidation of the breakdown higher values of USD/CHF are not likely to be seen. On the other hand, as long as currency bulls keep the exchange rate above the 23.6% Fibonacci retracement and previous lows, another significant move to the downside is very doubtful.
In other words, waiting at the sidelines for more reliable clues about the direction of the next move is justified from the risk/reward perspective now.
Trading position (short-term; our opinion): No positions are justified from the risk/reward perspective. We will keep you informed should anything change, or should we see a confirmation/invalidation of the above.
Thank you.
Nadia Simmons
Forex & Oil Trading Strategist
Przemyslaw Radomski, CFA
Founder, Editor-in-chief, Gold & Silver Fund Manager
Gold & Silver Trading Alerts
Forex Trading Alerts
Oil Investment Updates
Oil Trading Alerts

