

Yesterday, the U.S. currency extended gains against the basket of major currencies, which resulted in a breakout above the previously-broken lower border of the declining trend channel. But can we trust this improvement?
In our opinion the following forex trading positions are justified - summary:
- EUR/USD: none
- GBP/USD: short (a stop-loss order at 1.4549; the initial downside target at 1.4000)
- USD/JPY: none
- USD/CAD: short (a stop-loss order at 1.2852; the next downside target at 1.2510)
- USD/CHF: none
- AUD/USD: none
Before we analyze our currency pairs, let’s take a closer look at the recent price action in the USD Index.
Greenback’s Breakout
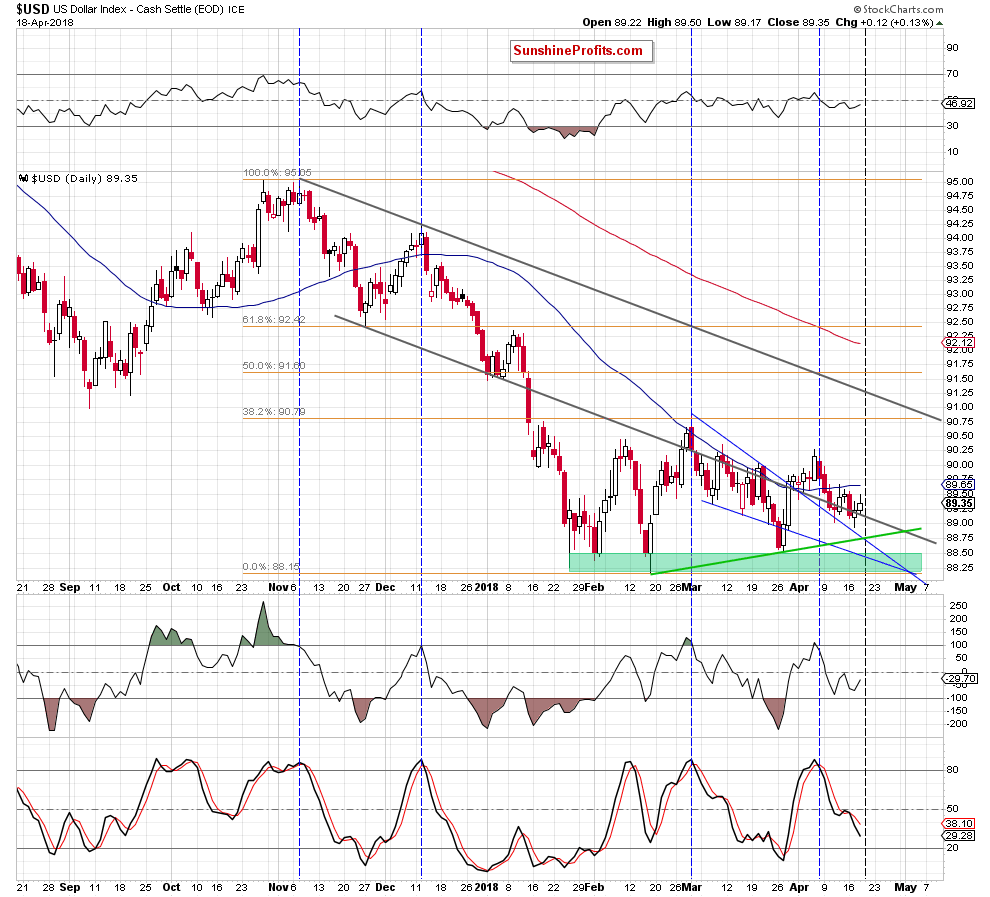
Looking at the daily chart, we see that the USD Index climbed above the previously-broken lower border of the grey declining trend channel one again. Is this a bullish development? In our opinion, not really (at least basing on yesterday’s closing price). Why? Because this is a repeat of what we already saw several times in recent weeks.
As you see on the above charts, at the turn of March and April the greenback moved higher after a similar comeback above the grey line. Despite that improvement, the buyers didn’t manage to push the U.S. currency above the first important resistance zone (created by the March peak and the 38.2% Fibonacci retracement), which resulted in another pullback to the previously-broken upper border of the blue declining wedge.
Will we see a similar price action in the following days?
The current position of the Stochastic Oscillator says yes. Nevertheless, the triangle created by the resistance line based on the March peaks (the upper border of the blue declining wedge) and the green support line based on February and March lows suggests that we could see reversal later in the day (based on the triangle apex reversal pattern).
Connecting the dots, we think that the pro-growth scenario will be more likely and reliable if the greenback shows more strength (like a daily closure above the 50-day moving average) in the near future.
Having said the above, let’s examine the current situation in EUR/USD, USD/JPY and USD/CAD.
EUR/USD
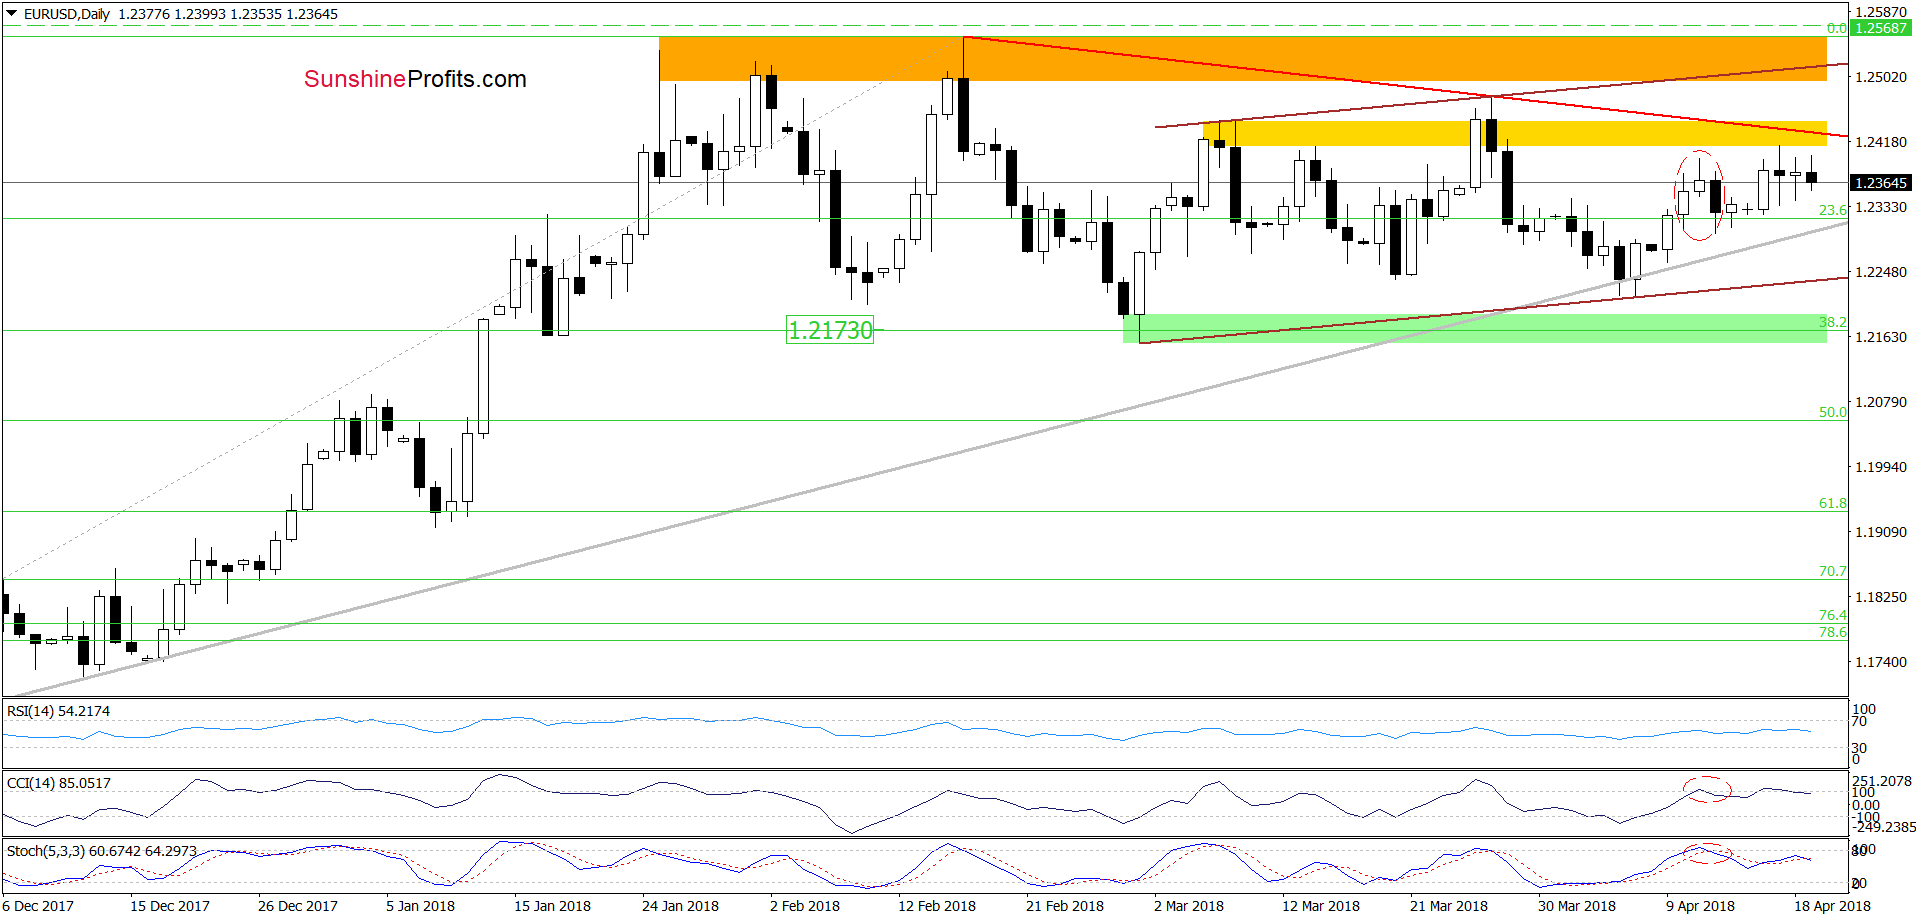
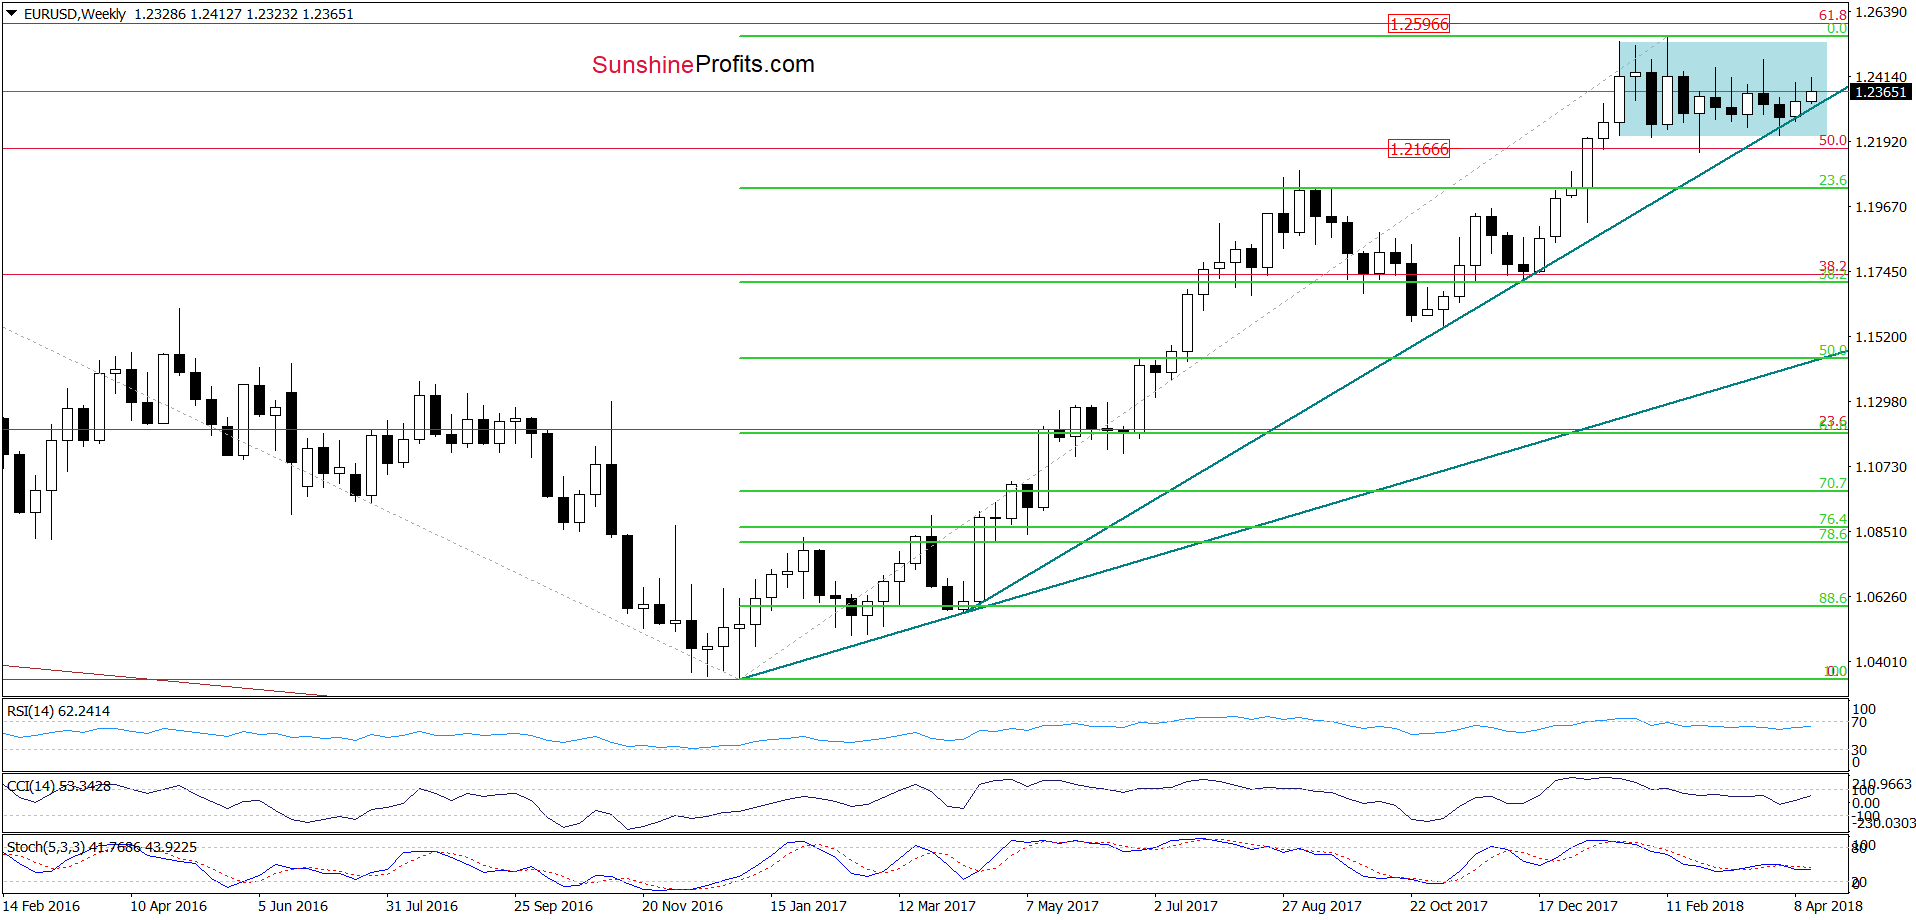
Looking at the daily chart, we see that the yellow resistance zone continues to keep gains in check. Although earlier today, the exchange rate moved a bit lower once again, it is still trading above the medium-term grey support line and the long-term green line marked on the weekly chart below, which suggests that as long as there is no breakdown below them a bigger move to the downside is not likely to be seen.
Trading position (short-term; our opinion): No positions are justified from the risk/reward perspective. We will keep you informed should anything change, or should we see a confirmation/invalidation of the above.
USD/JPY
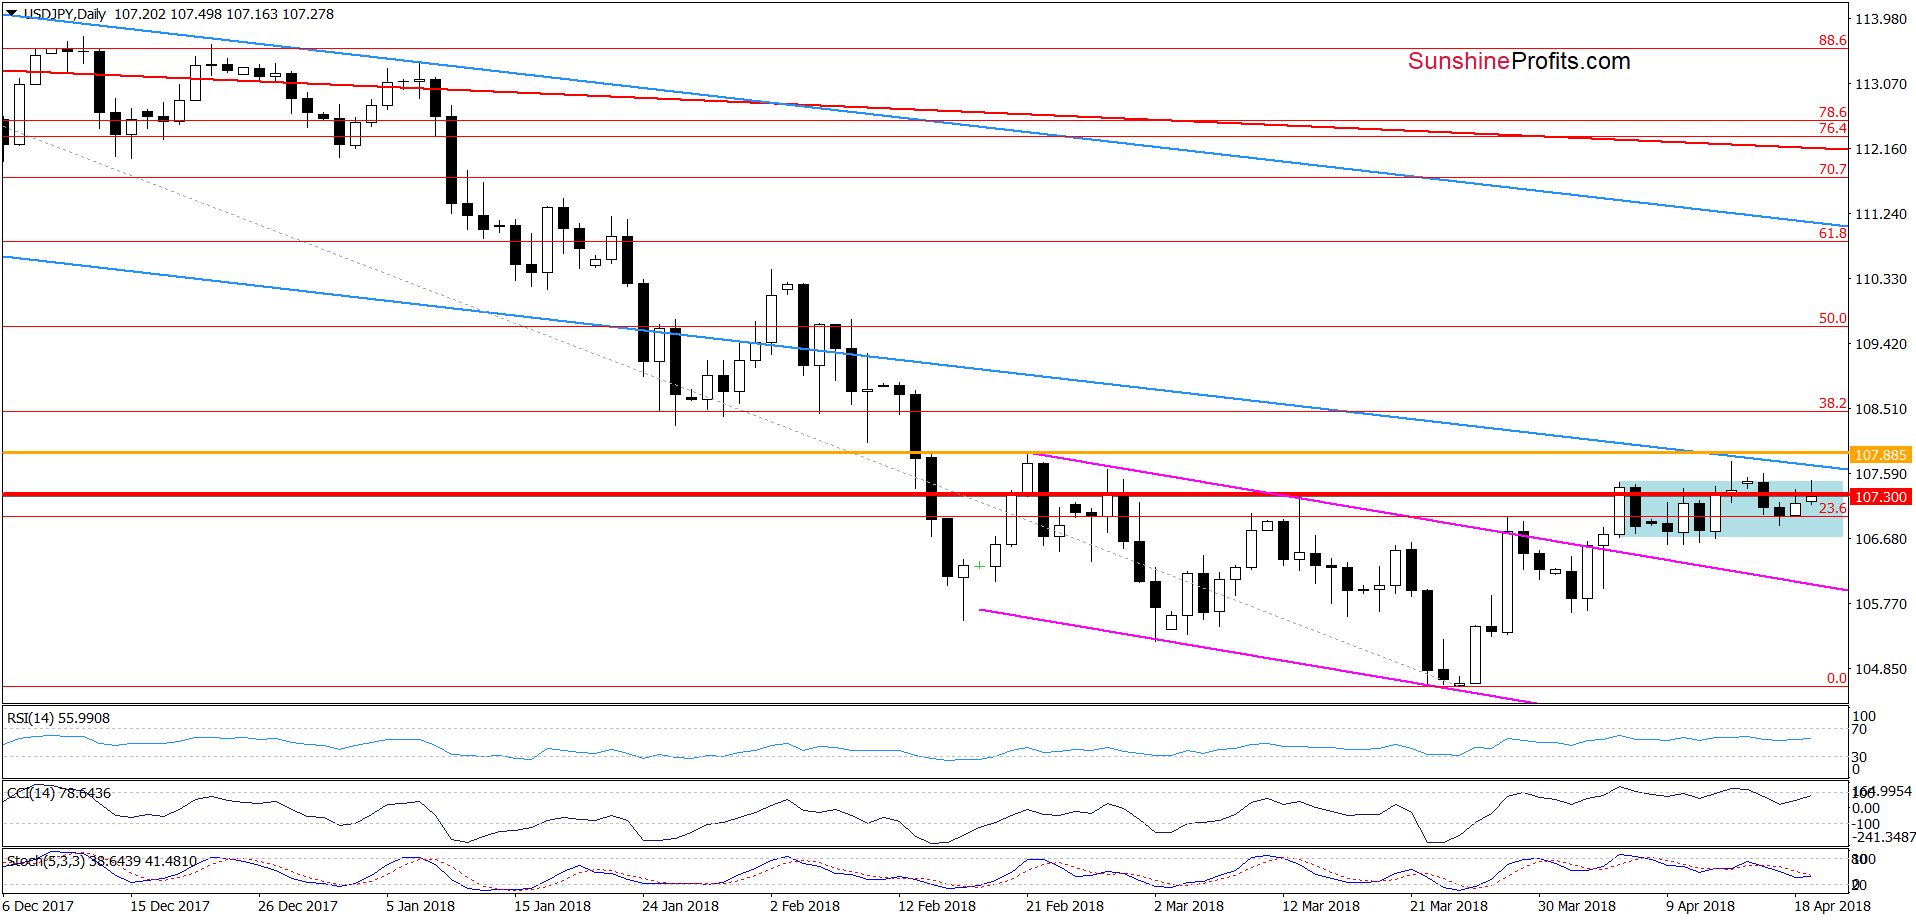
On the daily chart, we see that although USD/JPY rebounded slightly in previous days, the exchange rate remains under the major resistance zone created by the upper border of the blue consolidation, the last week’s peak, the orange resistance line based on the late February high and the previously-broken lower border of the blue declining trend channel.
This suggests that as long as there is no successful breakout above these lines further improvement is questionable and one more reversal can’t be ruled out.
Trading position (short-term; our opinion): No positions are justified from the risk/reward perspective. We will keep you informed should anything change, or should we see a confirmation/invalidation of the above.
USD/CAD
On Friday, we wrote the following:
(…) the strength of sellers may decrease in the following days.
On top of that, the CCI and the Stochastic Oscillator are extremely oversold, which increases the probability of rebound in the very near future.
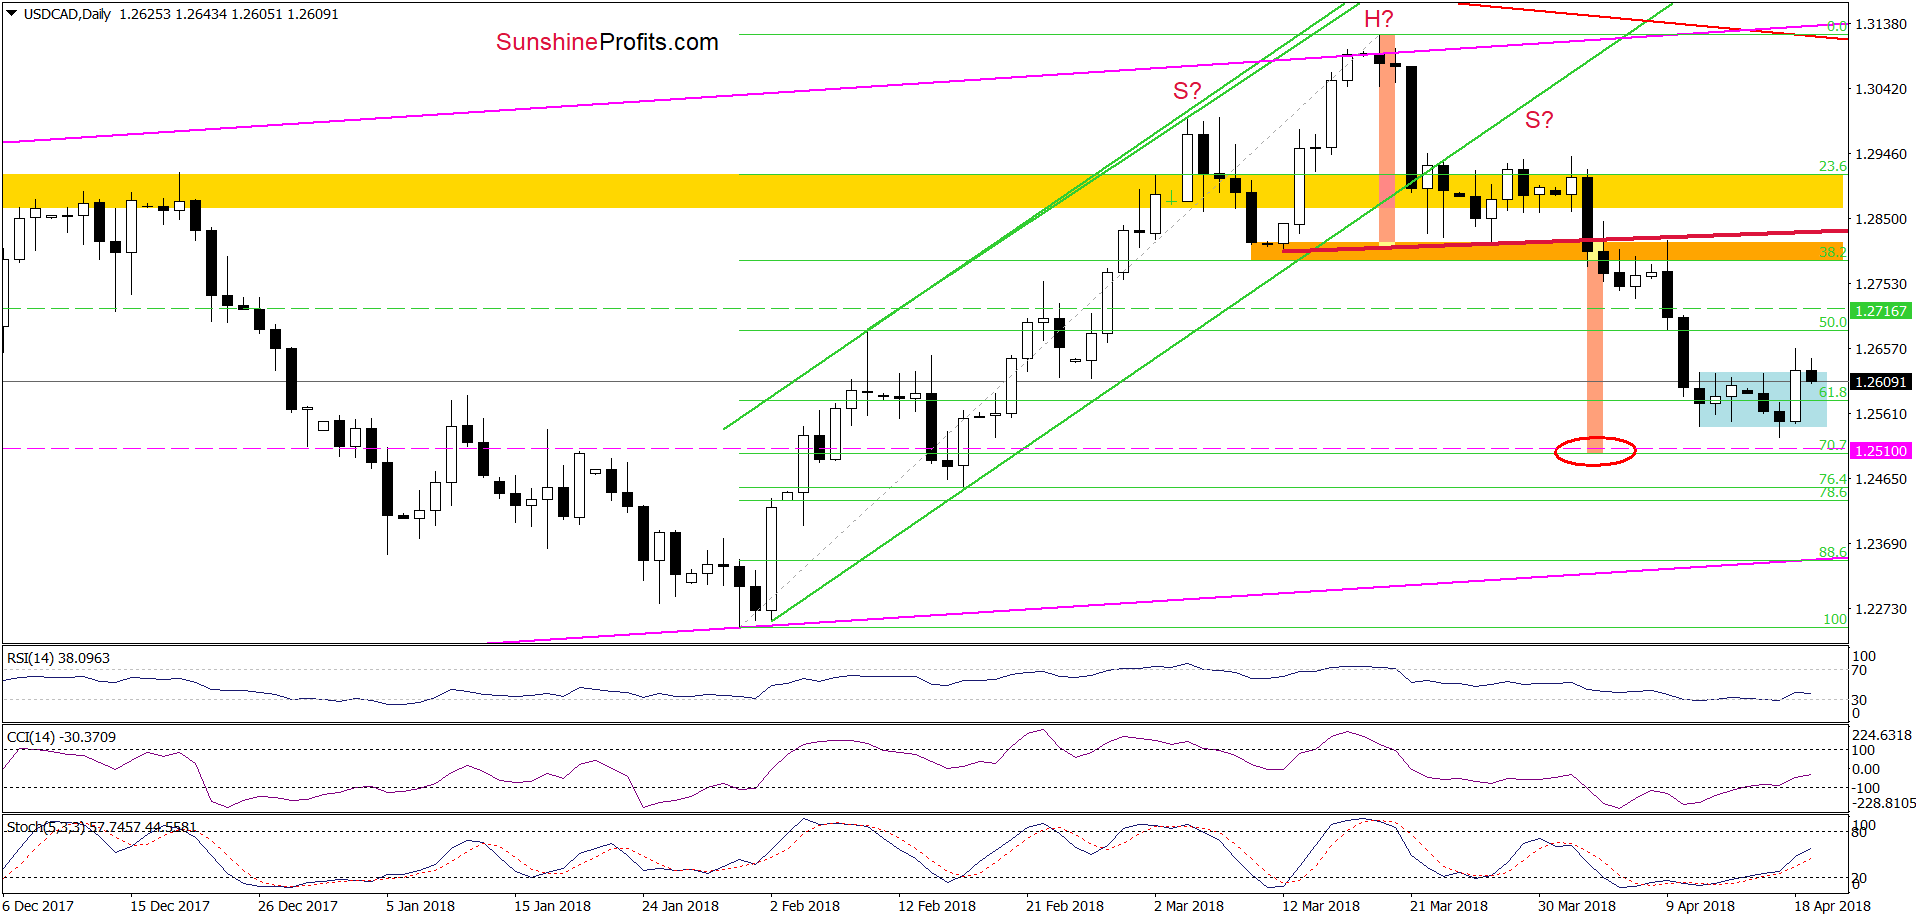
From today’s point of view, we see that the situation developed in line with the above scenario and USD/CAD rebounded quite sharply yesterday. Thanks to Wednesday’s upswing the pair broke above the upper border of the blue consolidation, which in combination with the buy signals generated by the daily indicators looked quite optimistic.
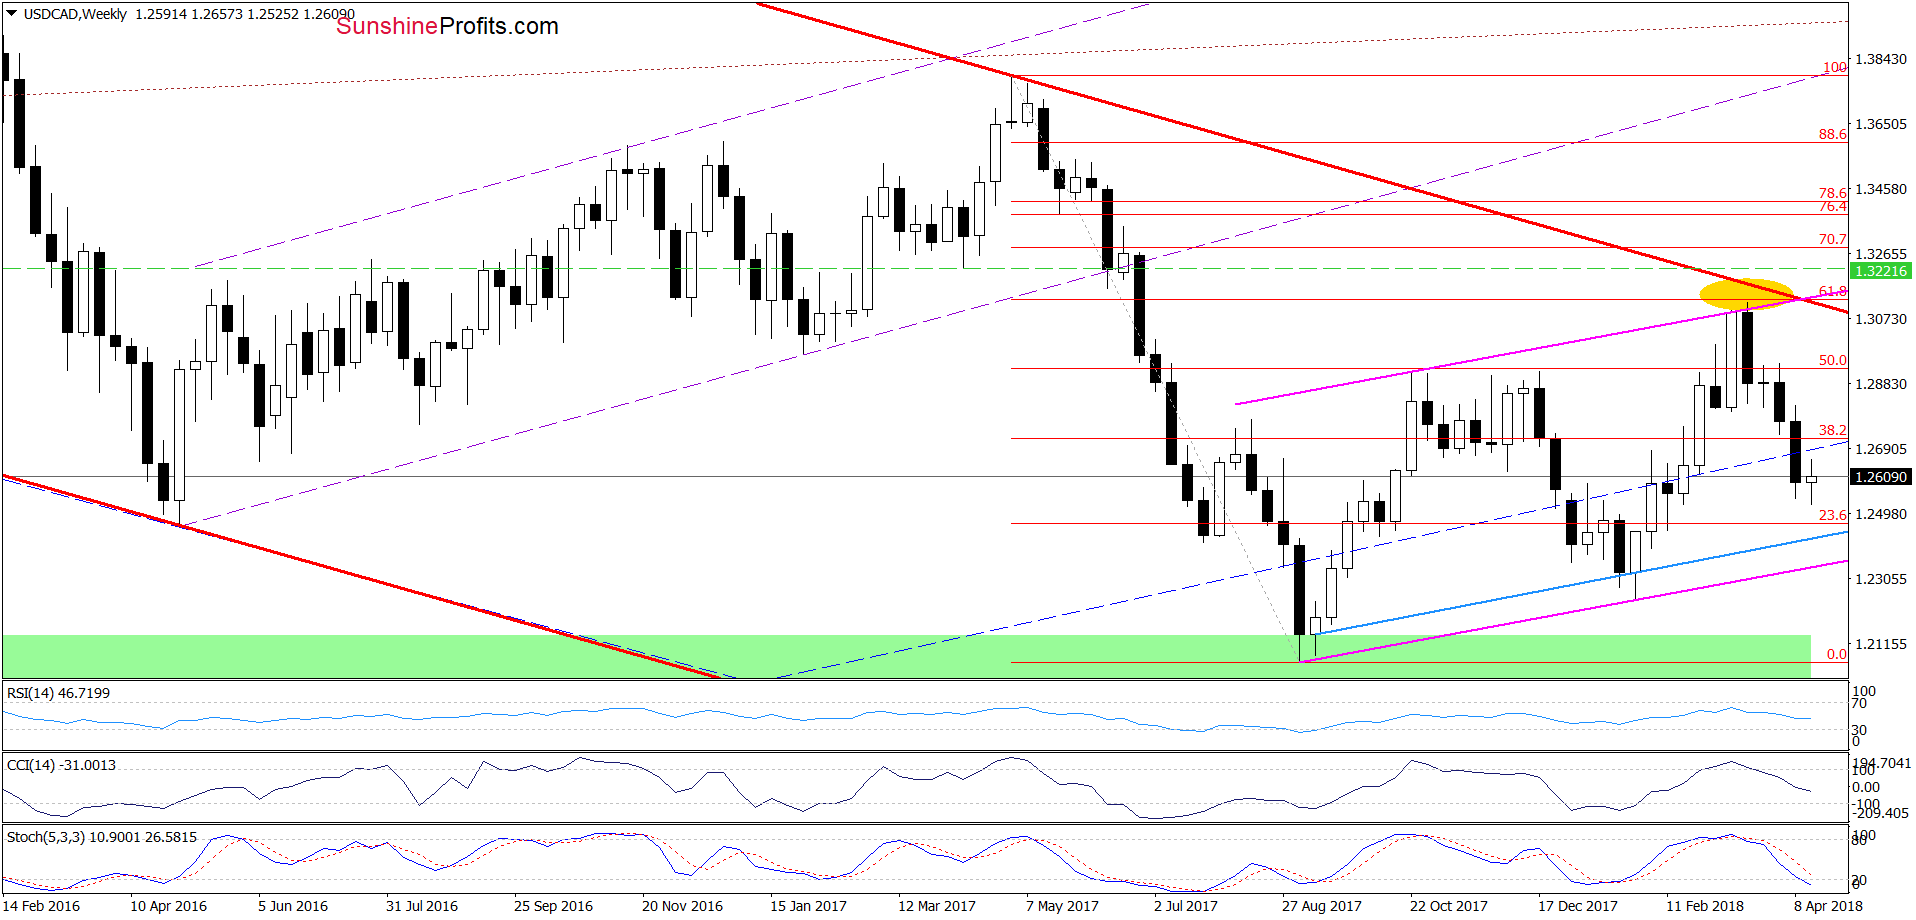
Nevertheless, earlier today currency bears showed their claws once again, which triggered a pullback and invalidation of yesterday’s breakout. Such price action doesn’t bode well for further improvement – especially when we factor in the sell signals generated by the weekly indicators. However, in our opinion, lower values of USD/CAD will be more likely and reliable if the pair closes today’s session inside the blue consolidation.
How low could the exchange rate go if the situation develops in tune with our assumptions? We think that if USD/CAD extends looses from here and comes back under the lower line of the consolidation, we could see a drop to at least 1.2510, where the size of the downward move will correspond to the height of the head and shoulders formation marked on the daily chart above.
Trading position (short-term; our opinion): Profitable short positions with a stop-loss order at 1.2717 and the take profit level at 1.2510 are justified from the risk/reward perspective. We will keep you informed should anything change, or should we see a confirmation/invalidation of the above.
Thank you.
Nadia Simmons
Forex & Oil Trading Strategist
Przemyslaw Radomski, CFA
Founder, Editor-in-chief, Gold & Silver Fund Manager
Gold & Silver Trading Alerts
Forex Trading Alerts
Oil Investment Updates
Oil Trading Alerts

