

Although the British Pound moved sharply higher against the greenback in recent weeks, GBP/USD increased to the very important resistance zone. Will it manage to stop further rally in the coming days?
In our opinion the following forex trading positions are justified - summary:
- EUR/USD: short (a stop-loss order at 1.2250; the initial downside target at 1.1466)
- GBP/USD: none
- USD/JPY: none
- USD/CAD: none
- USD/CHF: none
- AUD/USD: none
EUR/USD
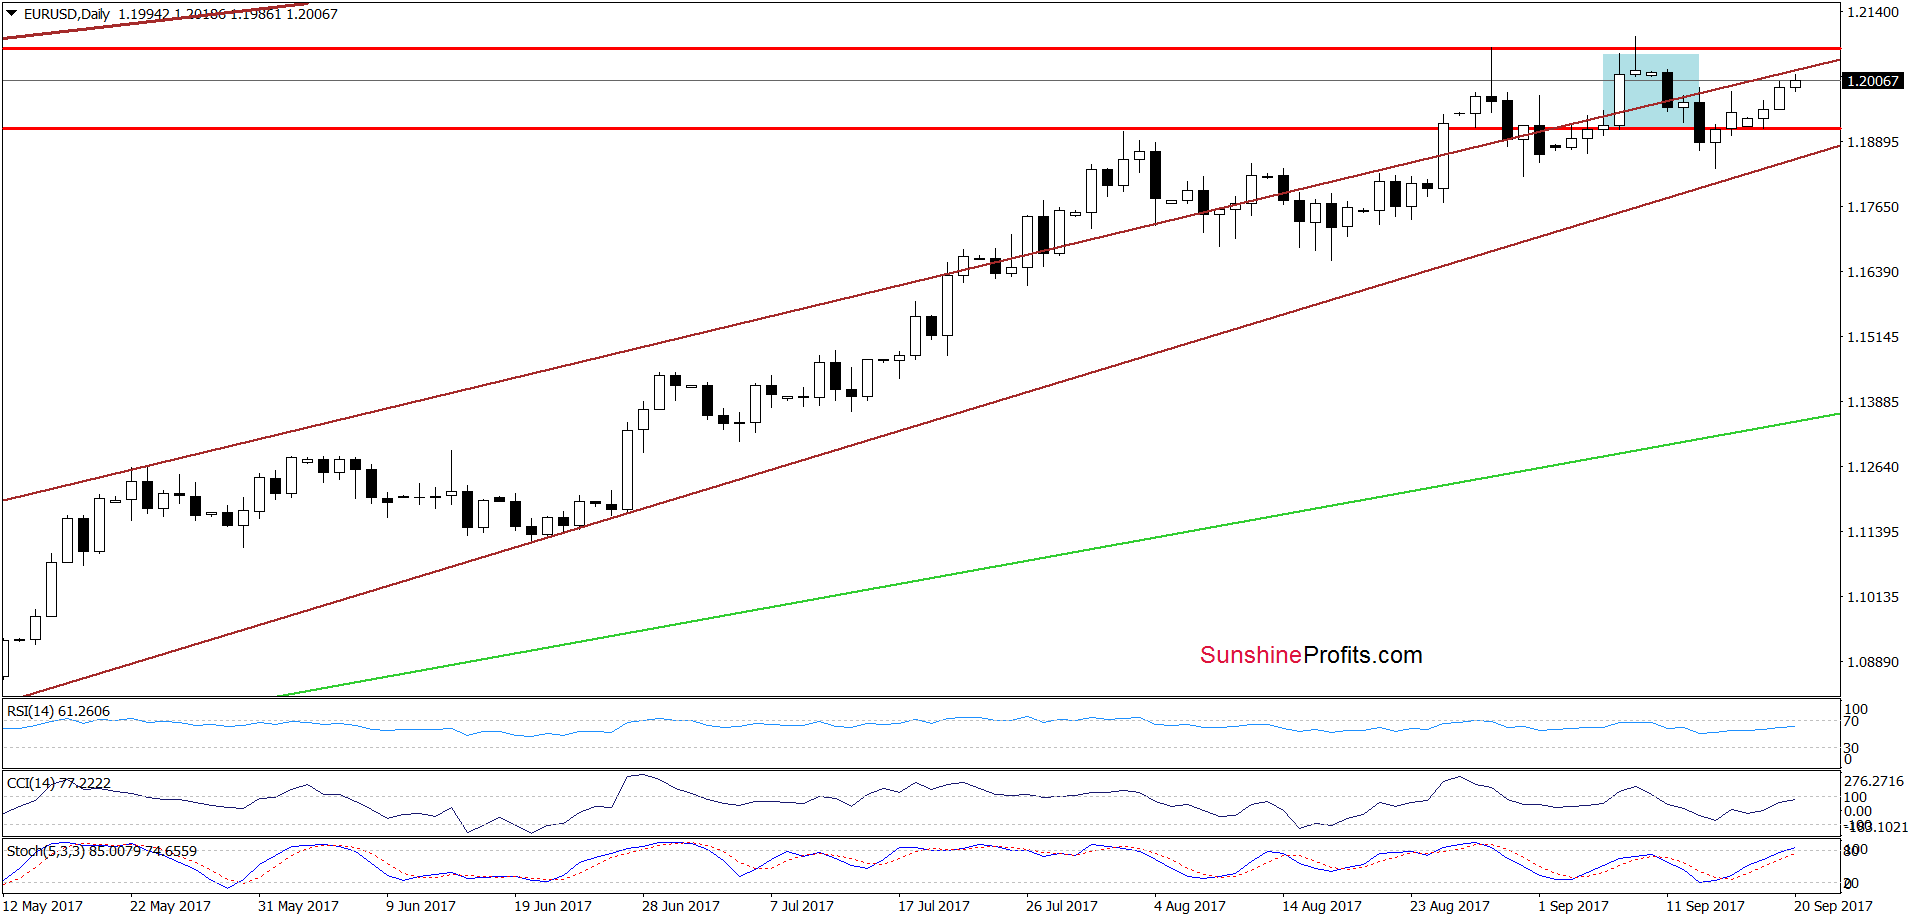
Today’s commentary on this currency pair will be quite short because EUR/USD didn’t do anything that would change the outlook yesterday and the same applies to today’s session so far. Therefore, what we wrote yesterday remains up-to-date also today:
(…) although EUR/USD increased a bit earlier today, the overall situation hasn’t changed much because the exchange rate is still trading under the upper border of the brown rising trend channel. This means that even if the pair extends today’s upswing it could be nothing more than another verification of the earlier breakdown. This scenario is also reinforced by the situation in the long term.
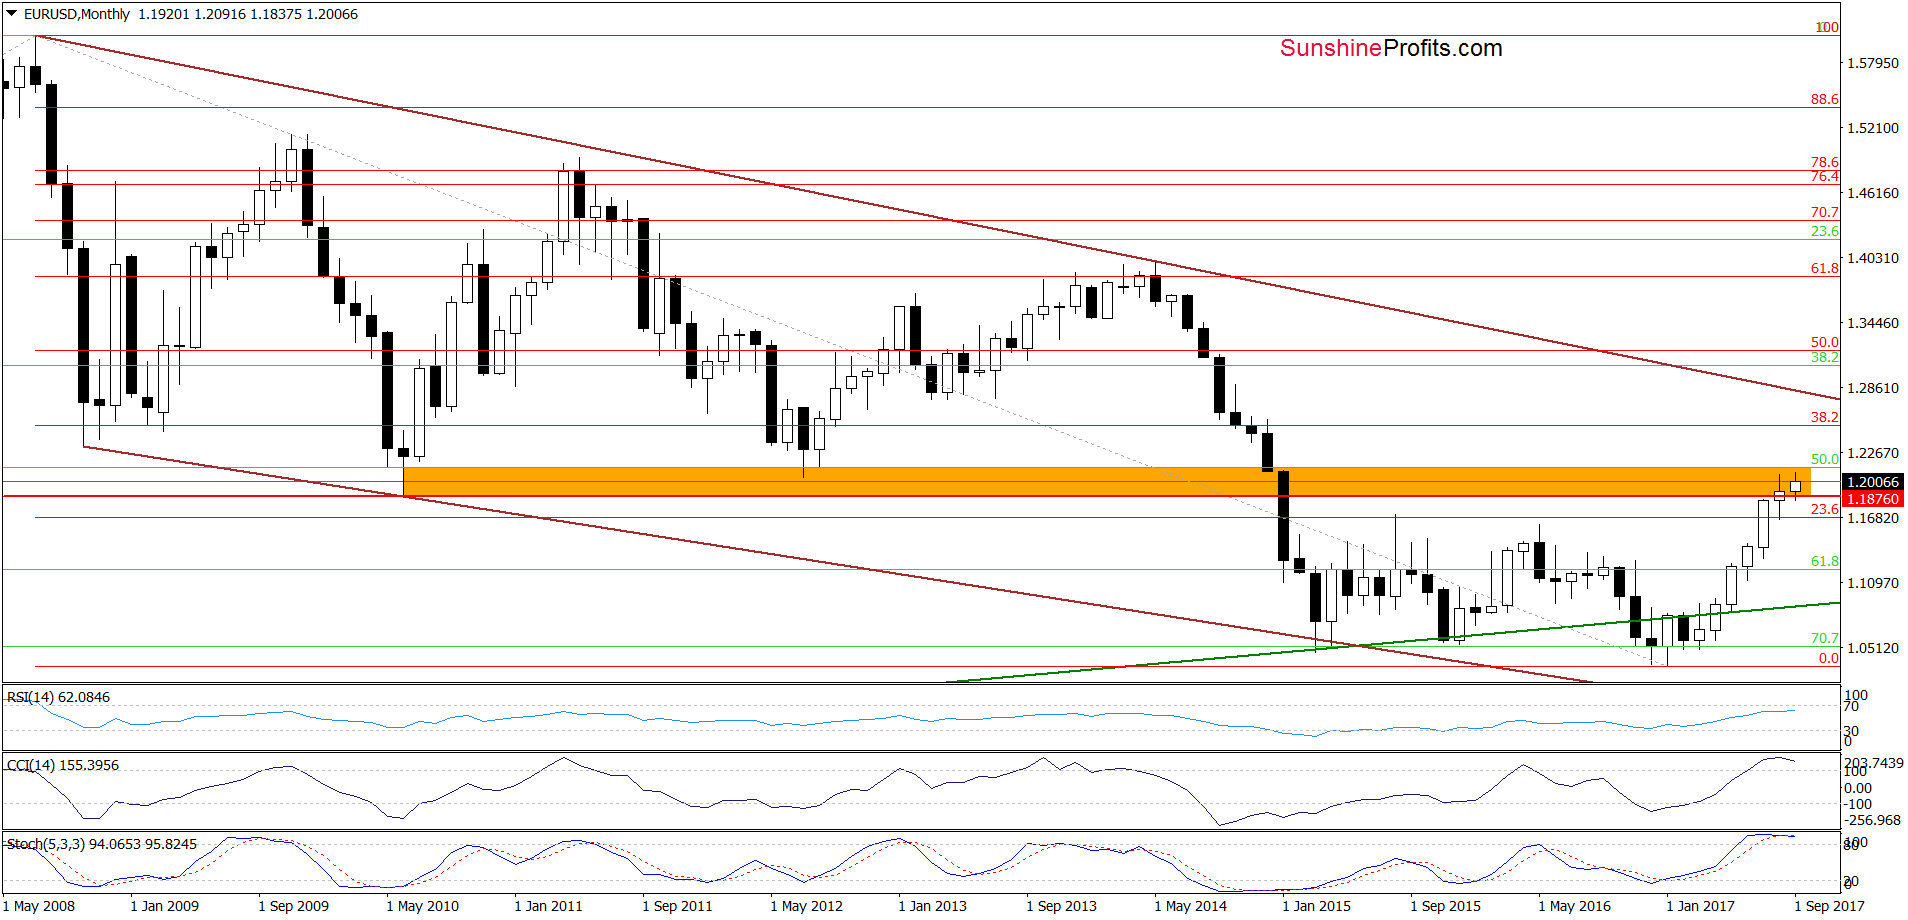
As you see on the monthly chart, EUR/USD remains in the orange resistance zone – below the 2010 and July 2012 lows (in terms of monthly closing prices), which suggests that the 2017 upward move could be a verification of the earlier breakdown below these levels. This scenario is also reinforced by the current position of the long-term indicators – they increased to the highest levels since April 2014. Back then, such high readings of the CCI and Stochastic Oscillator preceded bigger move to the downside, which suggests that we may see a similar price action in the coming week(s). Therefore, even if EUR/USD moves a bit higher in the very short term, we believe that another significant move will be to the downside.
Very short-term outlook: mixed with bearish bias
Short-term outlook: mixed with bearish bias
MT outlook: mixed
LT outlook: mixed
Trading position (short-term; our opinion): Short positions (with a stop-loss order at 1.2250 and the initial downside target at 1.1466) are justified from the risk/reward perspective. We will keep you informed should anything change, or should we see a confirmation/invalidation of the above.
GBP/USD
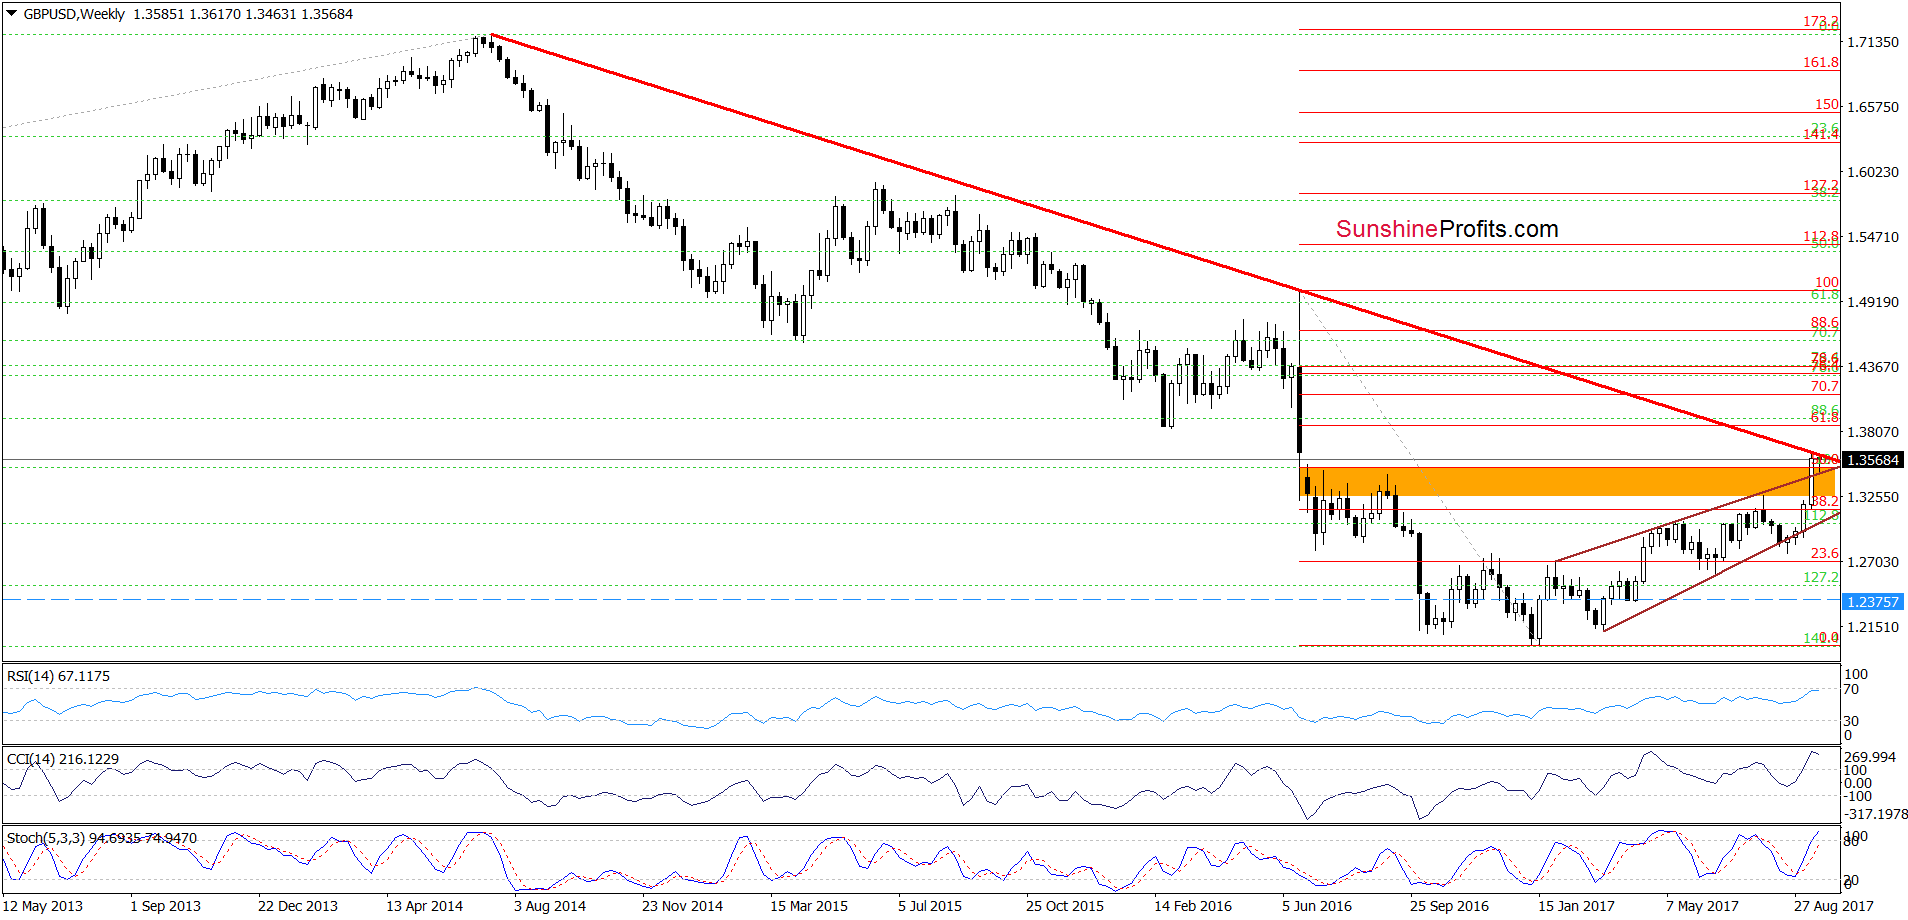
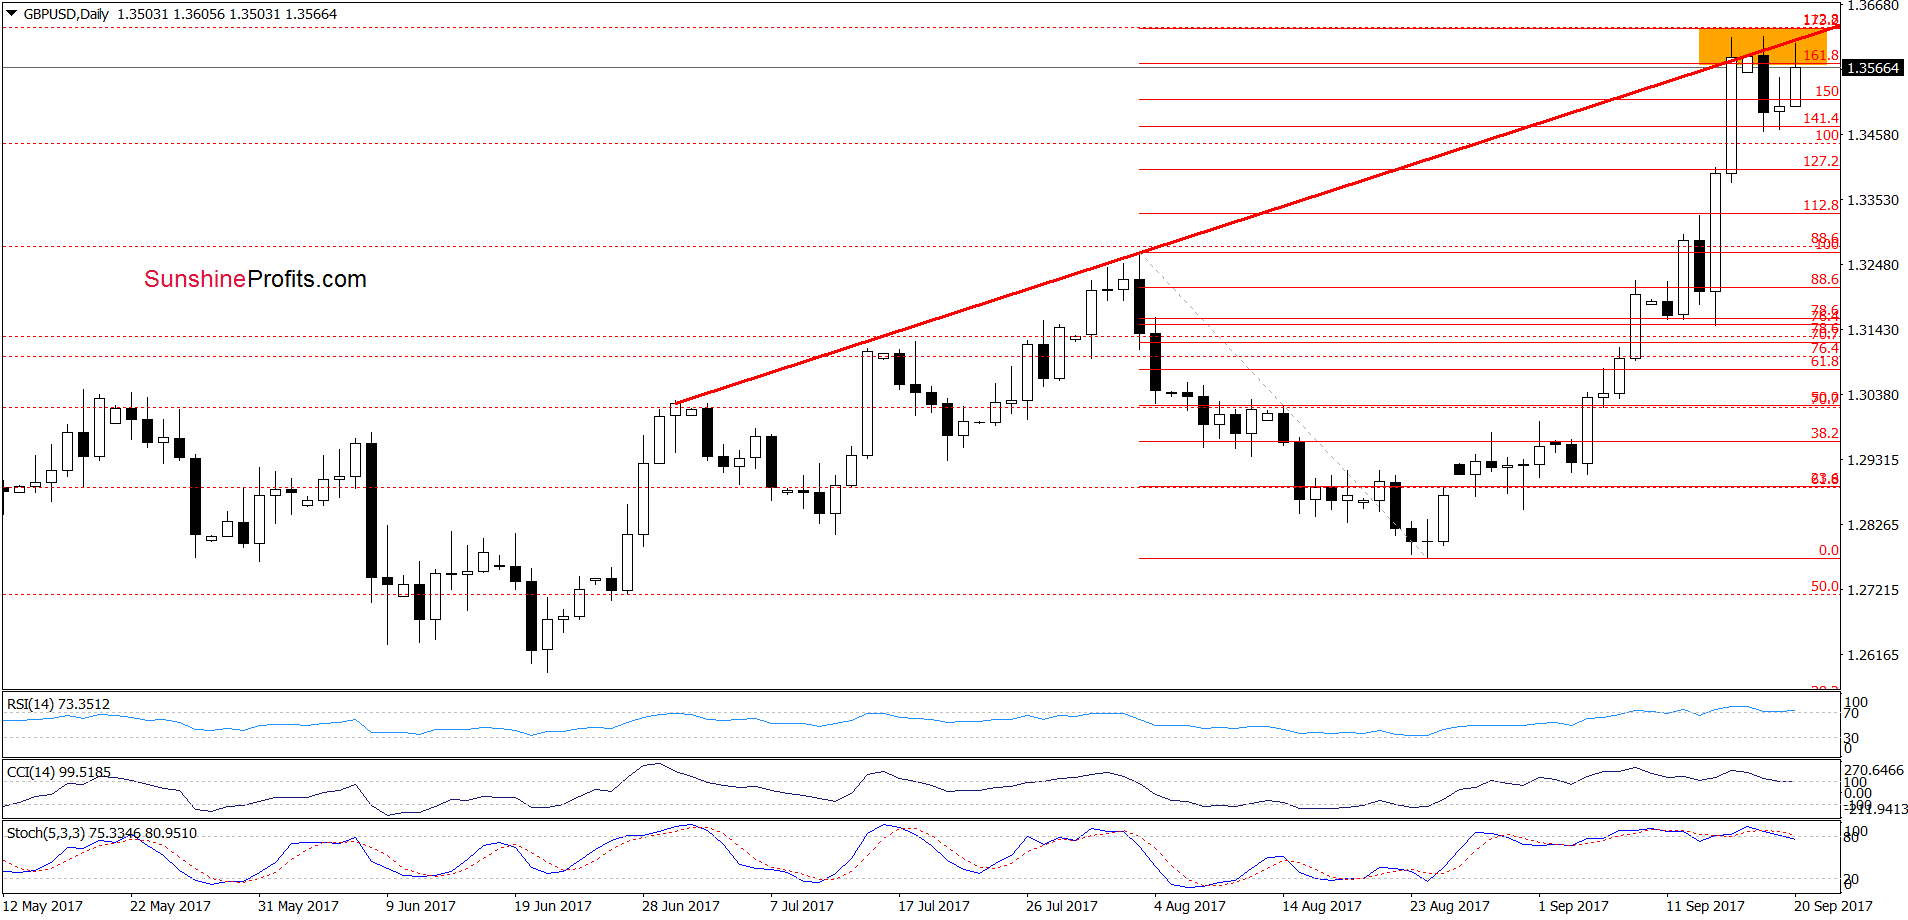
From today’s point of view, we see that recent increases took GBP/USD to very important resistance zone created by the very long-term red declining resistance line based on the July 2014 and June 2016 peaks (marked on the weekly chart), the red increasing resistance line based on the previous highs (seen on the daily chart) and the area between the 161.8% and 173.2% Fibonacci extensions.
Additionally, the CCI and the Stochastic Oscillator generated sell signals (while the RSI is very close to doing the same), increasing the probability of reversal and declines in the coming days. If this is the case and the exchange rate moves lower from current levels, we’ll see a drop to around 1.3266-1.3291, where the 38.2% Fibonacci retracement based on the August-September upward move and the August high are.
Very short-term outlook: mixed with bearish bias
Short-term outlook: mixed with bearish bias
MT outlook: mixed
LT outlook: mixed
Trading position (short-term; our opinion): No positions are justified from the risk/reward perspective. We will keep you informed should anything change, or should we see a confirmation/invalidation of the above.
USD/CHF
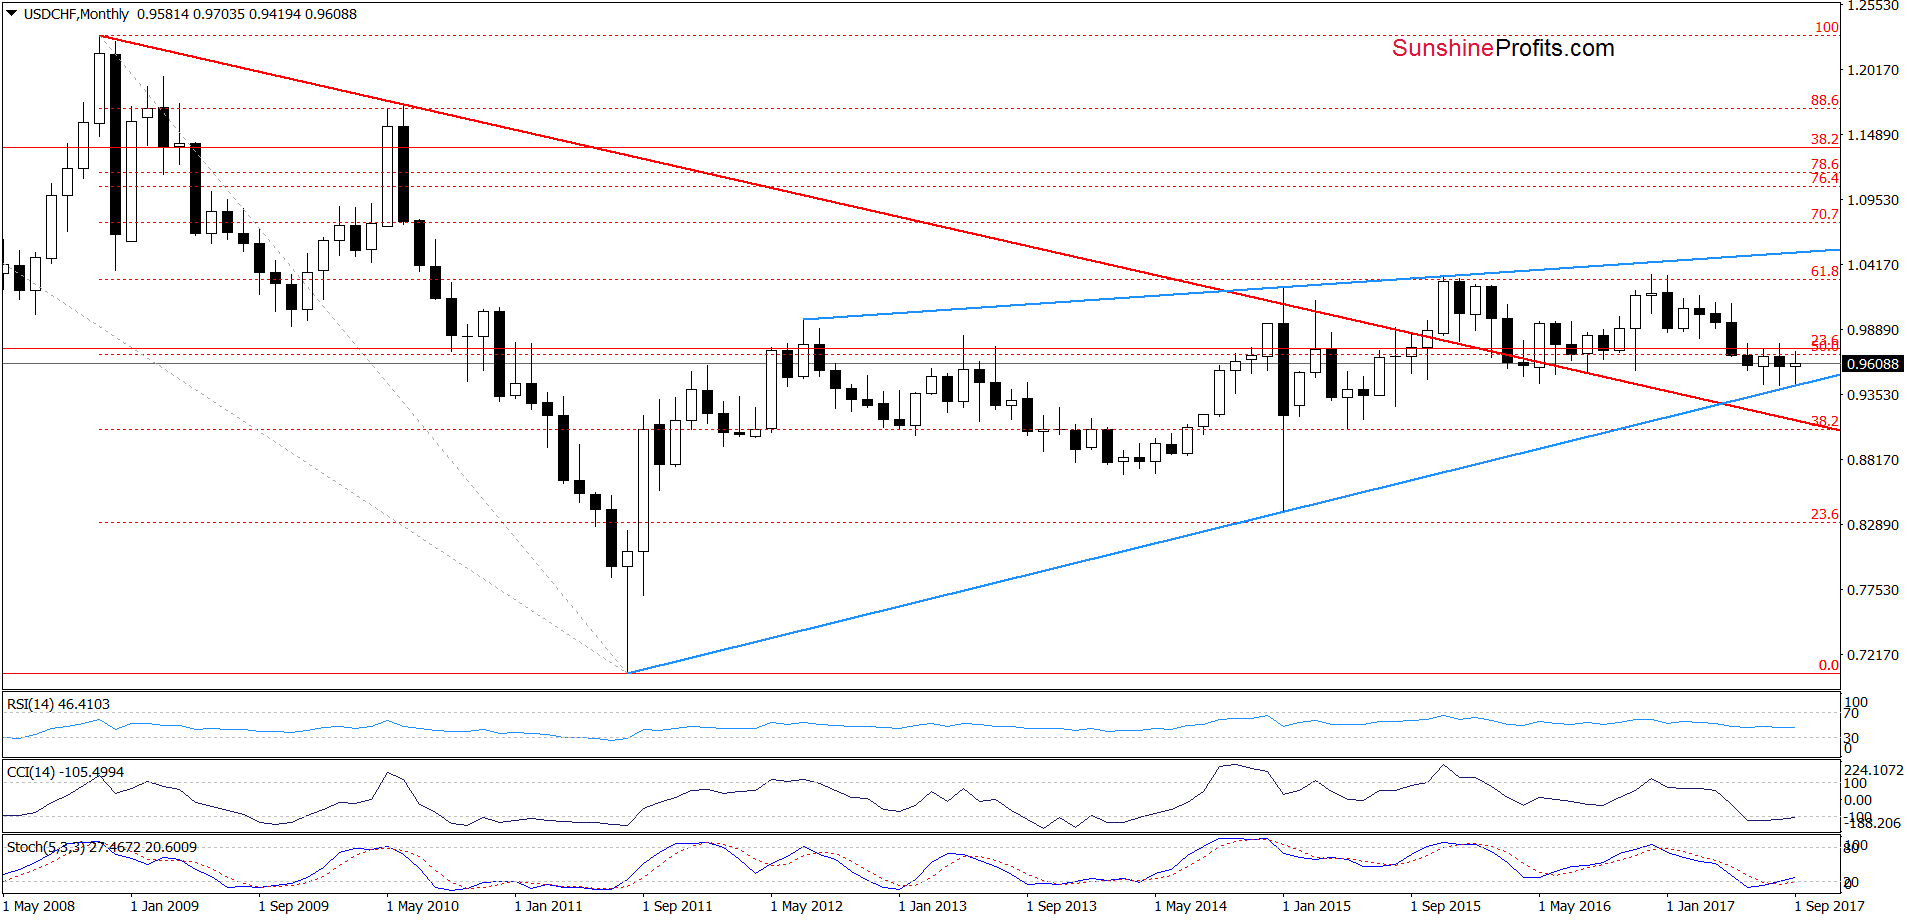
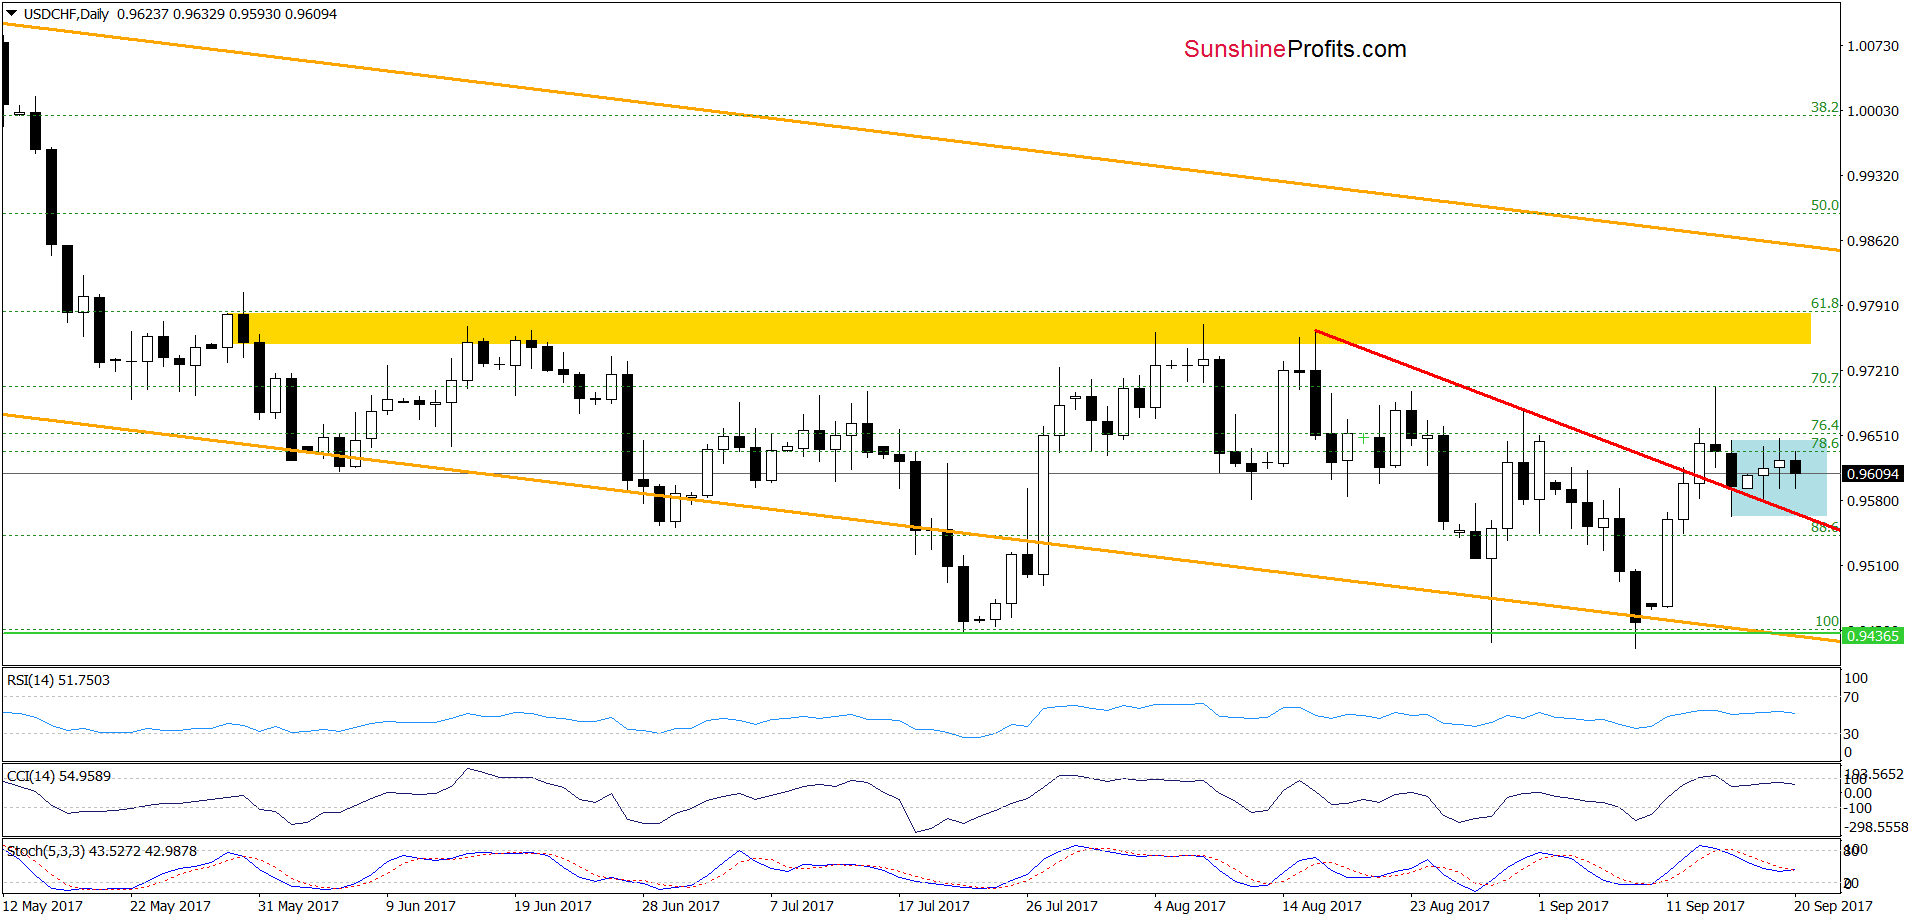
Looking at the charts, we see that although USD/CHF slipped slightly below the previously-broken red line, currency bulls didn’t manage their opponents to push the pair lower. As a result, the exchange rate rebounded, but then stuck in the blue consolidation, which makes the very short-term picture a bit unclear. Nevertheless, in our opinion, as long as there is no daily closure below the red line based on the previous highs a bigger move to the downside is not likely to be seen – especially when we factor in the fact that the very long-term blue support line (marked on the monthly chart) continues to keep declines in check.
Very short-term outlook: mixed
Short-term outlook: mixed
MT outlook: mixed
LT outlook: mixed
Trading position (short-term; our opinion): No positions are justified from the risk/reward perspective at the moment. We will keep you informed should anything change, or should we see a confirmation/invalidation of the above.
Thank you.
Nadia Simmons
Forex & Oil Trading Strategist
Przemyslaw Radomski, CFA
Founder, Editor-in-chief, Gold & Silver Fund Manager
Gold & Silver Trading Alerts
Forex Trading Alerts
Oil Investment Updates
Oil Trading Alerts

