

Last week’s declines took the exchange rate not only below 1.3800, but also encouraged currency bears to test the March low. Are there any technical factors on the horizon, which could stop the sellers in the coming week?
In our opinion the following forex trading positions are justified - summary:
EUR/USD
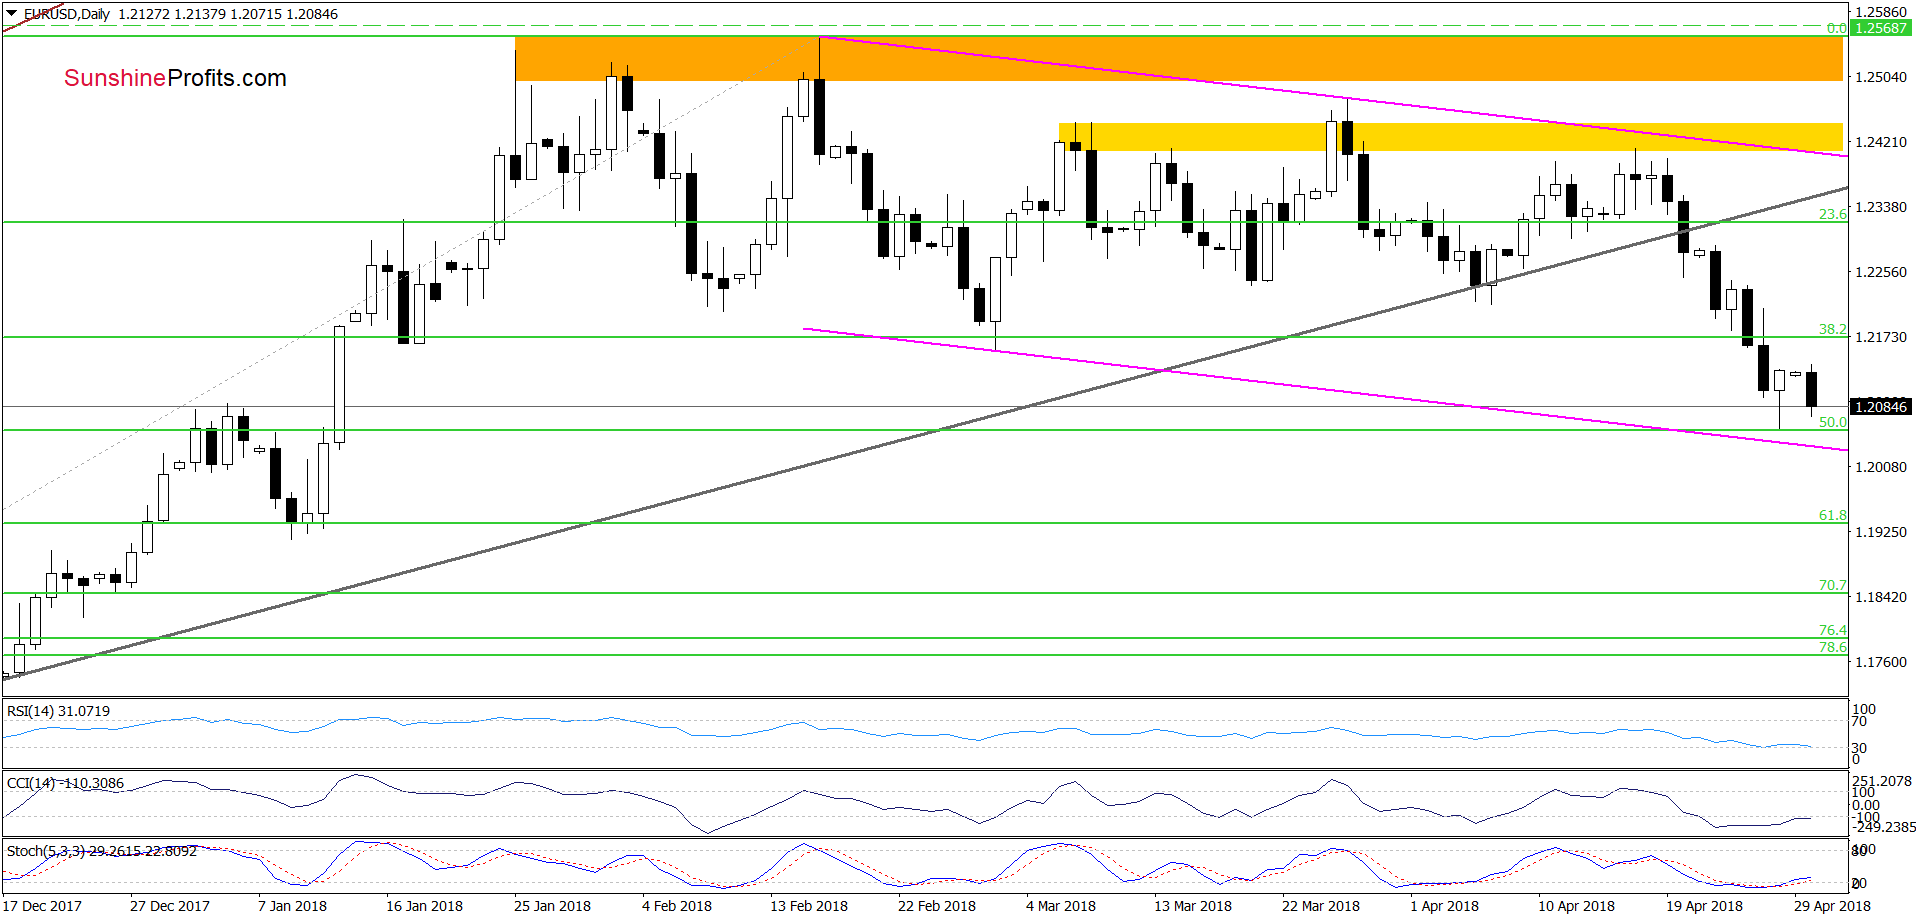
Quoting our Friday’s alert:
The most important event of yesterday’s session was the breakdown under (…) the 38.2% Fibonacci retracement and the March low. This bearish development resulted in a decline, which took the exchange rate to the September 2017 and early January 2018 peaks. This area is also reinforced by the 50% Fibonacci retracement based on the November 2017- February 2018 upward move (…), which suggests that we could see a reversal in this area in the coming day(s).
From today’s point of view, we see that the situation developed in line with the above scenario and the exchange rate bounced off the 50% Fibonacci retracement on Friday. Despite this improvement, currency bears took the pair lower earlier today, which increases the probability of a test of the last week’s low or even the lower border of the purple declining trend channel in the coming day(s).
Trading position (short-term; our opinion): No positions are justified from the risk/reward perspective. We will keep you informed should anything change, or should we see a confirmation/invalidation of the above.
GBP/USD
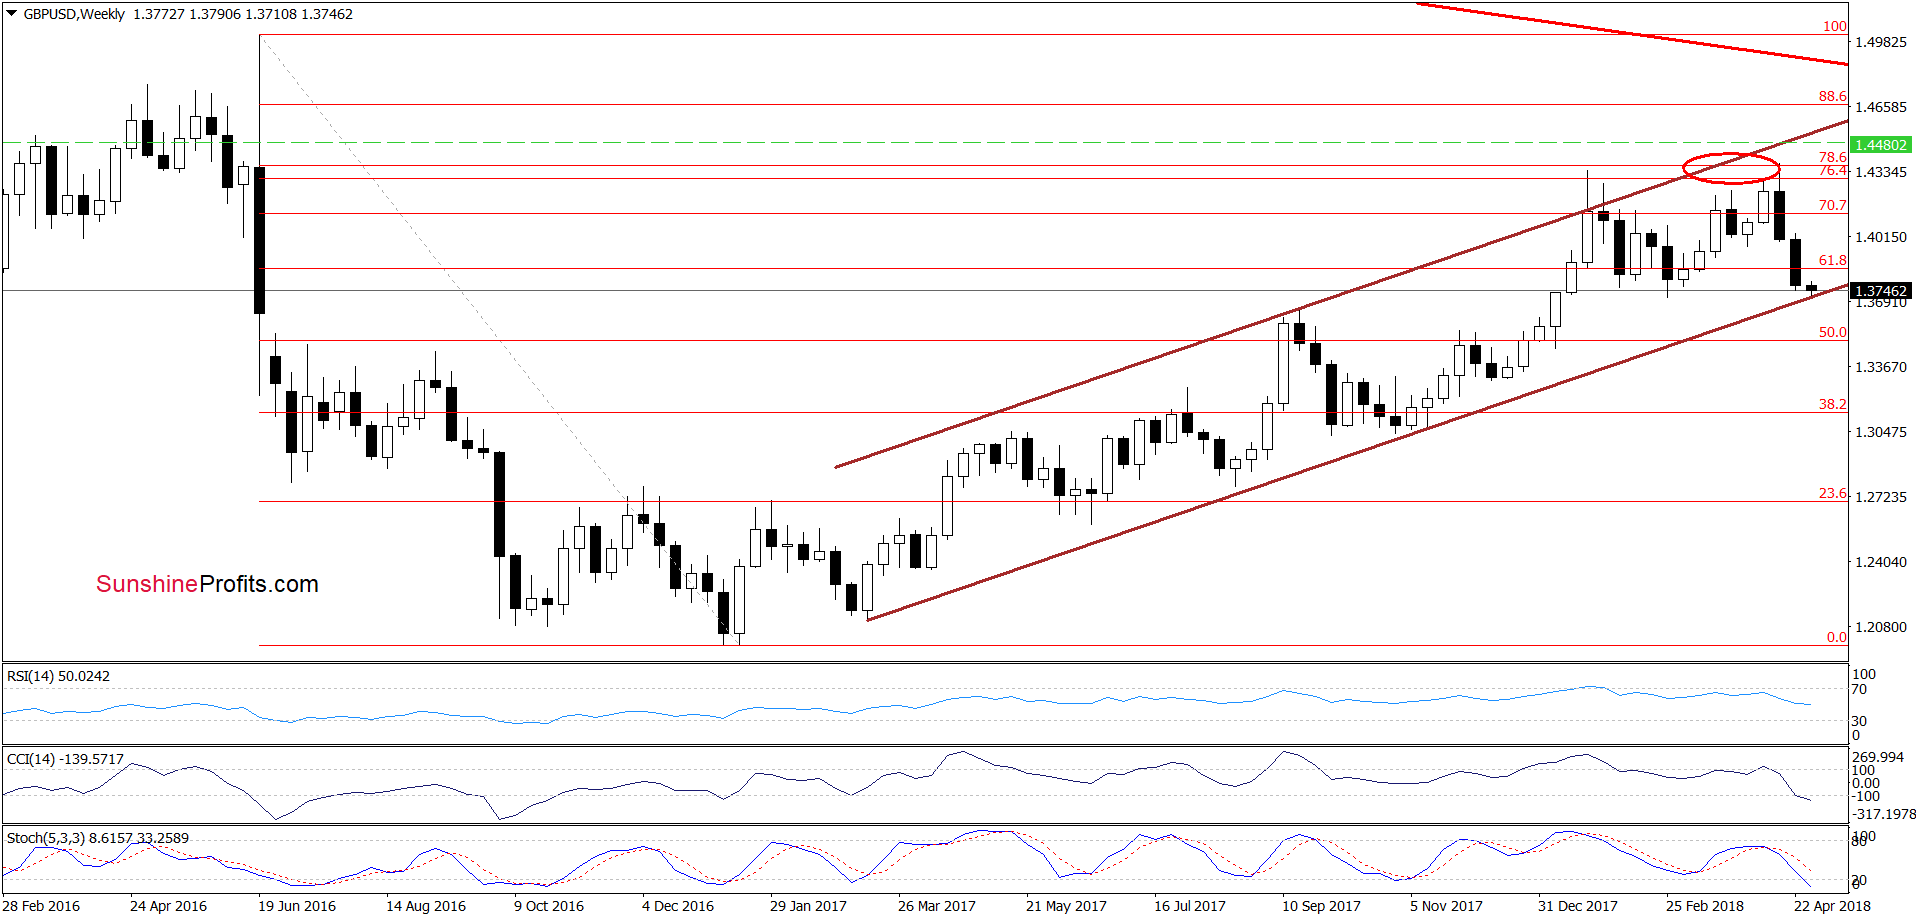
Looking at the charts of GBP/USD we decided to attach the weekly chart, which clearly shows that the exchange rate slipped to important support line – the lower border of the brown rising trend channel.
Taking this fact into account and combining it with the current position of the daily indicators (marked on the very short-term chart below), which are oversold since the beginning of the previous week, we think that reversal is just around the corner and higher values of GBP/USD are just a matter of time.
Trading position (short-term; our opinion): No positions are justified from the risk/reward perspective. We will keep you informed should anything change, or should we see a confirmation/invalidation of the above.
USD/JPY
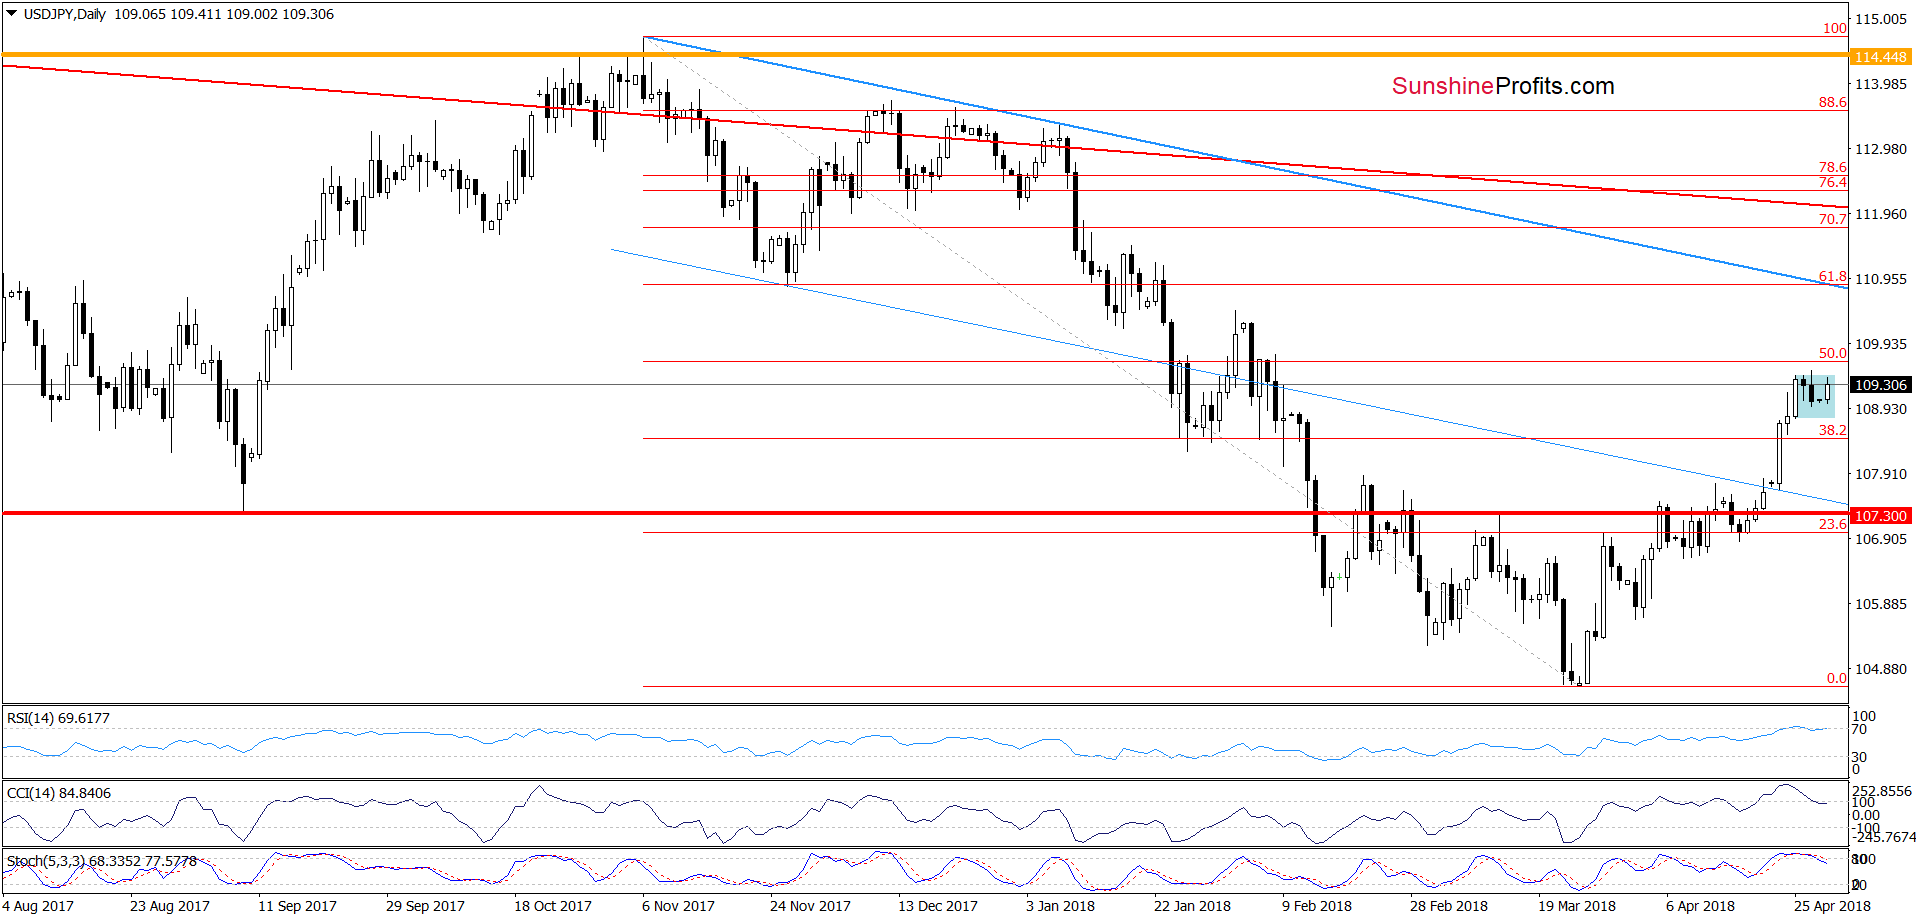
Looking at the daily chart, we see that the overall situation in the very short term hasn’t changed much as USD/JPY is still trading in the blue consolidation. This means that what we wrote on Wednesday remains up-to-date also today:
(…) the pair broke not only above the upper line of the blue consolidation and the September 2017 low, but also above the previously-broken lower border of the blue declining trend channel and the 38.2% Fibonacci retracement. Such price action suggests that we can see one more upswing and a test of the 50% retracement around 109.66 in the coming days.
Trading position (short-term; our opinion): No positions are justified from the risk/reward perspective. We will keep you informed should anything change, or should we see a confirmation/invalidation of the above.
Thank you.
Nadia Simmons
Forex & Oil Trading Strategist
Przemyslaw Radomski, CFA
Founder, Editor-in-chief, Gold & Silver Fund Manager
Gold & Silver Trading Alerts
Forex Trading Alerts
Oil Investment Updates
Oil Trading Alerts

