

Although the British pound increased against the greenback earlier this week, currency bulls didn’t manage to break above the long-term resistance zone. Will history repeat itself once again in this area?
In our opinion the following forex trading positions are justified - summary:
- EUR/USD: short (a stop-loss order at 1.2250; the initial downside target at 1.1510)
- GBP/USD: short (a stop-loss order at 1.3773; the next downside target at 1.3000)
- USD/JPY: none
- USD/CAD: none
- USD/CHF: none
- AUD/USD: none
EUR/USD
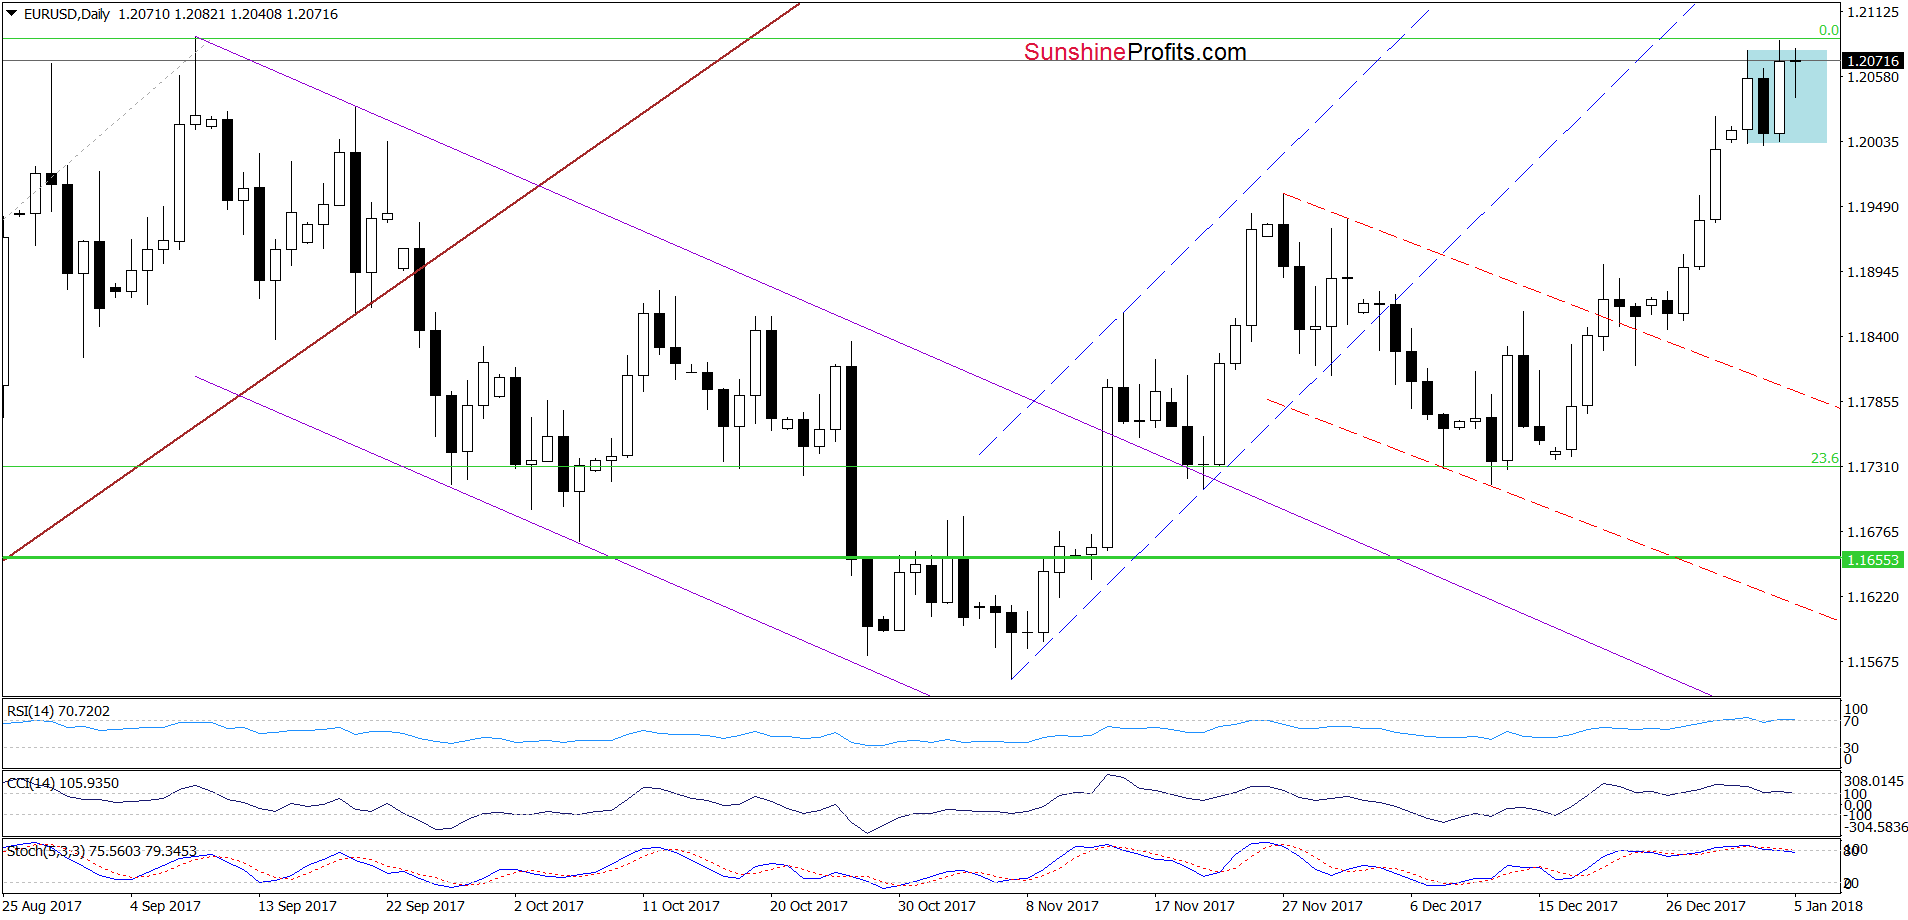
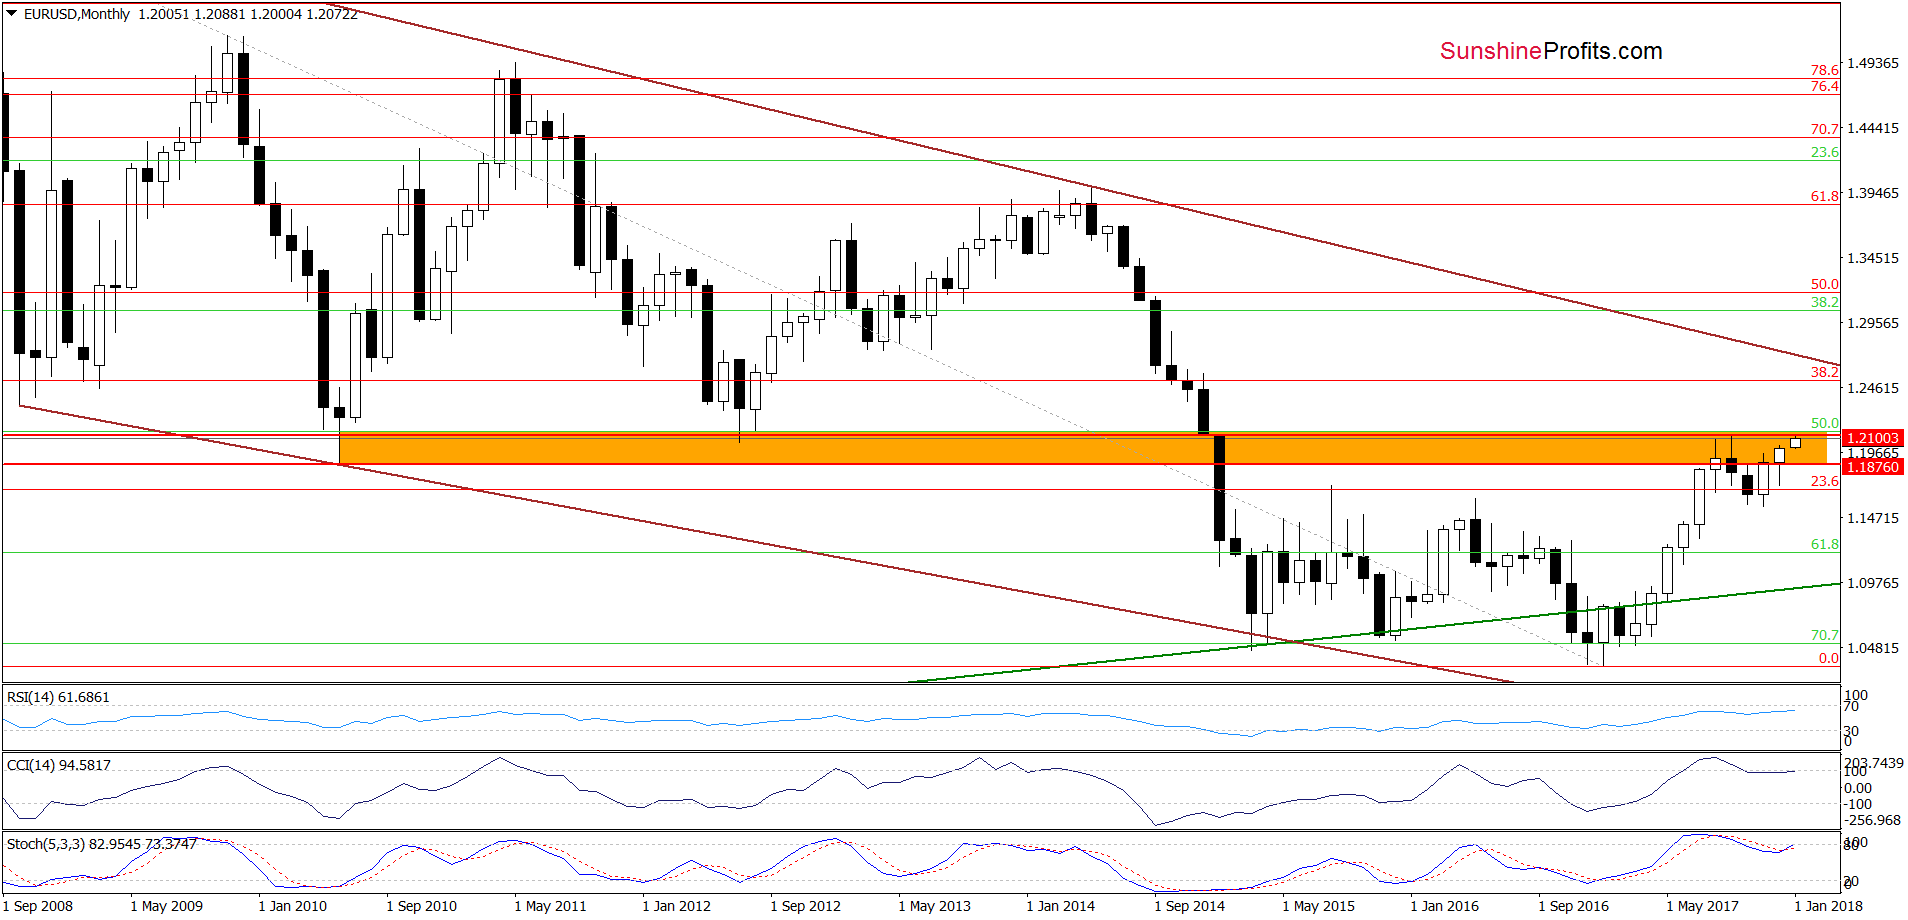
From today’s point of view, we see that although EUR/USD rebounded yesterday, the overall situation in the short term hasn’t changed much as the exchange rate remains below September peak. Earlier today, the pair wavered between small gains and losses, but still below yesterday’s high, which suggests that another pullback is just around the corner – especially when we factor in the current position of the daily indicators (the Stochastic Oscillator generated the sell signal, while the RSI and CCI are very close to doing the same) and the orange resistance zone (marked on the long-term chart below).
Trading position (short-term; our opinion): short positions (with a stop-loss order at 1.2250 and the initial downside target at 1.1510) continue to be justified from the risk/reward perspective. We will keep you informed should anything change, or should we see a confirmation/invalidation of the above.
GBP/USD
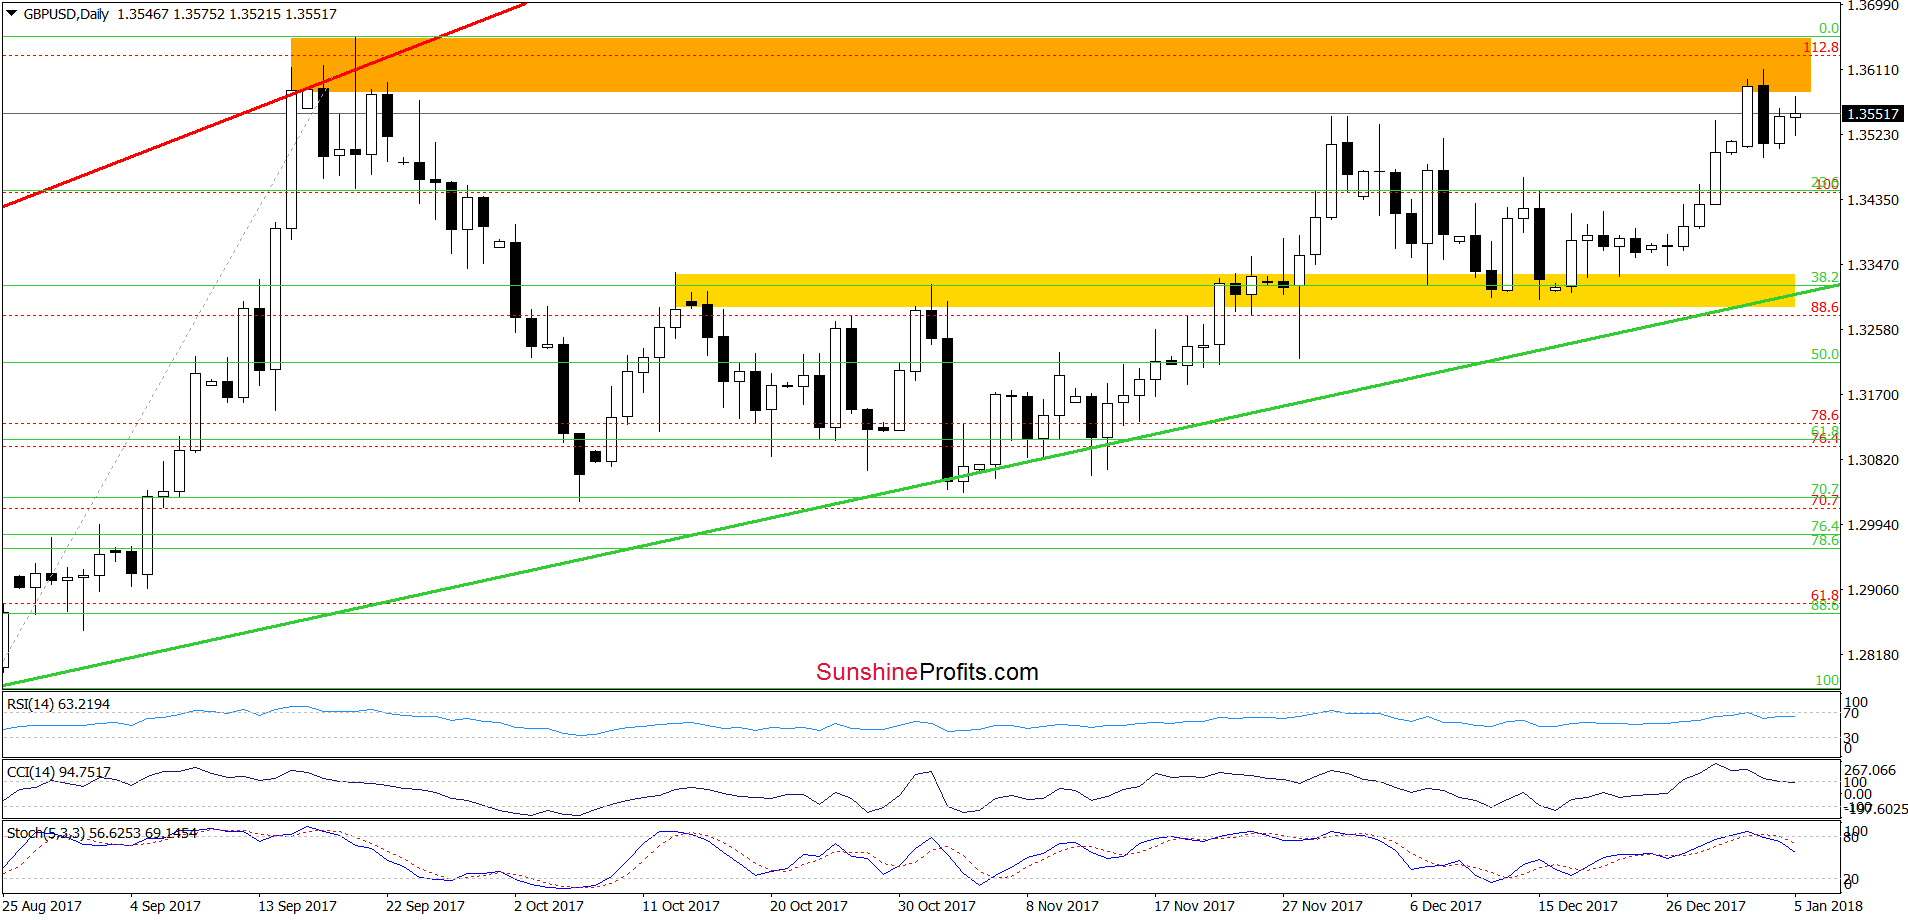
On the daily chart, we see that the situation remains almost unchanged as the orange resistance zone created by the September highs continue to block the way to the north (similarly to what we saw in the case of EUR/USD). Earlier today, the pair increased a bit, but still remains between Wednesday’s high and low, which suggests currency bulls’ weakness. Additionally, all indicators generated the sell signals, increasing the probability of a bigger move to the south in the coming days. The pro bearish scenario is also reinforced by one more technical factor seen n the weekly chart below.
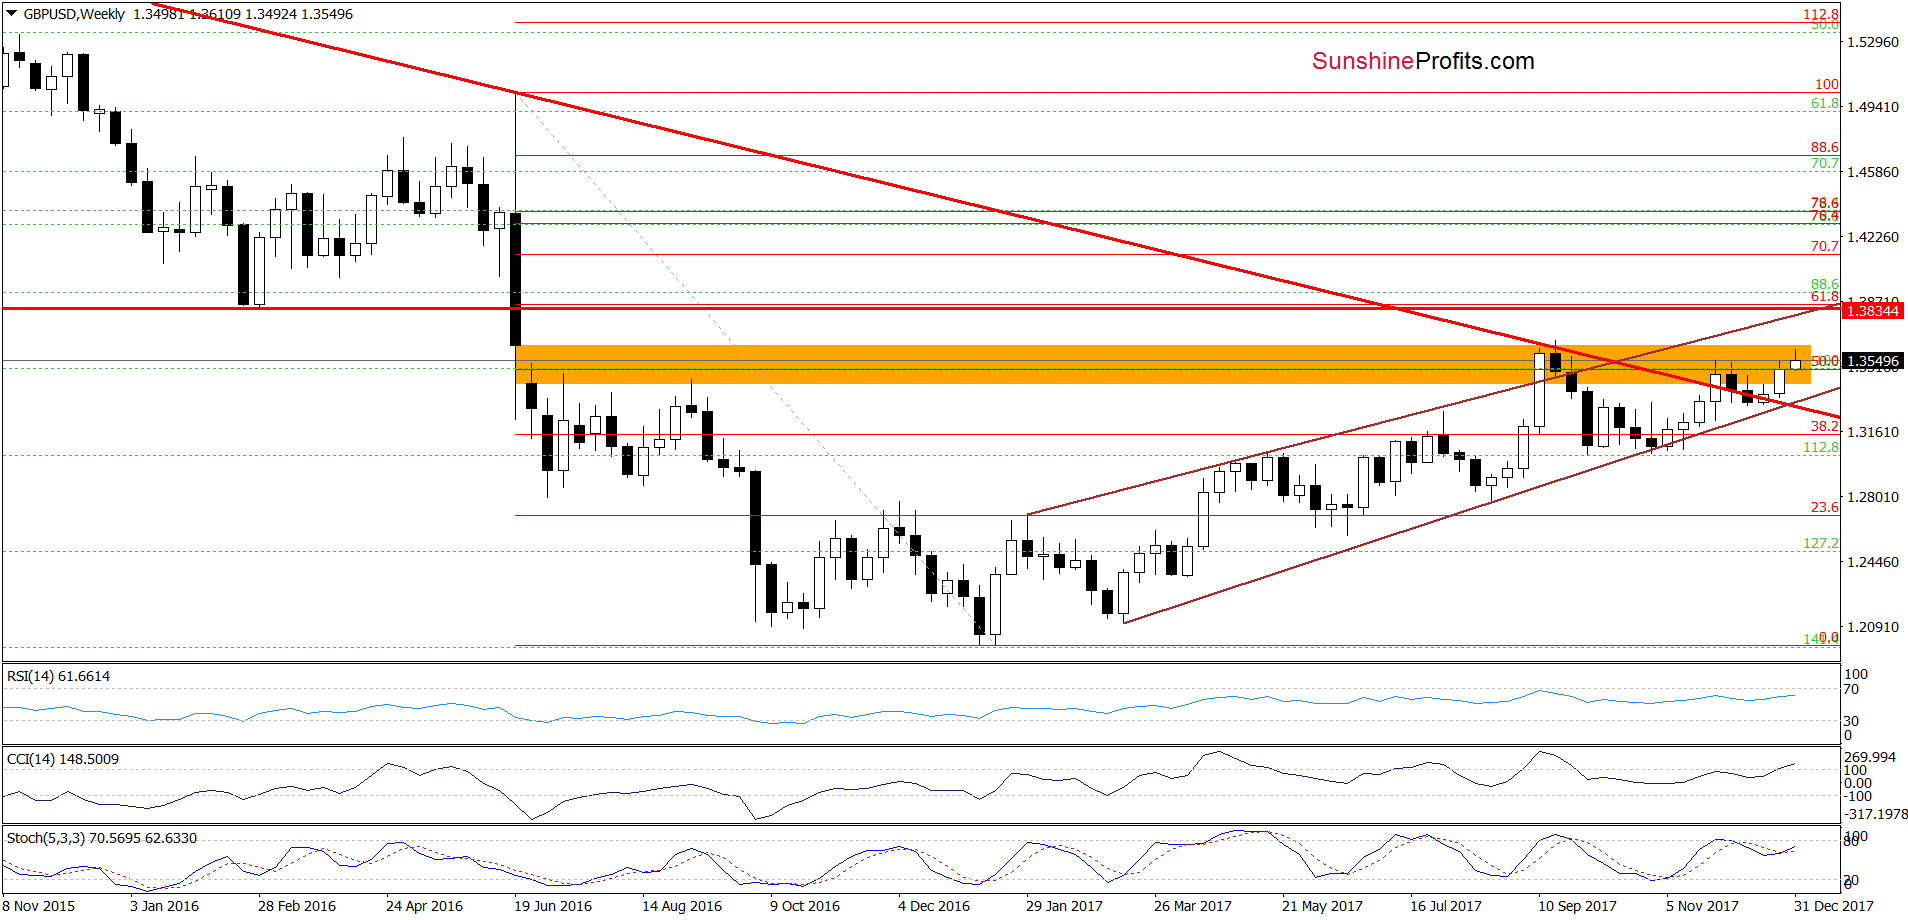
On the medium-term chart, we see that not far from current levels is also the upper border of the orange gap created in June 2016, which serves as the nearest resistance. As you see on the above chart, currency bulls tried to break above it in September, but they failed, which resulted in a bigger correction. Taking this fact into account and combining it with the short-term picture of GBP/USD, we think that another bigger move to the downside is just around the corner.
If this is the case and the exchange rate declines from current levels, the first downside target for currency bears will be around 1.3300-1.3335, where the yellow zone (which serves as the nearest support) marked on the daily chart is.
Trading position (short-term; our opinion): short positions (with a stop-loss order at 1.3773 and the next downside target at 1.3000) continue to be justified from the risk/reward perspective. We will keep you informed should anything change, or should we see a confirmation/invalidation of the above.
USD/CHF
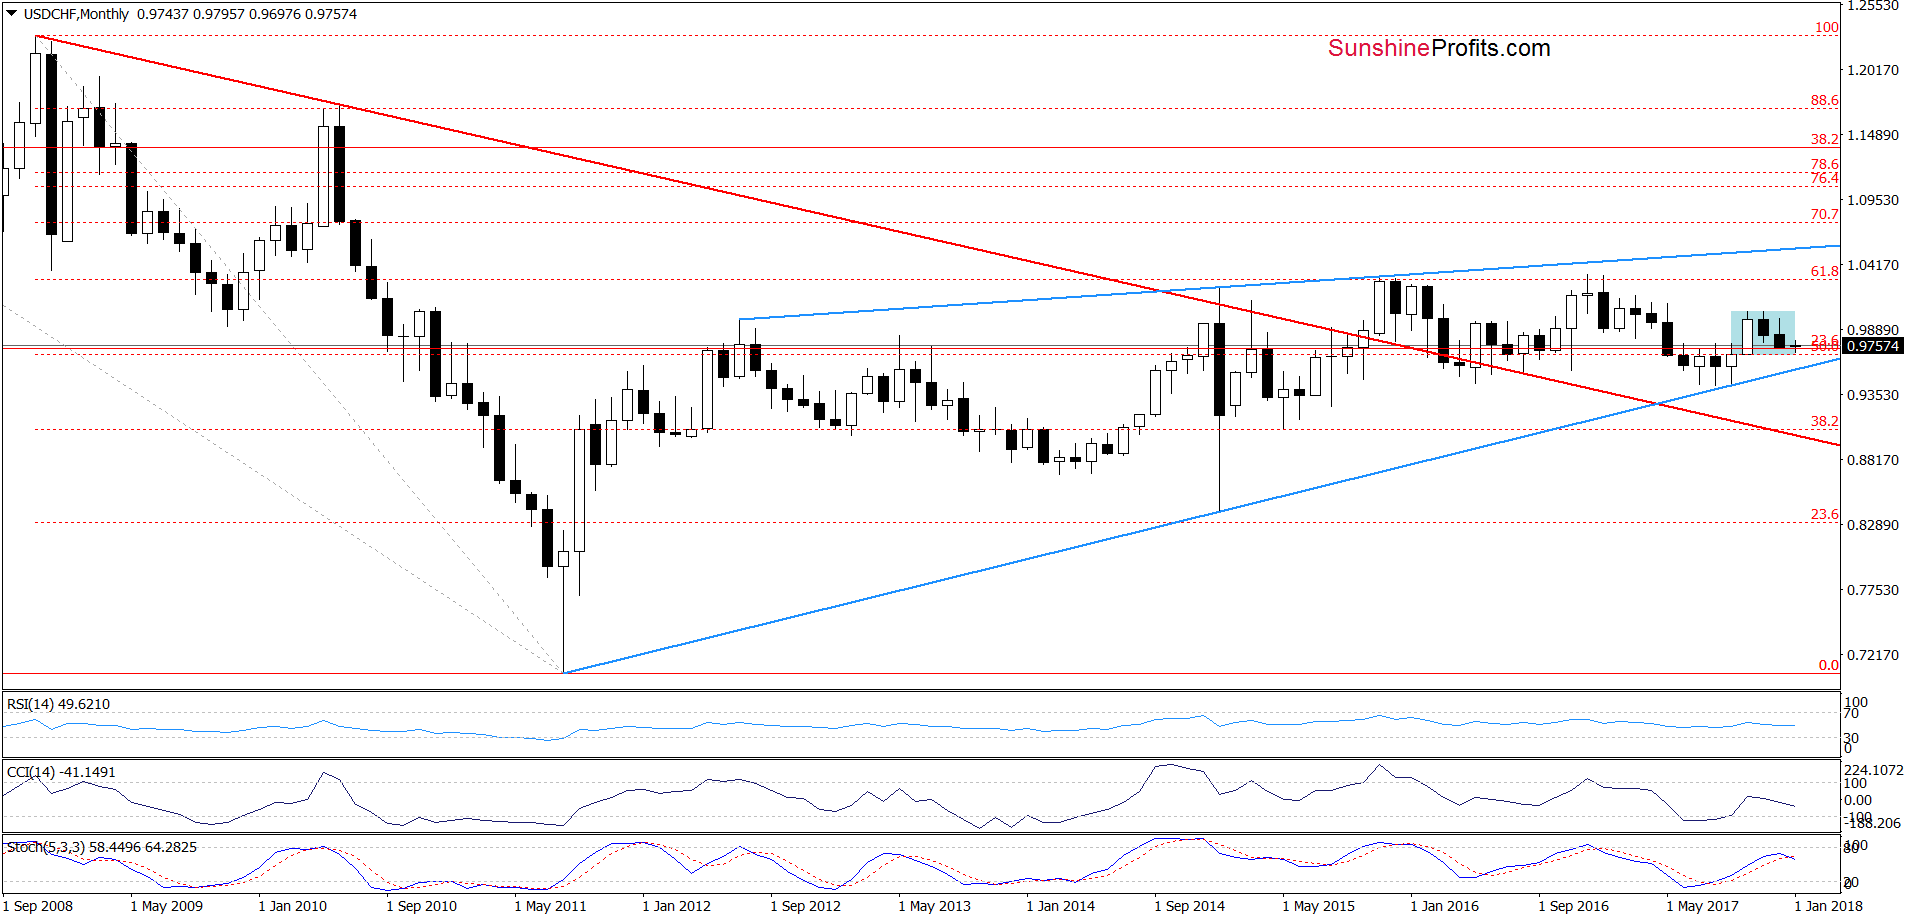
The overall situation in the brroader perspective hasn’t changed much as USD/CHF is still trading in the blue consolidation.
Will the daily chart give us more clues about future moves? Let’s check.
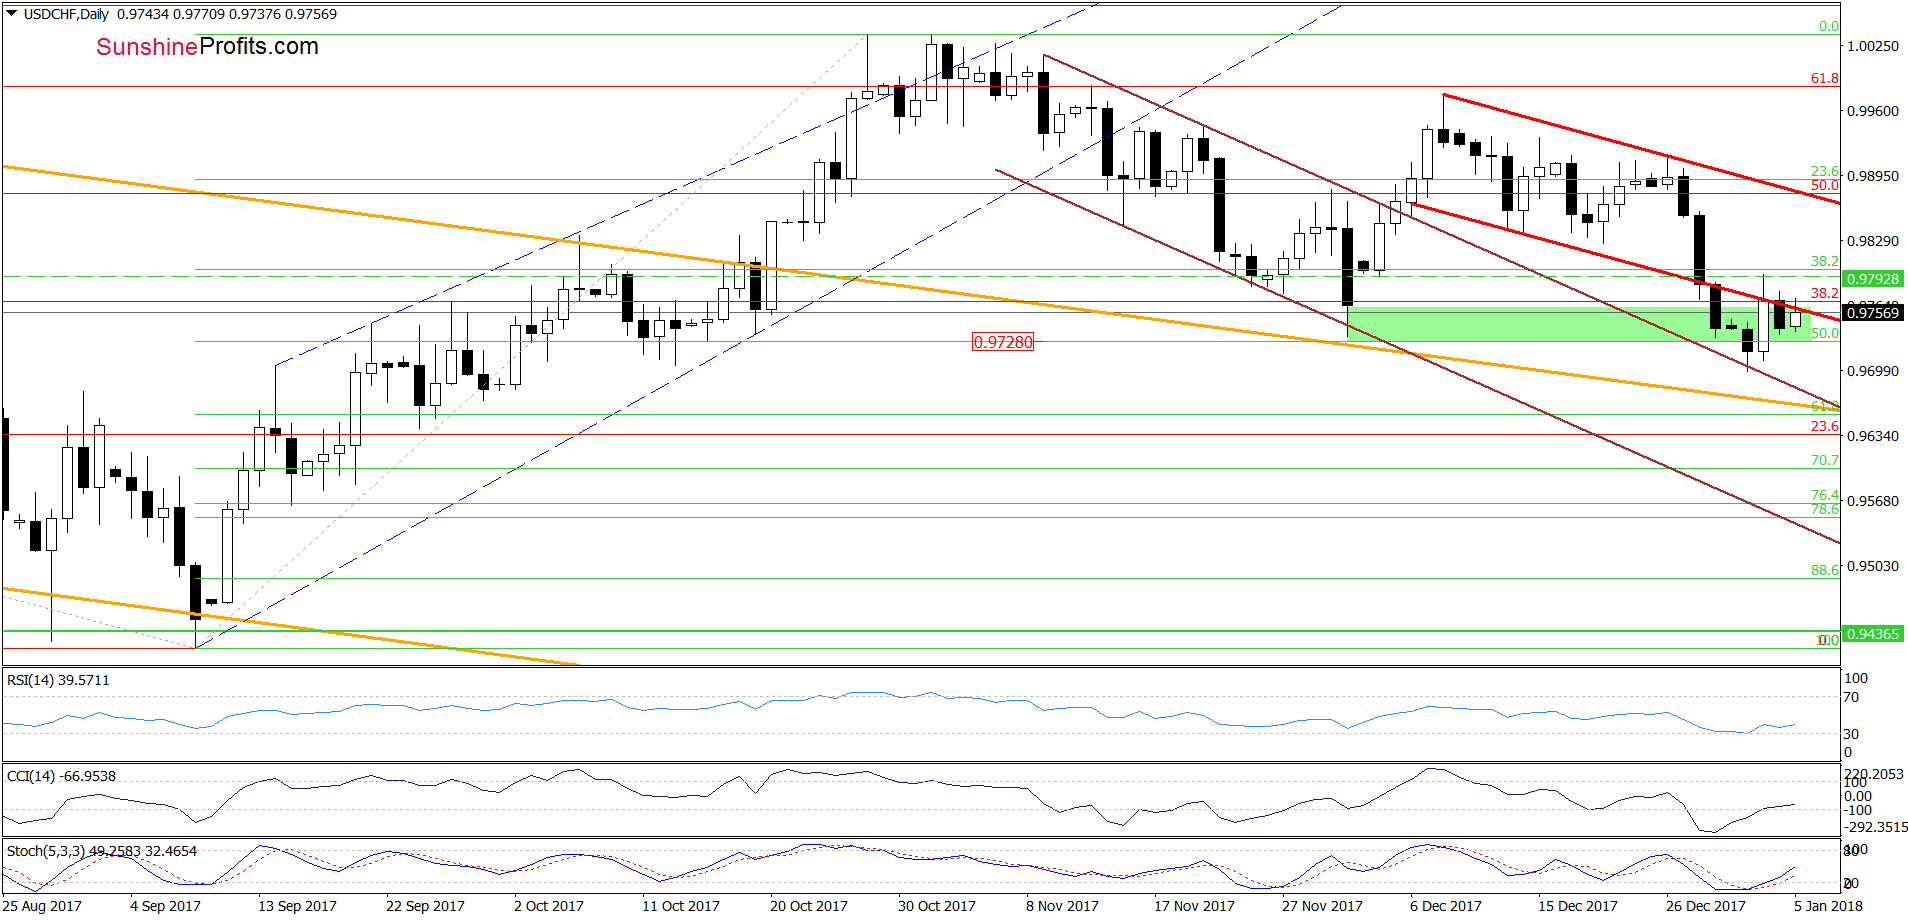
Looking the daily chart, we see that USD/CHF is still trading slightly below the previously-broken lower border of the red declining trend channel, which means that what we wrote on Wednesday remains up-to-date also today:
(…) the pair slipped slightly below the green support zone and tested the previously-broken upper border of the brown declining trend channel. As you see, this support encouraged currency bulls to act, which resulted in a rebound and a comeback to the lower border of the red declining trend channel. At the first sight such price action looks like a verification of the earlier breakdown, but the current position of the daily indicators (the RSI generated a buy signal, while the CCI and the Stochastic Oscillator are very close to doing the same) suggests that the space for declines is limited and a bigger move to the upside is just around the corner. If this is the case, and we see reliable bullish development (for example, an invalidation of the breakdown under the lower border of the red declining trend channel), we’ll consider opening long positions.
Trading position (short-term; our opinion): No positions are justified from the risk/reward perspective at the moment. We will keep you informed should anything change, or should we see a confirmation/invalidation of the above.
Thank you.
Nadia Simmons
Forex & Oil Trading Strategist
Przemyslaw Radomski, CFA
Founder, Editor-in-chief, Gold & Silver Fund Manager
Gold & Silver Trading Alerts
Forex Trading Alerts
Oil Investment Updates
Oil Trading Alerts

