

Although currency bulls pushed GBP/USD higher on Friday, the previously-broken 38.2% Fibonacci retracement stopped further improvement, triggering a pullback earlier today. What’s next for the exchange rate?
In our opinion the following forex trading positions are justified - summary:
- EUR/USD: none
- GBP/USD: short (a stop-loss order at 1.3272; the initial downside target at 1.2375)
- USD/JPY: none
- USD/CAD: none
- USD/CHF: none
- AUD/USD: none
EUR/USD
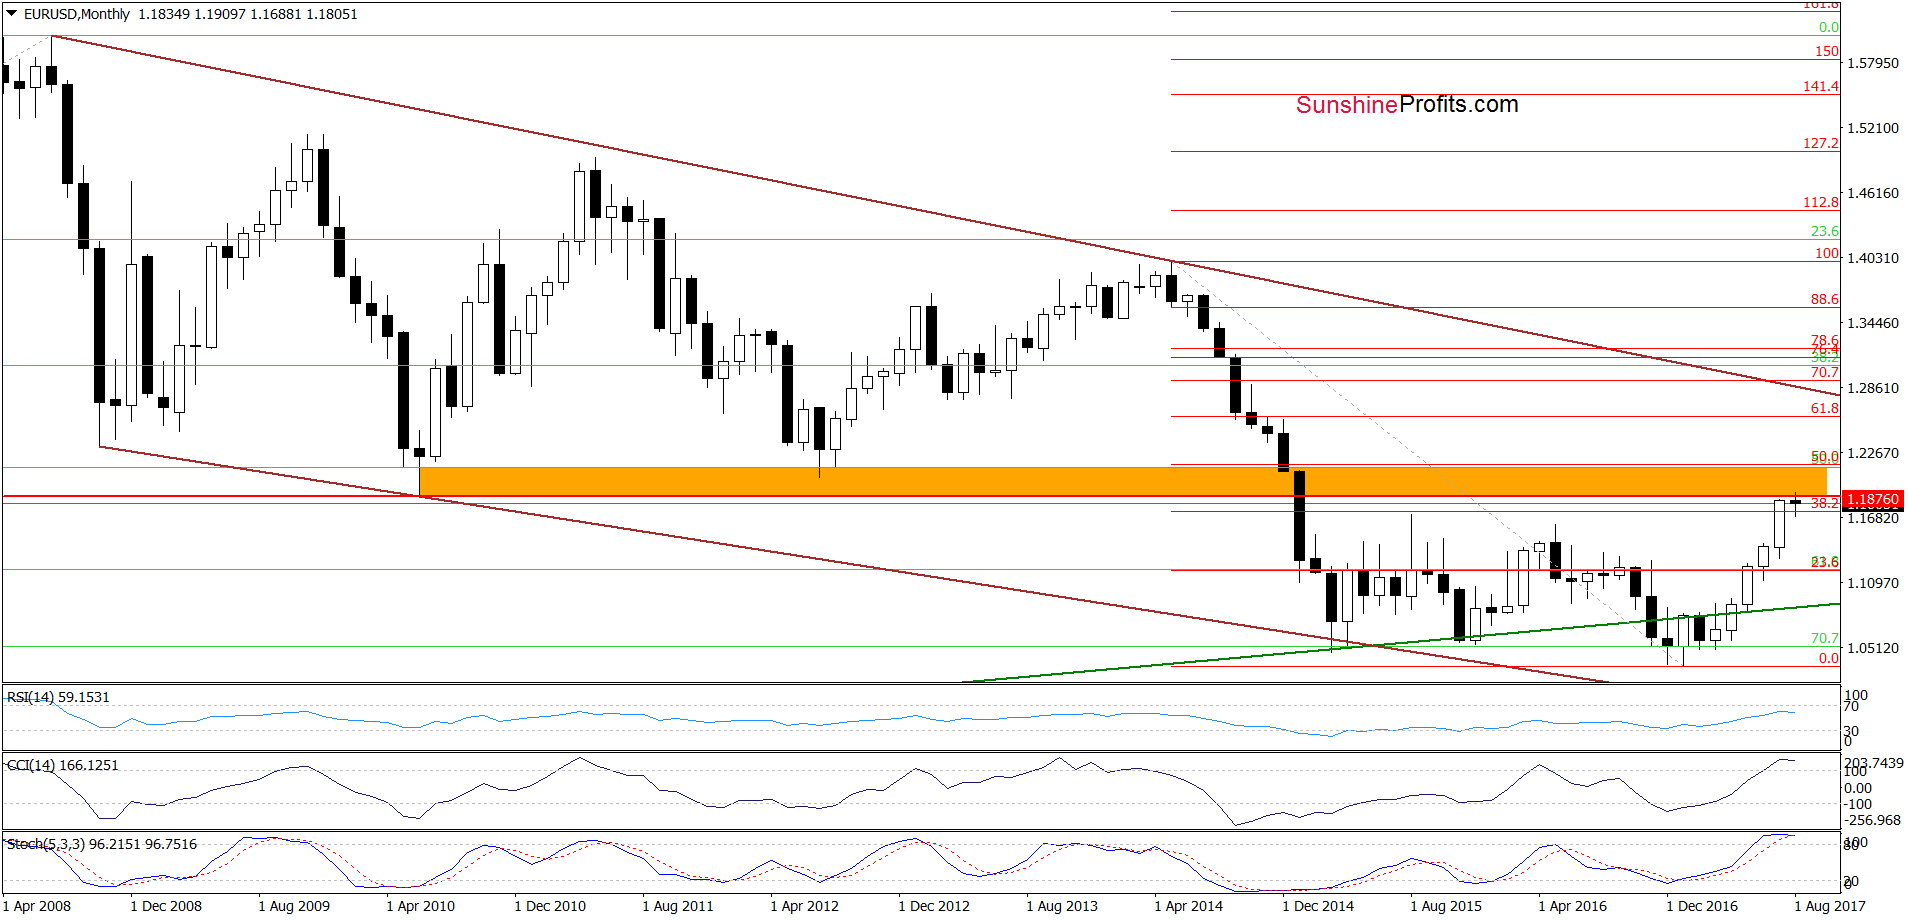
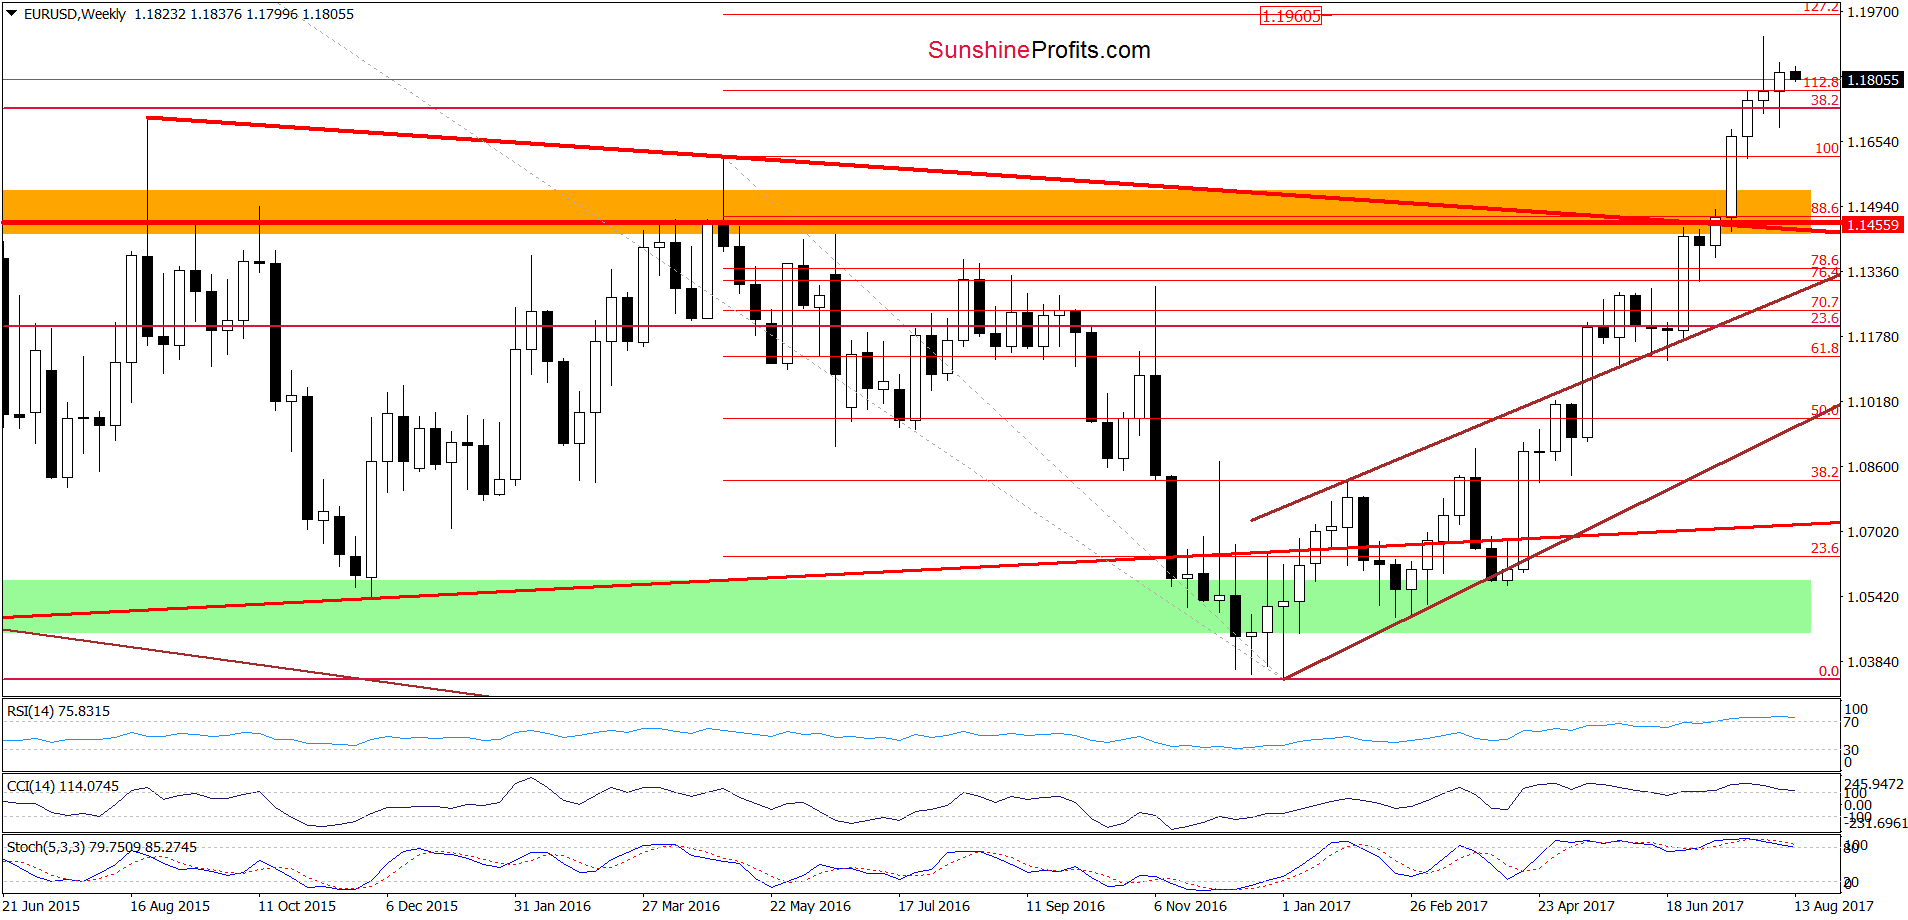
From today’s point of view, we see that EUR/USD closed the previous week above the previously-broken 38.2% Fibonacci retracement and the 112.8% Fibonacci extension, which invalidated the earlier breakdown below these levels. This is a positive development, which suggests that we may see a test of the last week’s high or even the 127.2% Fibonacci extension before the next bigger move to the downside.
Very short-term outlook: mixed
Short-term outlook: mixed with bearish bias
MT outlook: mixed
LT outlook: mixed
Trading position (short-term; our opinion): No positions are justified from the risk/reward perspective. We will keep you informed should anything change, or should we see a confirmation/invalidation of the above.
GBP/USD
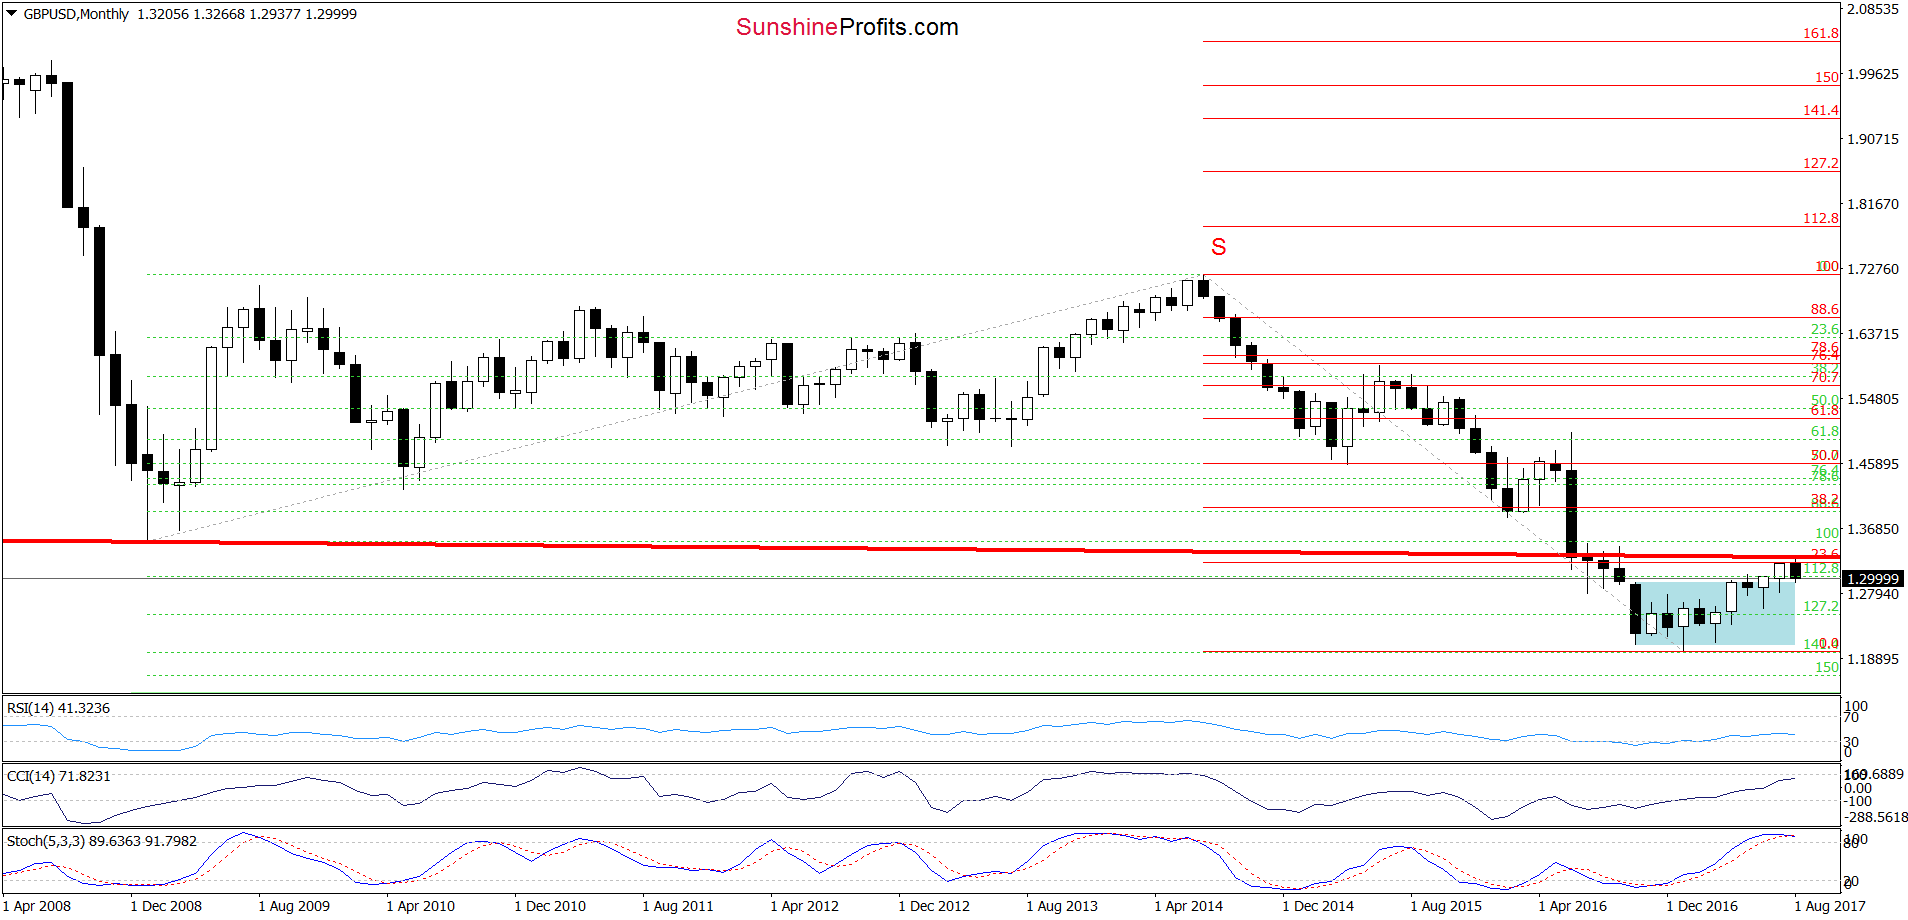
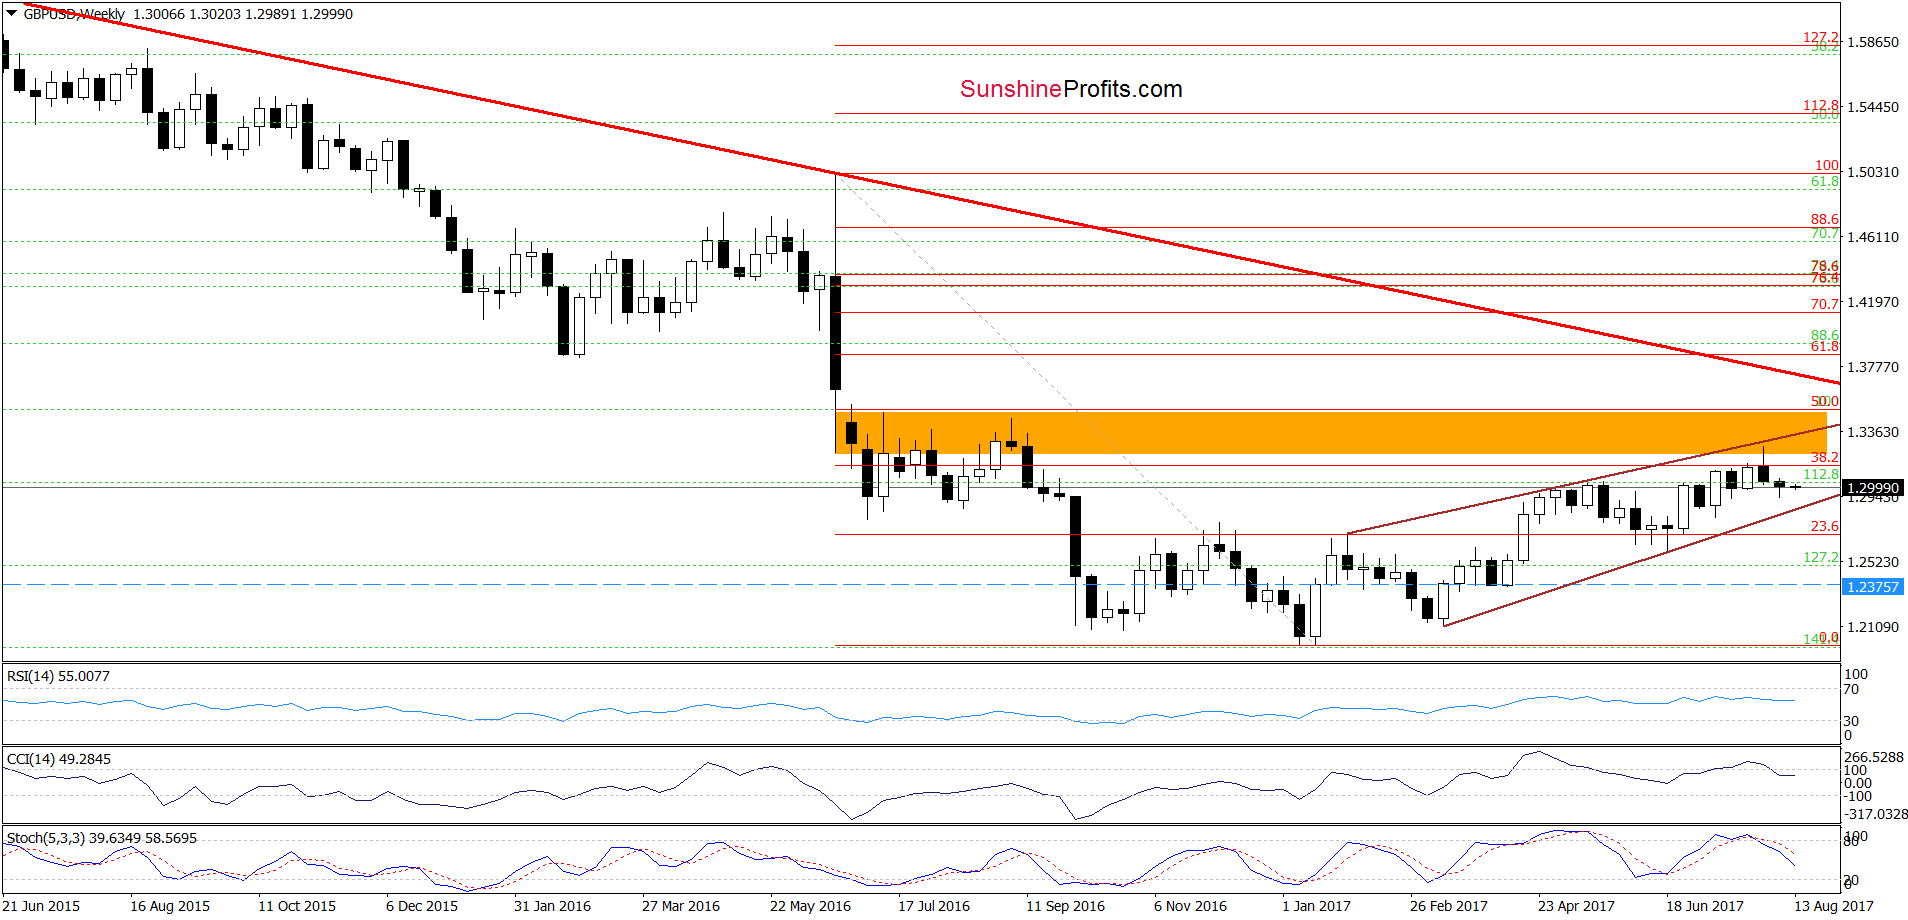
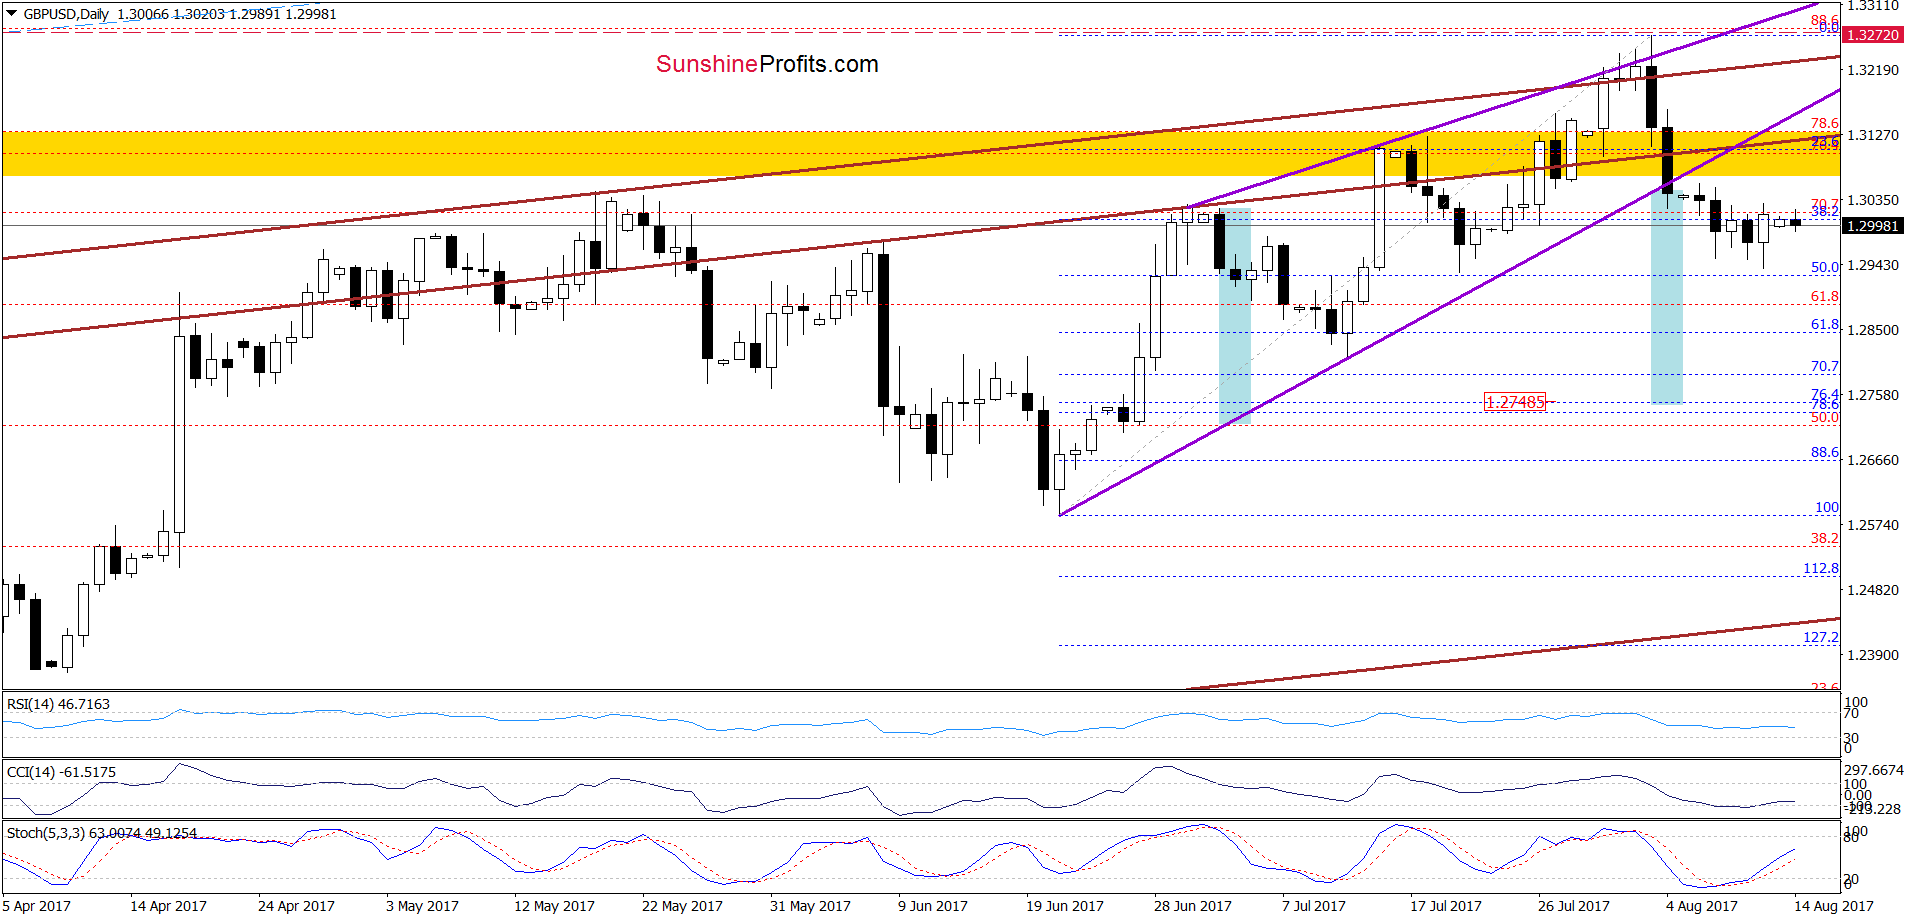
Looking at the charts, we see that GBP/USD remains under the 38.2% Fibonacci retracement and well below the lower border of the purple rising wedge and the yellow resistance zone, which suggests that further deterioration is just around the corner.
Therefore if the exchange rate declines from current levels, we’ll likely see a drop to (at least) 1.2748, where the size of the downward move will correspond to the height of the rising wedge and where the 76.4% and 78.6% Fibonacci retracements are.
Very short-term outlook: bearish
Short-term outlook: mixed with bearish bias
MT outlook: mixed with bearish bias
LT outlook: mixed
Trading position (short-term; our opinion): Short (already profitable) positions (with a stop-loss order at 1.3272 and the initial downside target at 1.2375) are justified from the risk/reward perspective. We will keep you informed should anything change, or should we see a confirmation/invalidation of the above.
USD/CAD
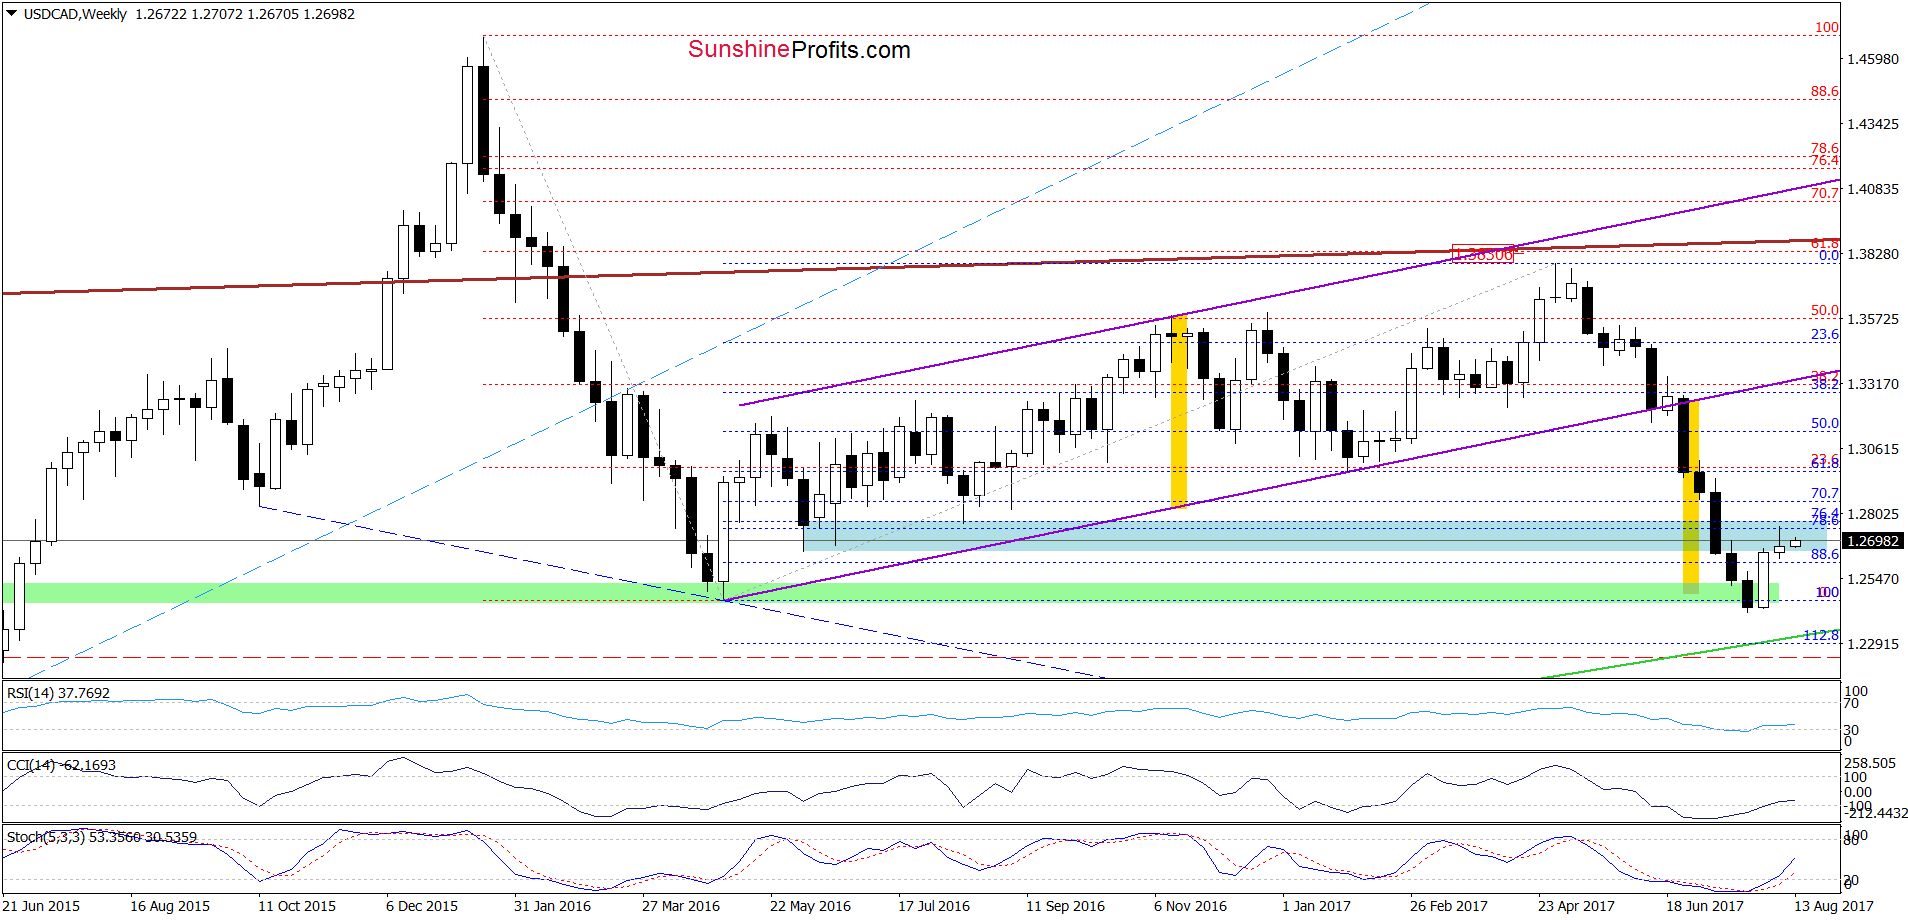
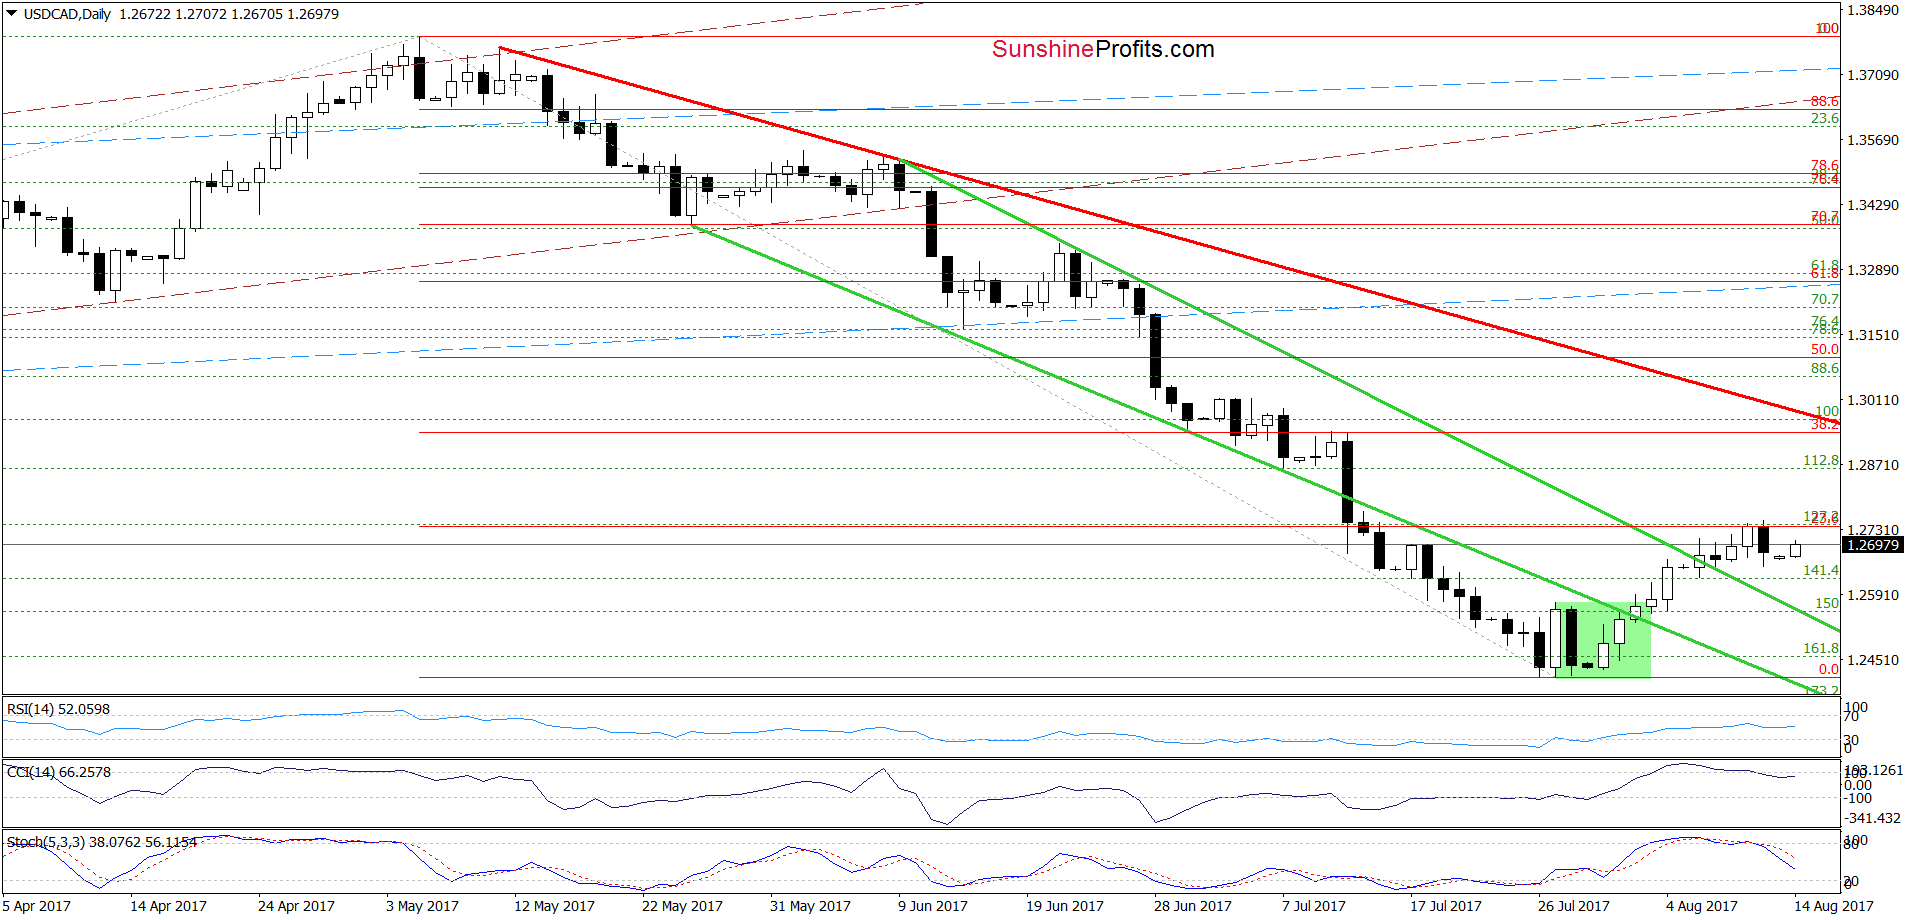
Looking at the charts, we see that although USD/CAD broke above the upper border of the green declining trend channel, the exchange rate is still trading below the 23.6% Fibonacci retracement based on the entire May-July downward move. Additionally, the CCI and the Stochastic Oscillator generated the sell signals, which suggests that we may see further deterioration in the coming days - especially when we factor in the blue resistance zone created by the June 2016 lows (marked on the weekly chart).
If this is the case and USD/CAD reverses and decline, we will likely see a test of the green support zone (seen on the daily chart) and the lower border of the green declining wedge in the following days.
Very short-term outlook: mixed
Short-term outlook: mixed with bearish bias
MT outlook: mixed
LT outlook: mixed
Trading position (short-term; our opinion): No positions are justified from the risk/reward perspective at the moment. We will keep you informed should anything change, or should we see a confirmation/invalidation of the above.
Thank you.
Nadia Simmons
Forex & Oil Trading Strategist
Przemyslaw Radomski, CFA
Founder, Editor-in-chief, Gold & Silver Fund Manager
Gold & Silver Trading Alerts
Forex Trading Alerts
Oil Investment Updates
Oil Trading Alerts

