

After yesterday’s session it seemed that currency bulls took control after GBP/USD climbed above the previously-broken long-term resistance line. As it tuned out, it was just a short-lived improvement, which caught too emotional investors who underestimated the broader picture of the exchange rate. What can we expect in the following days?
In our opinion the following forex trading positions are justified - summary:
- EUR/USD: short (a stop-loss order at 1.1833; the initial downside target at 1.1588)
- GBP/USD: short (a stop-loss order at 1.3301; the initial downside target at 1.2913)
- USD/JPY: long (a stop-loss order at 110.21; the initial upside target at 113.50)
- USD/CAD: none
- USD/CHF: none
- AUD/USD: short (a stop-loss order at 0.7510; the initial downside target at 0.7315)
EUR/USD
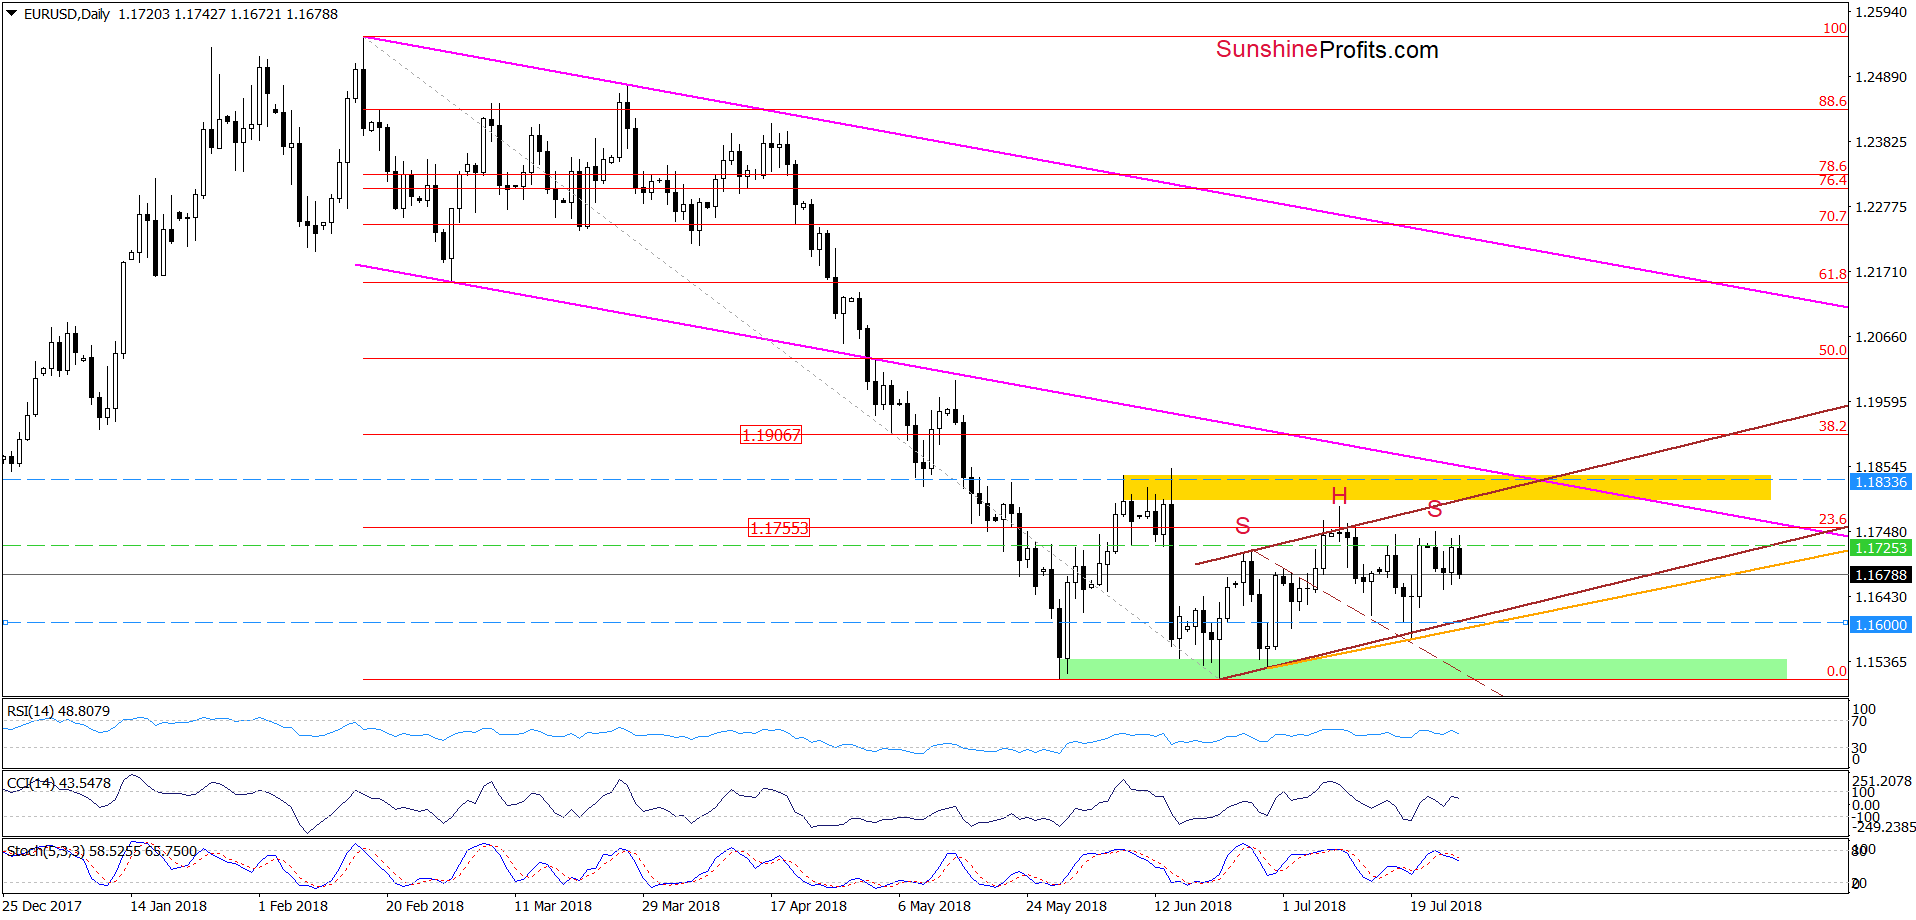
Although currency bulls took EUR/USD a bit higher earlier today, the proximity to the nearest resistance zone (created by the previous highs and the 23.6% Fibonacci retracement) encouraged their opponents to act.
As a result, the pair reversed and declined, which together with yesterday’s sell signal generated by the Stochastic Oscillator suggests that we’ll see a realization of the pro-bearish scenario about which we wrote on Tuesday:
(…), we can observe a potential pro-bearish head and shoulders formation. If this is the case, currency bears are just forming the right arm of the pattern, which will likely take EUR/USD to (at least) the neck line marked with orange (and based on the previous lows) in the following days.
Trading position (short-term; our opinion): short positions with a stop-loss order at 1.1833 and the initial downside target at 1.1588 are justified from the risk/reward perspective. We will keep you informed should anything change, or should we see a confirmation/invalidation of the above.
GBP/USD
In our yesterday’s alert, we wrote the following:
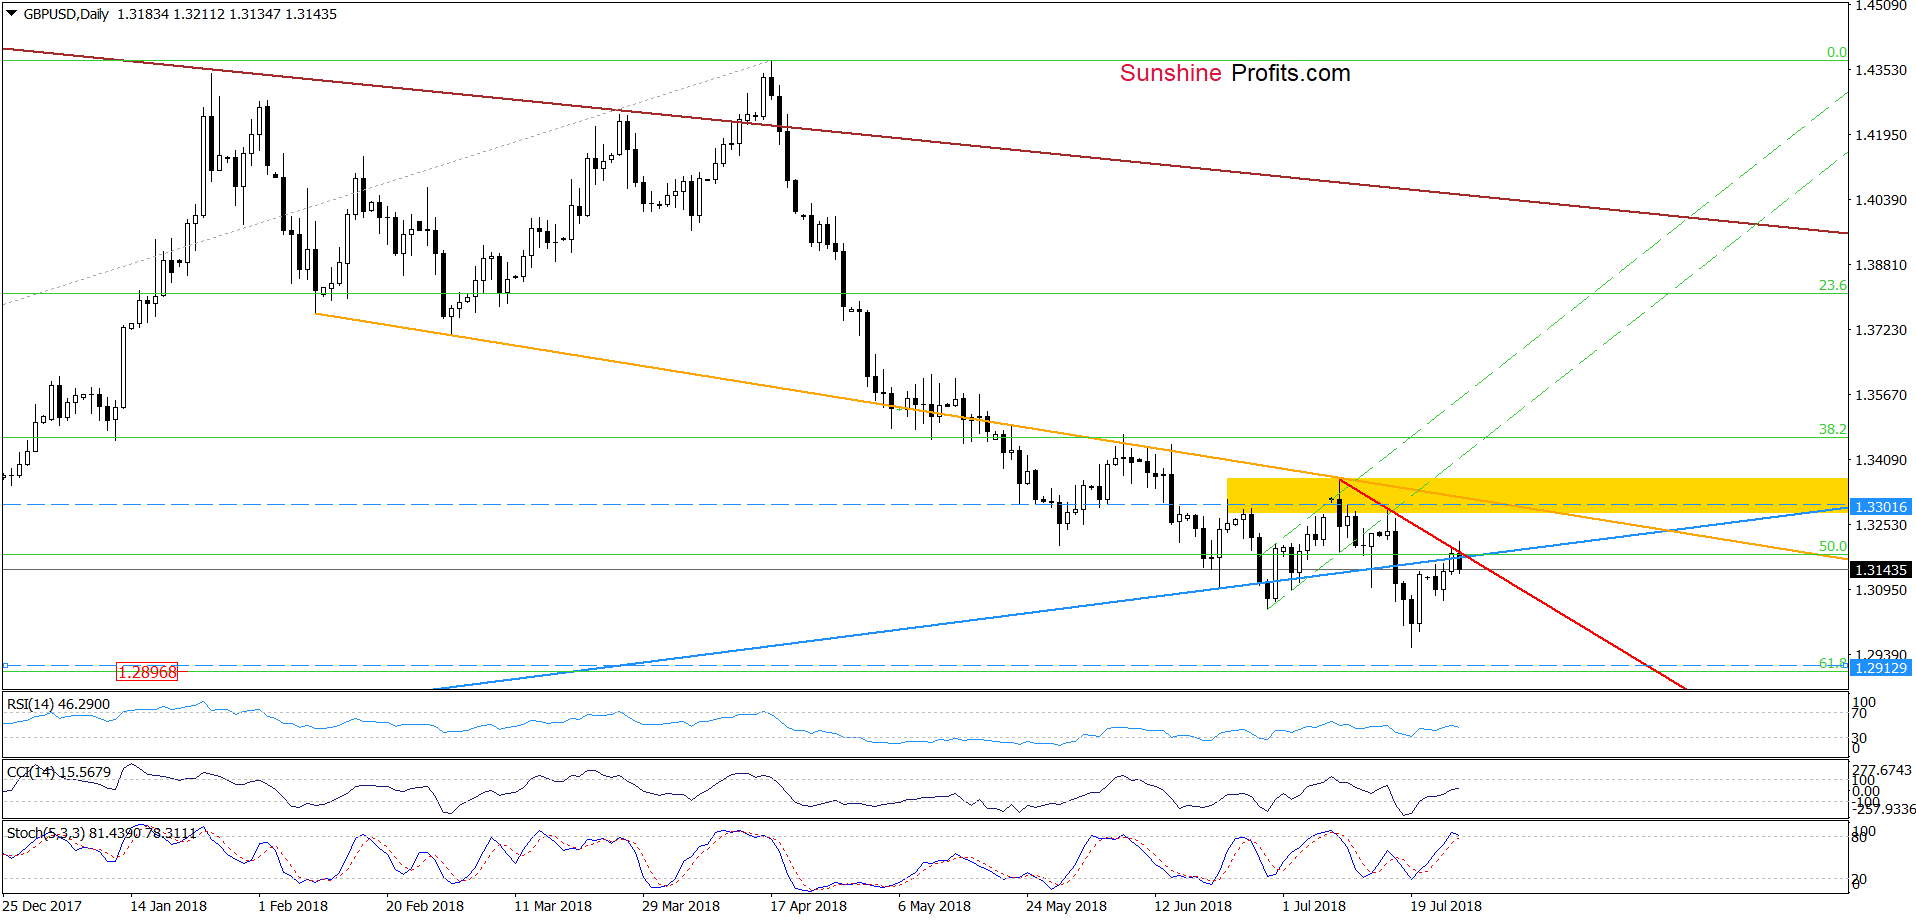
(…) GBP/USD extended Friday’s move to the upside and almost touched the previously-broken blue support line (…). Earlier today, the pair moved a bit higher once again, which looks like a verification of the last week’s breakdown under this important line.
If the situation develops in line with the above assumption, currency bears will likely be more active in this area, which should push the pair lower in the very near future.
Looking at the daily chart, we see that the situation developed in tune with our assumptions and GBP/USD moved lower after another unsuccessful attempt to go higher.
Thanks to today’s drop, the pair not only invalidated the earlier tiny breakout above the blue line, but also slipped under the very short-term red declining resistance line based on the previous highs, which in combination with the current position of the Stochastic Oscillator (we’ll likely see a sell signal tomorrow or even later in the day) increases the probability of further deterioration in the very near future.
How low could GBP/USD go?
We believe that the best answer to this question will be the quote from our yesterday’s alert:
(…) In our opinion, we’ll likely see not only a test of the recent lows, but also a drop to around 1.2896, where the 61.8% Fibonacci retracement (based on the entire January 2017 – March 2018 upward move) is.
Taking all the above into account, we think that opening short positions is justified from the risk/reward perspective.
Trading position (short-term; our opinion): Short positions with a stop-loss order at 1.3301 and the initial downside target at 1.2913 are justified from the risk/reward perspective. We will keep you informed should anything change, or should we see a confirmation/invalidation of the above.
USD/JPY
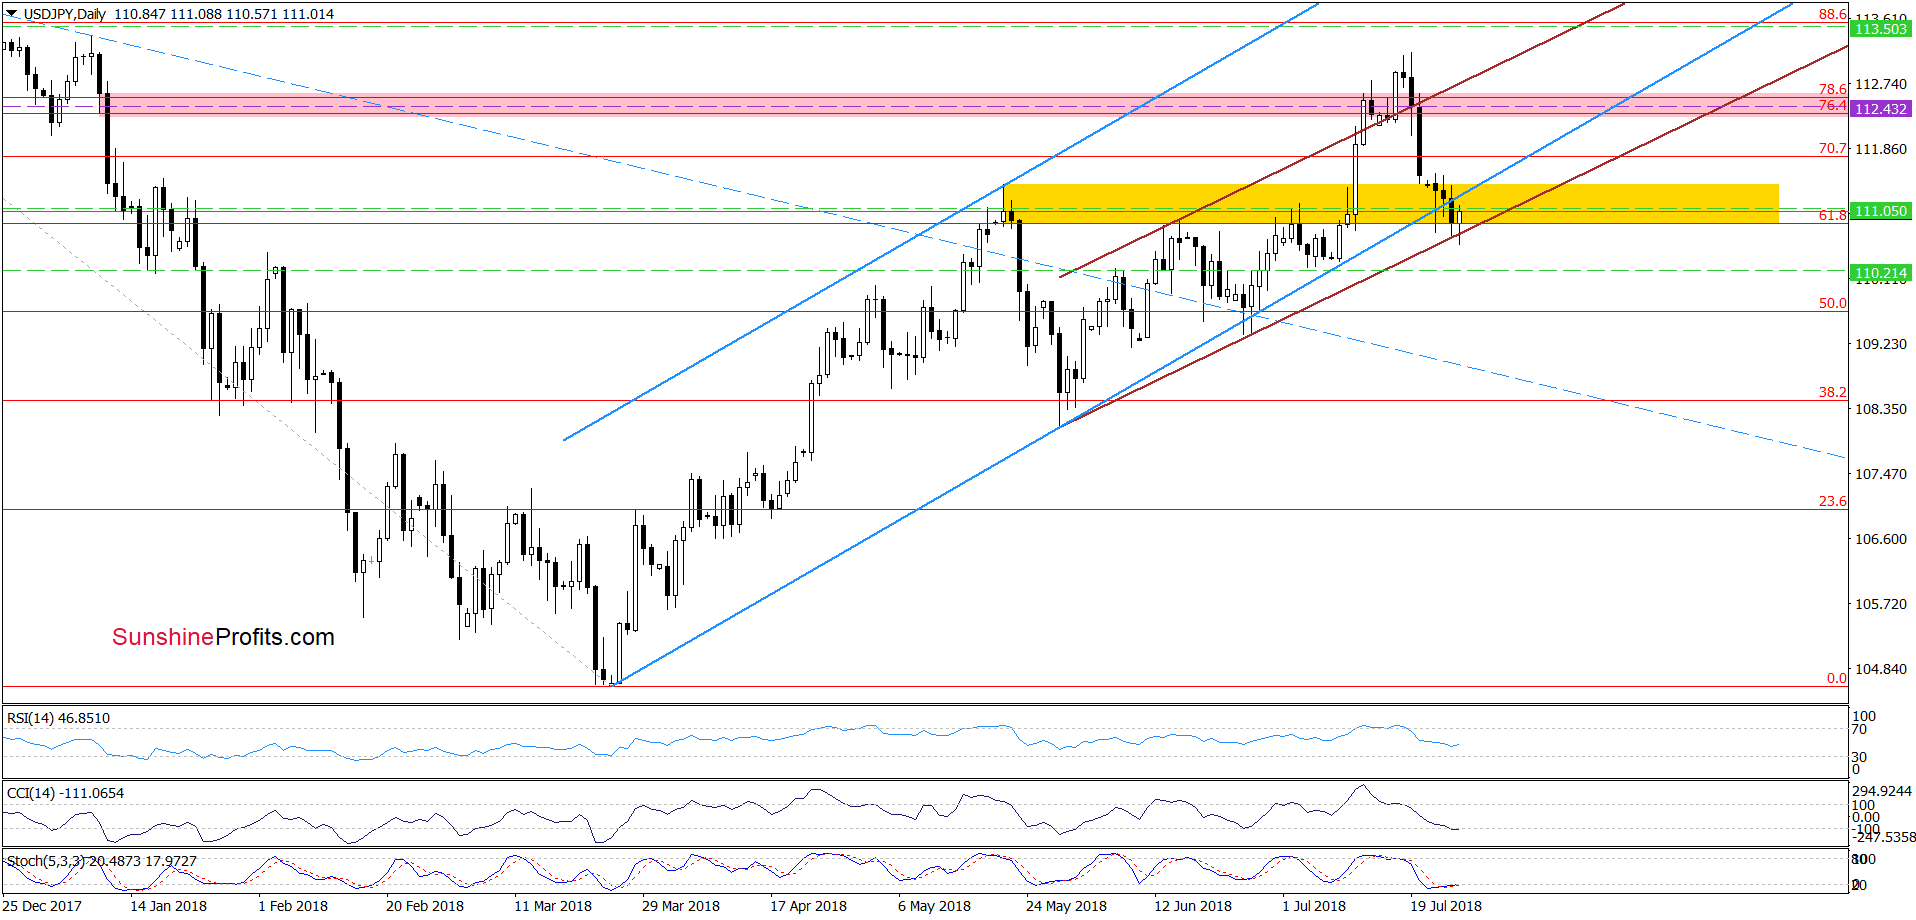
From today’s point of view, we see that although USD/JPY extended its correction recently, the lower border of the brown rising trend channel stopped the sellers earlier today.
As a result, the exchange rate rebounded and invalidated the tiny breakdown under this line, which together with the current position of the daily indicators (the CCI and the Stochastic Oscillator are very close to generating the sell signals) suggests that another bigger move to the upside is just around the corner.
If this is the case and currency bulls use all these positive signs to push the pair higher, we’ll see (at least) a test of the recent highs in the following days.
Trading position (short-term; our opinion): long positions with a stop-loss order at 110.21 and the initial upside target at 113.50 are justified from the risk/reward perspective. We will keep you informed should anything change, or should we see a confirmation/invalidation of the above.
Thank you.
Nadia Simmons
Forex & Oil Trading Strategist
Przemyslaw Radomski, CFA
Founder, Editor-in-chief, Gold & Silver Fund Manager
Gold & Silver Trading Alerts
Forex Trading Alerts
Oil Investment Updates
Oil Trading Alerts

