

Recent days showed that currency bulls are not as strong as it seemed after a fairly dynamic bounce that we could see almost a week ago. Despite the initial spurt, the buyers didn’t even manage to reach the first a bit more important resistance. Time showed that we did not have to wait long for the consequences of this manifestation of weakness. Does it mean that a fresh low is ahead of us? Is there anything that can stop sellers from such a victory?
In our opinion the following forex trading positions are justified - summary:
- EUR/USD: short (the stop-loss level at 1.186; the initial target price at 1.1203)
- GBP/USD: none
- USD/JPY: long (the stop-loss level at 107.78; the initial target price at 113.88)
- USD/CAD: none
- USD/CHF: none
- AUD/USD: none
EUR/USD
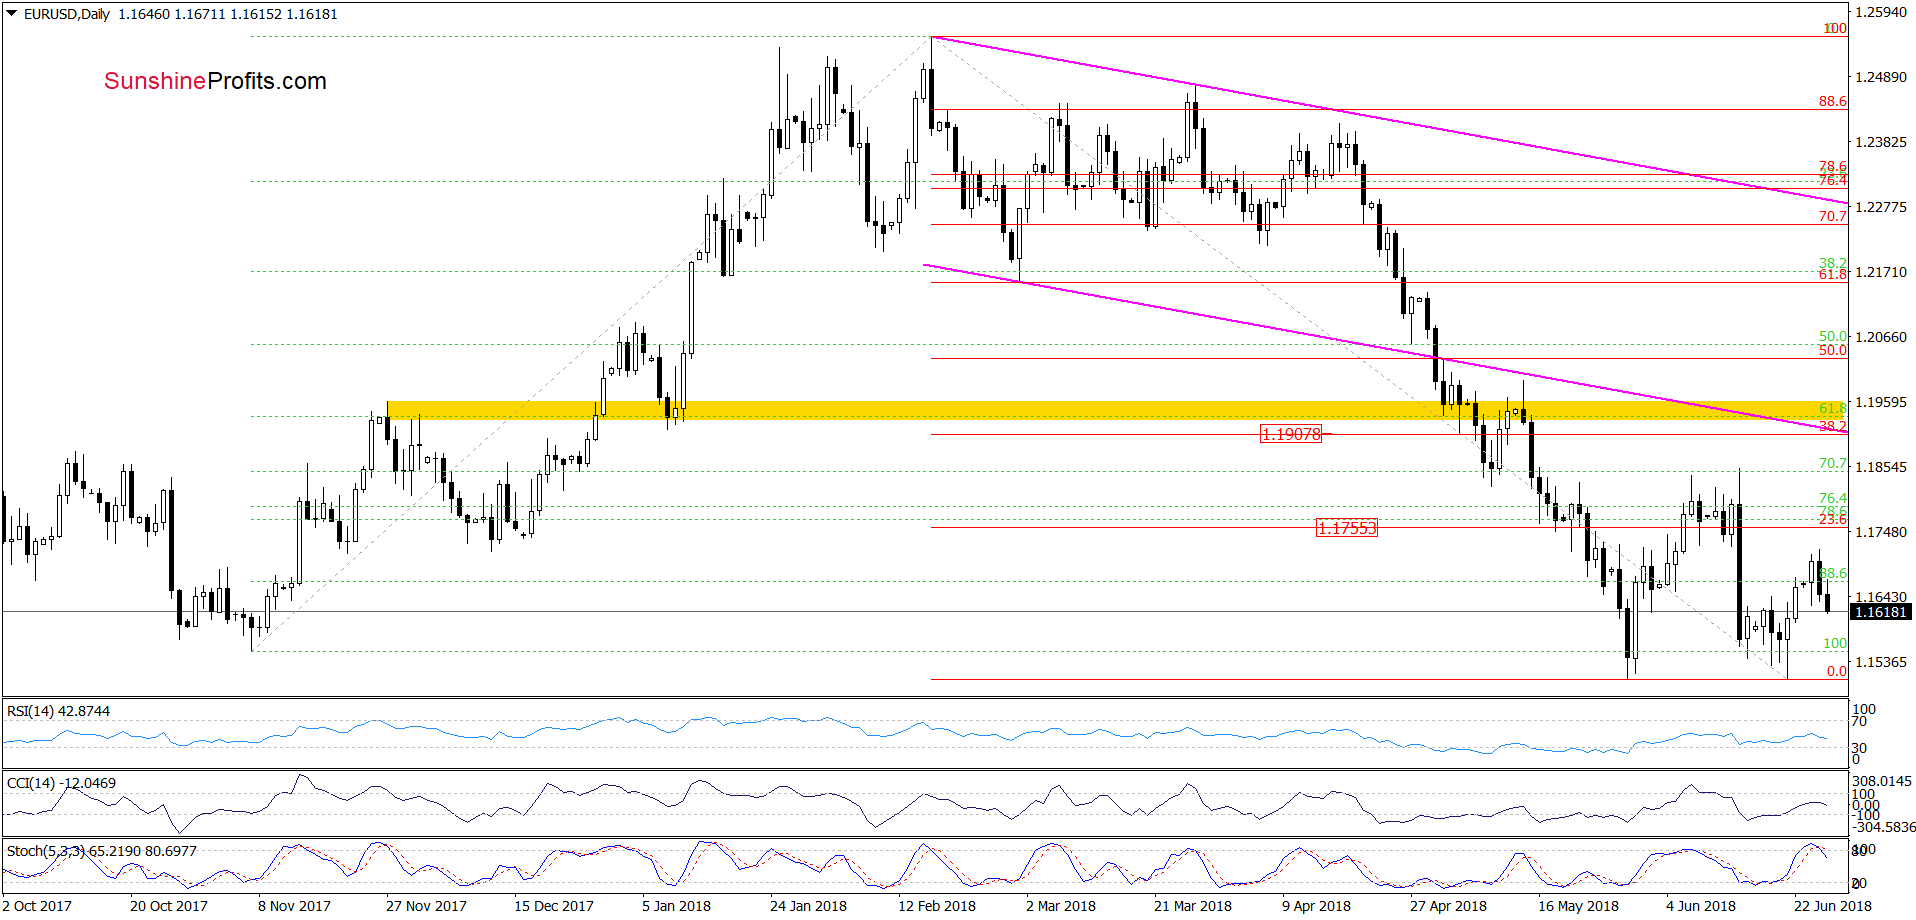
Looking at the daily chart, we see that EUR/USD extended its move to the downside earlier today, which means that what we wrote yesterday remains up-to-date:
(…) the pair didn’t even manage to climb to the first Fibonacci retracement. Additionally, the Stochastic Oscillator is very close to generating a sell signal, which increases the probability that we’ll see a re-test of the long-term brown rising line seen on the weekly chart below (it serves as the nearest support at the moment of writing these words) in the coming day(s).
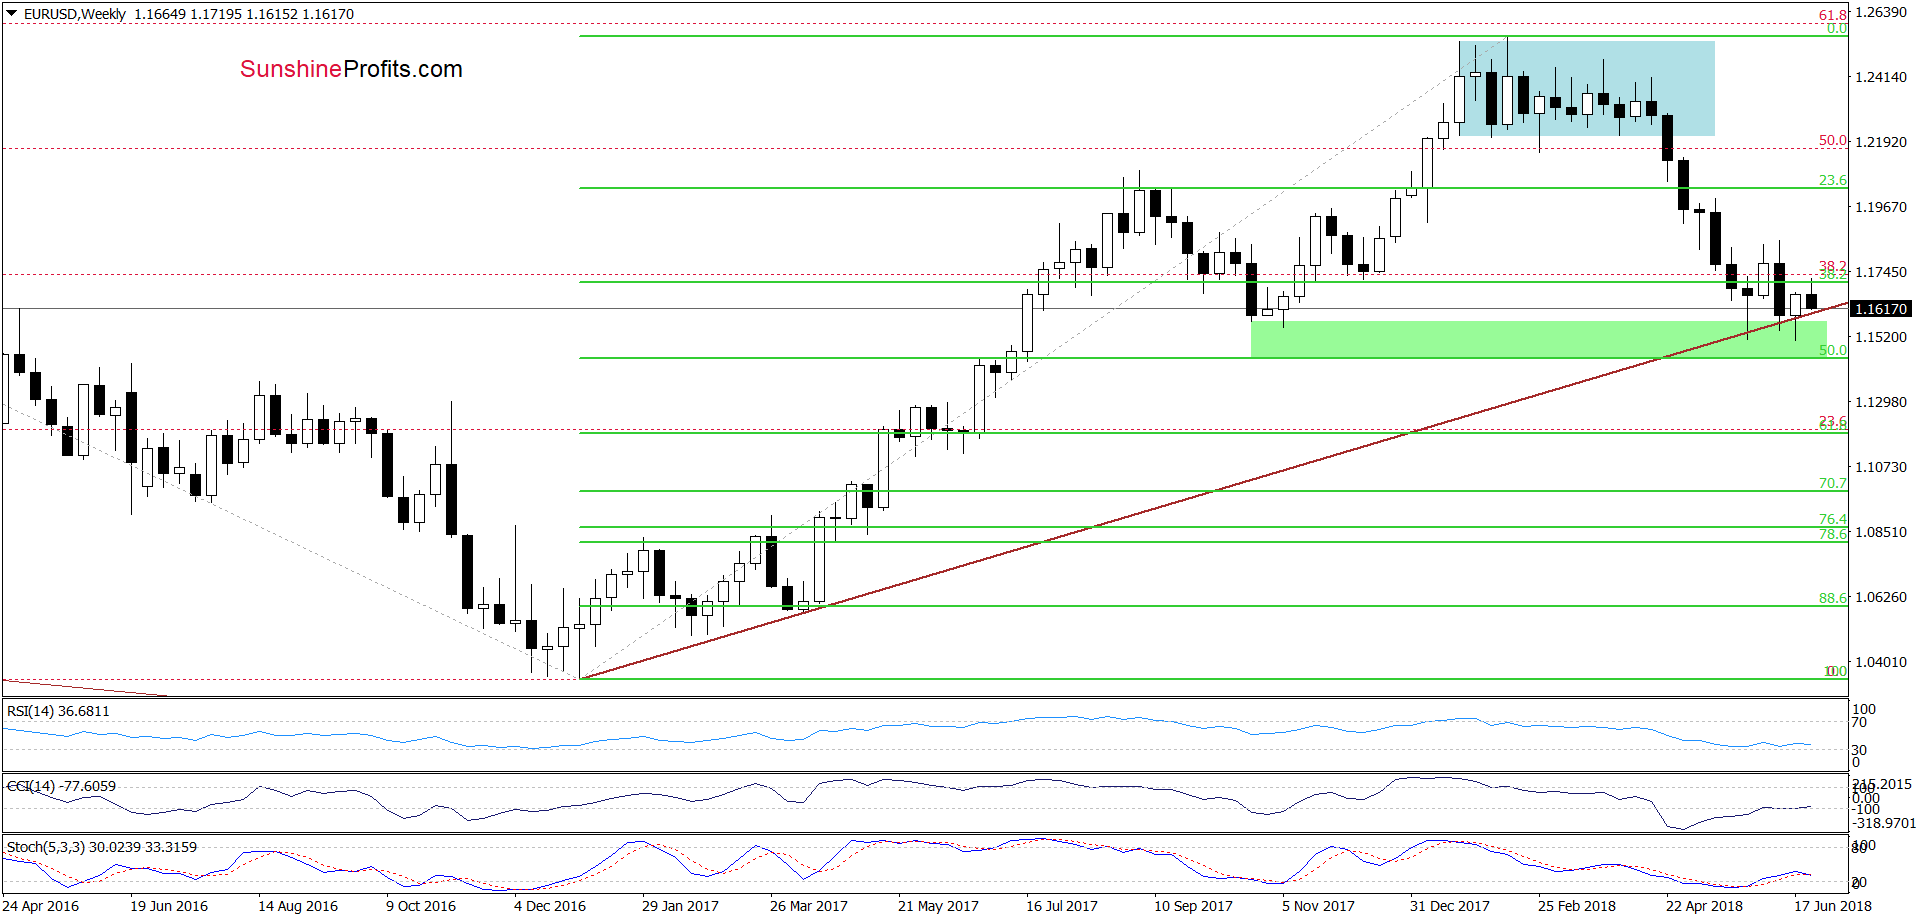
At this point, it is also worth noting that if we see a successful breakdown under this line (a weekly closure below it), the exchange rate will likely not only test the recent lows, but also move to the 50% Fibonacci retracement (around 1.1443) or even lower in the following days/weeks.
Trading position (short-term; our opinion): Short positions (with the stop-loss level at 1.186 and the initial target price at 1.1203) are justified from the risk/reward perspective. We will keep you informed should anything change, or should we see a confirmation/invalidation of the above.
GBP/USD
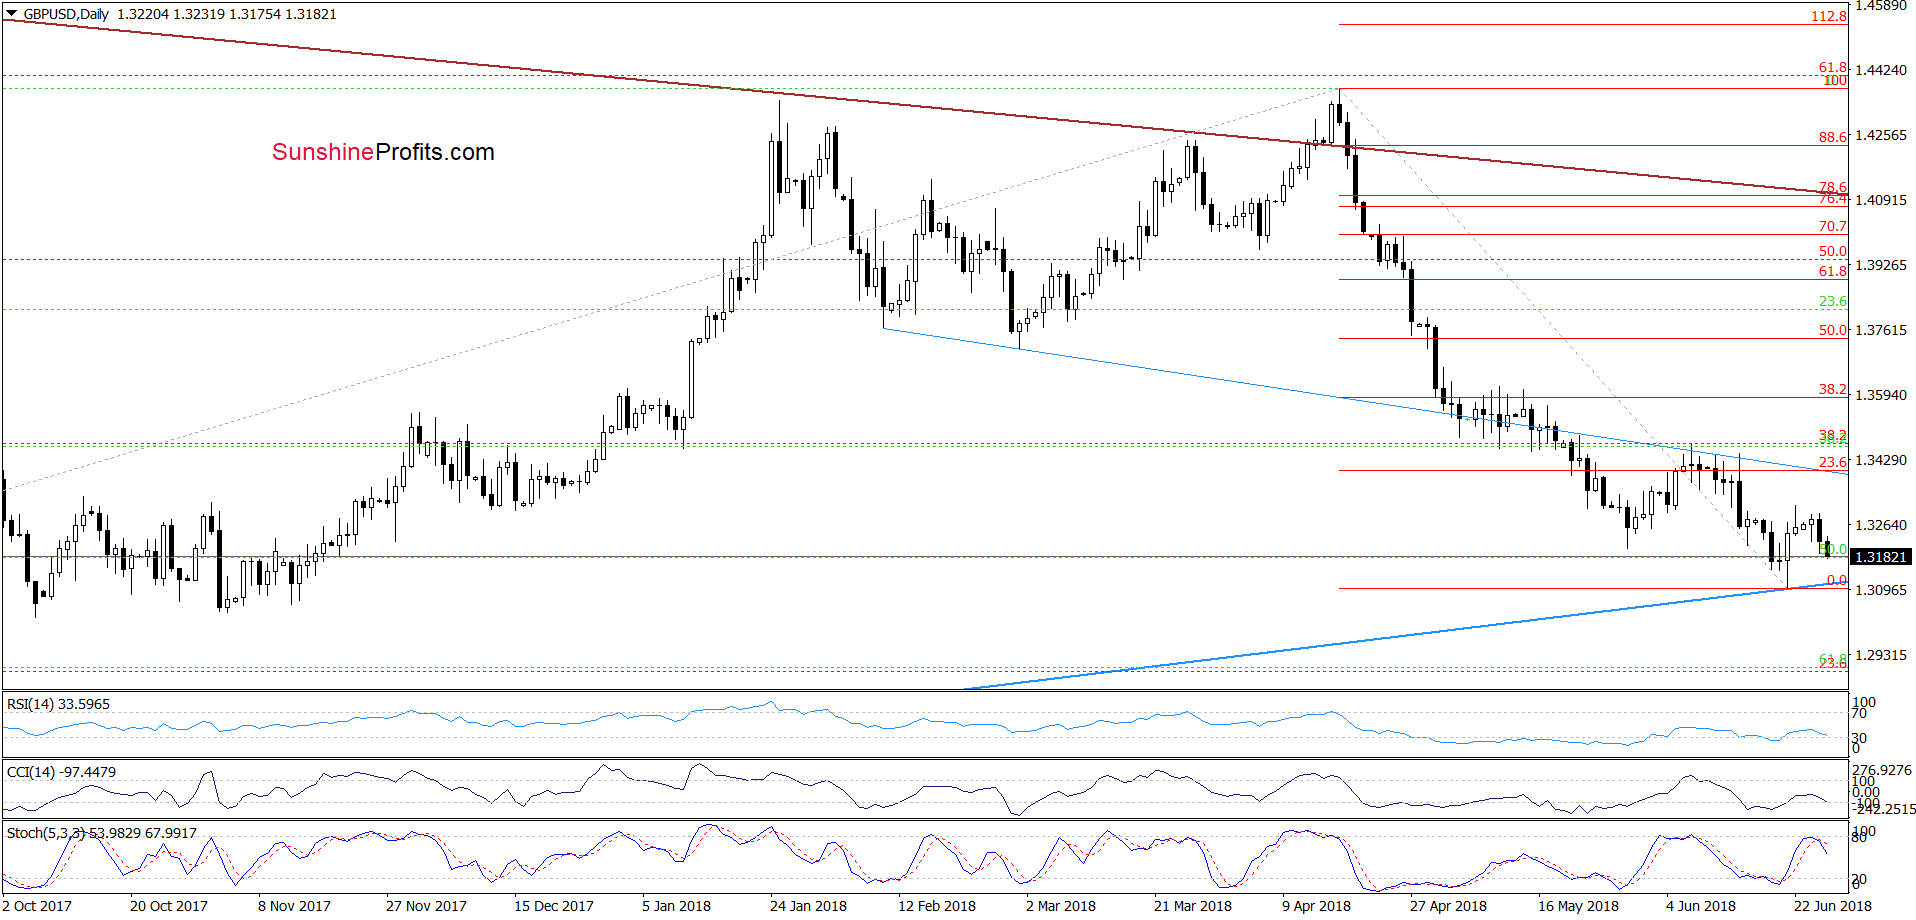
From today’s point of view, we see, the overall situation in GBP/USD remains quite similar to what we saw in the case of EUR/USD as the exchange rate reversed and extended losses during today’s session.
What does it mean for the pair? In our opinion, at least a test of the long-term blue support line seen only partially on the daily chart, but definitely more clearly on the weekly chart below.
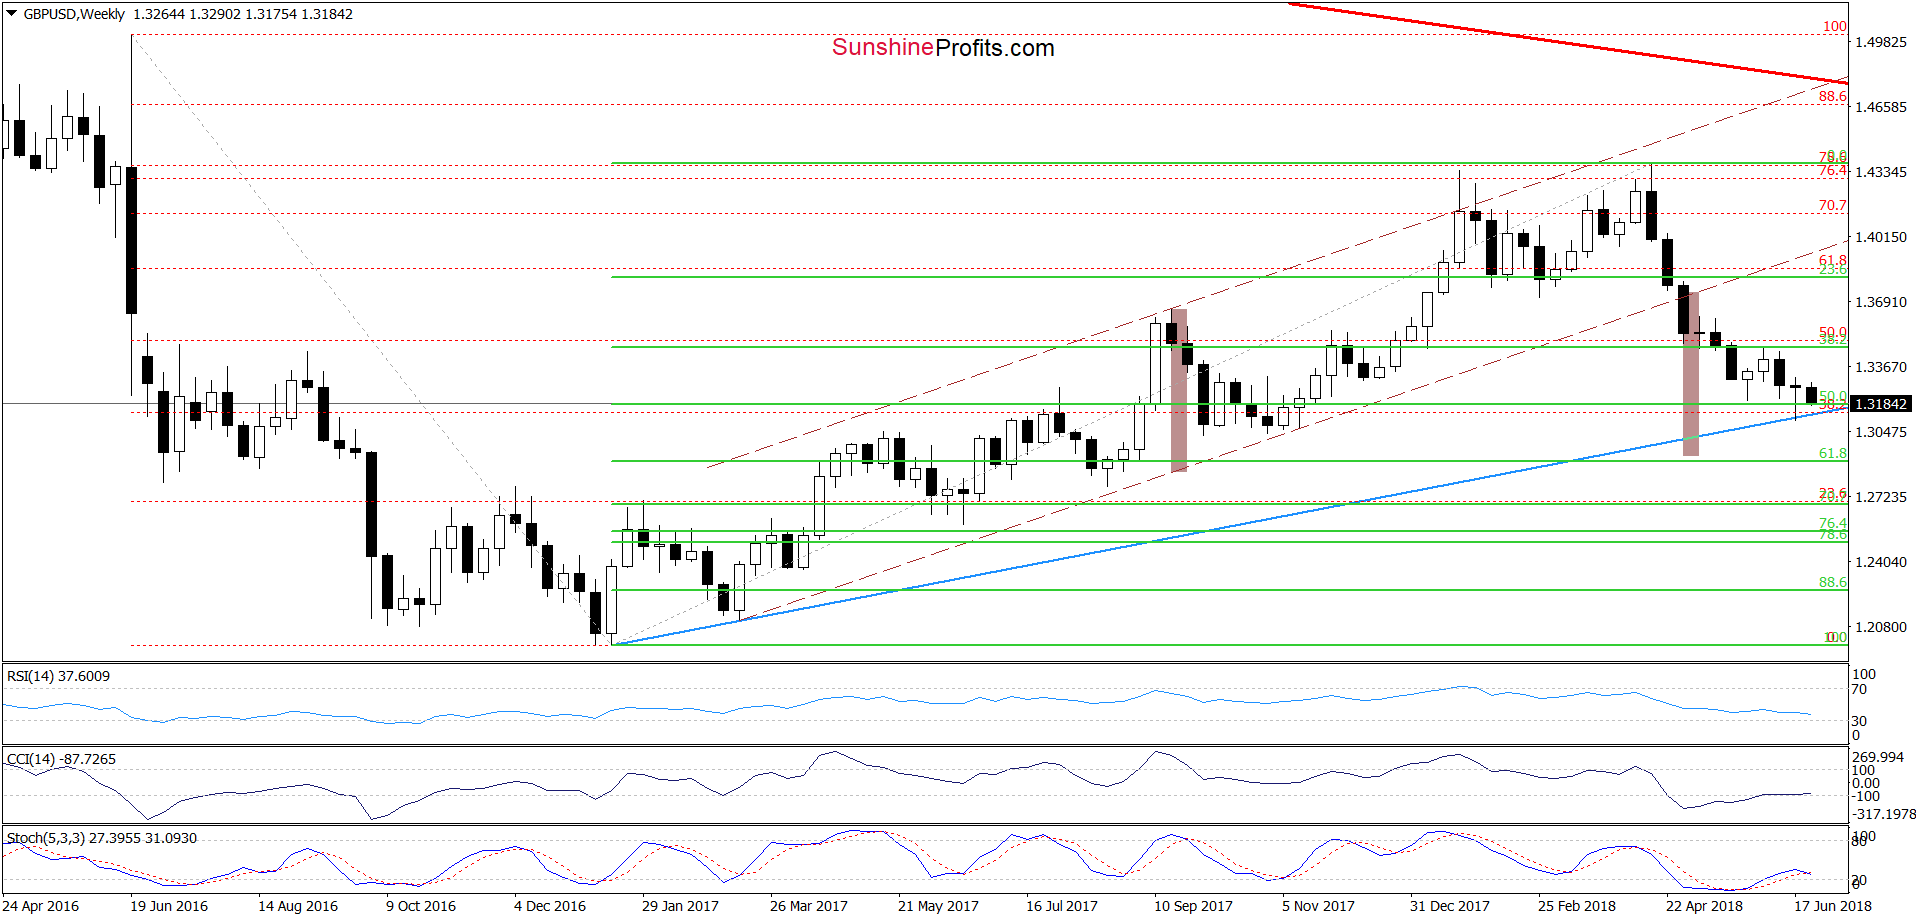
On the medium-term chart, we see that the pair tested this important support in the previous week, but currency bears didn’t manage to go lower. Nevertheless, taking into account the sell signal generated by the daily Stochastic Oscillator and an invalidation of the buy signal generated by the CCI, we think that the pair will likely go lower in the coming days.
How low could it go? When we consider the earlier breakdown under the lower border of the brown rising trend channel (marked with dashed lines), it seems that GBP/USD could decline even to around 1.2928, where the size of the downward move will correspond to the height of the channel. What’s interesting, slightly below this level is also the 61.8% Fibonacci retracement (based on the entire 2017-2018 upward move), which could encourage currency bulls to fight for this area.
Trading position (short-term; our opinion): No positions are justified from the risk/reward perspective. Nevertheless, if we see a breakdown under the long-term blue support line, we’ll consider opening short positions. We will keep you informed should anything change, or should we see a confirmation/invalidation of the above.
USD/CHF
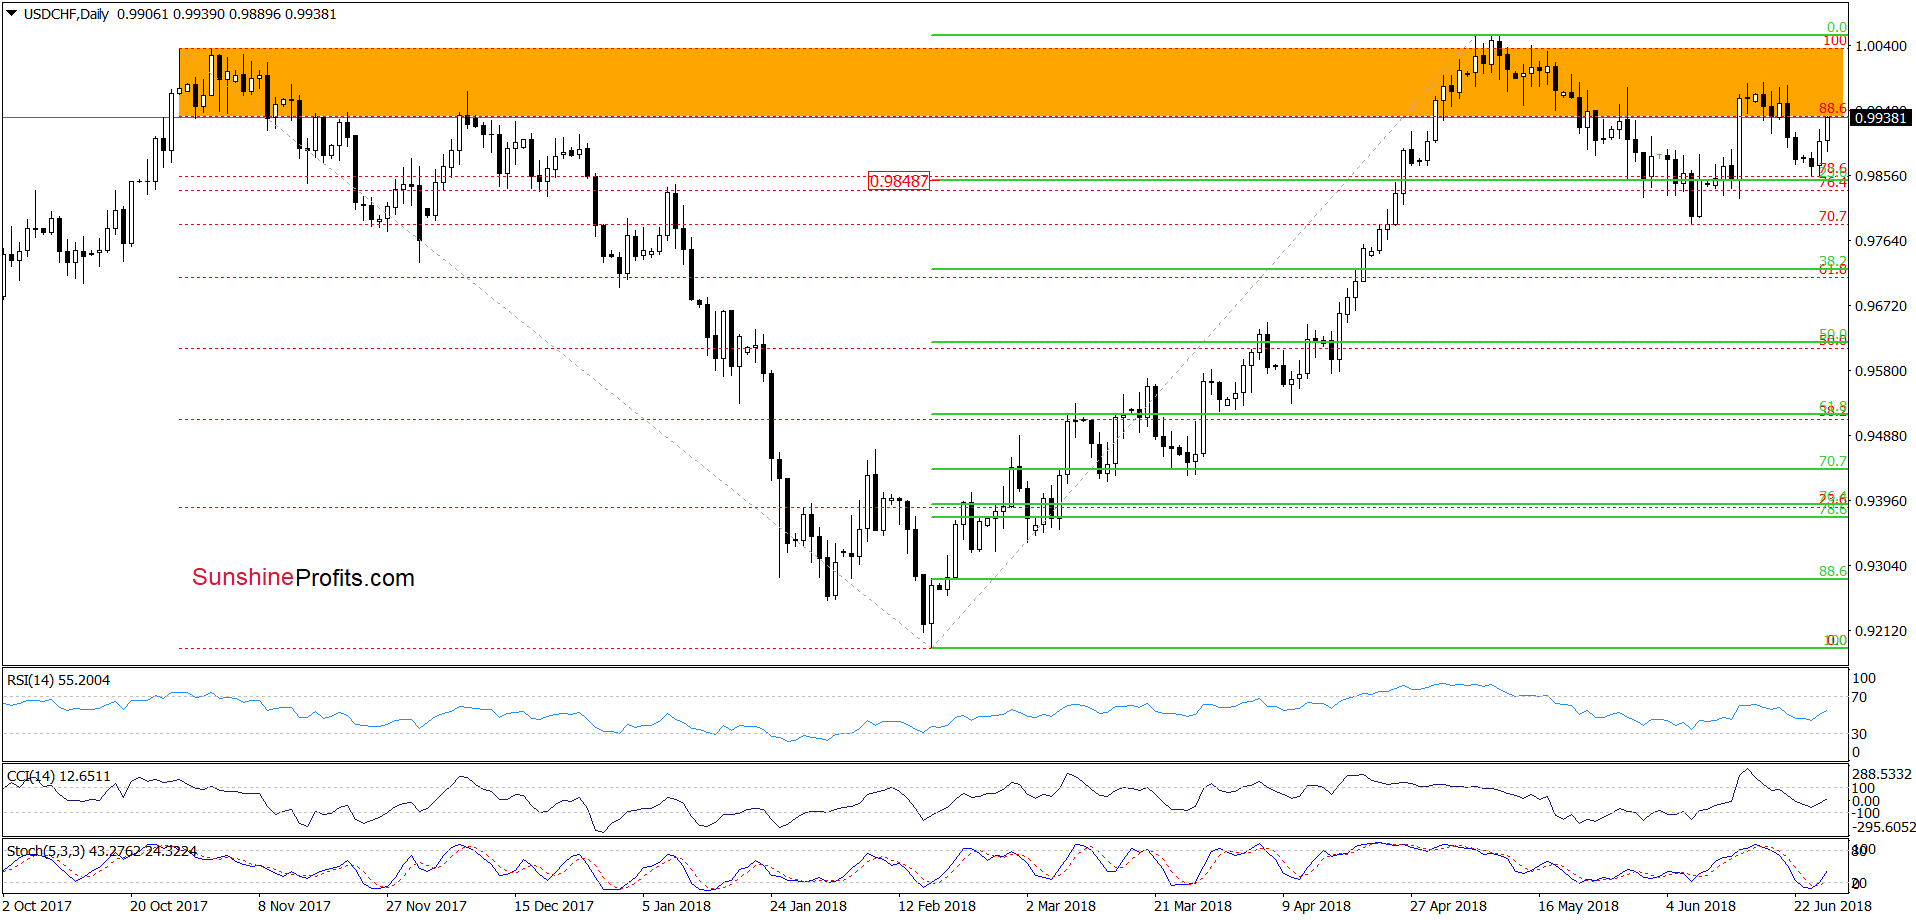
On the daily chart, we see that although USD/CHF pulled back in the previous week, the 23.6% Fibonacci retracement in combination with the buy signals generated by the daily indicators triggered a rebound. Thanks to the currency bulls’ action, the exchange rate came back to the orange resistance zone.
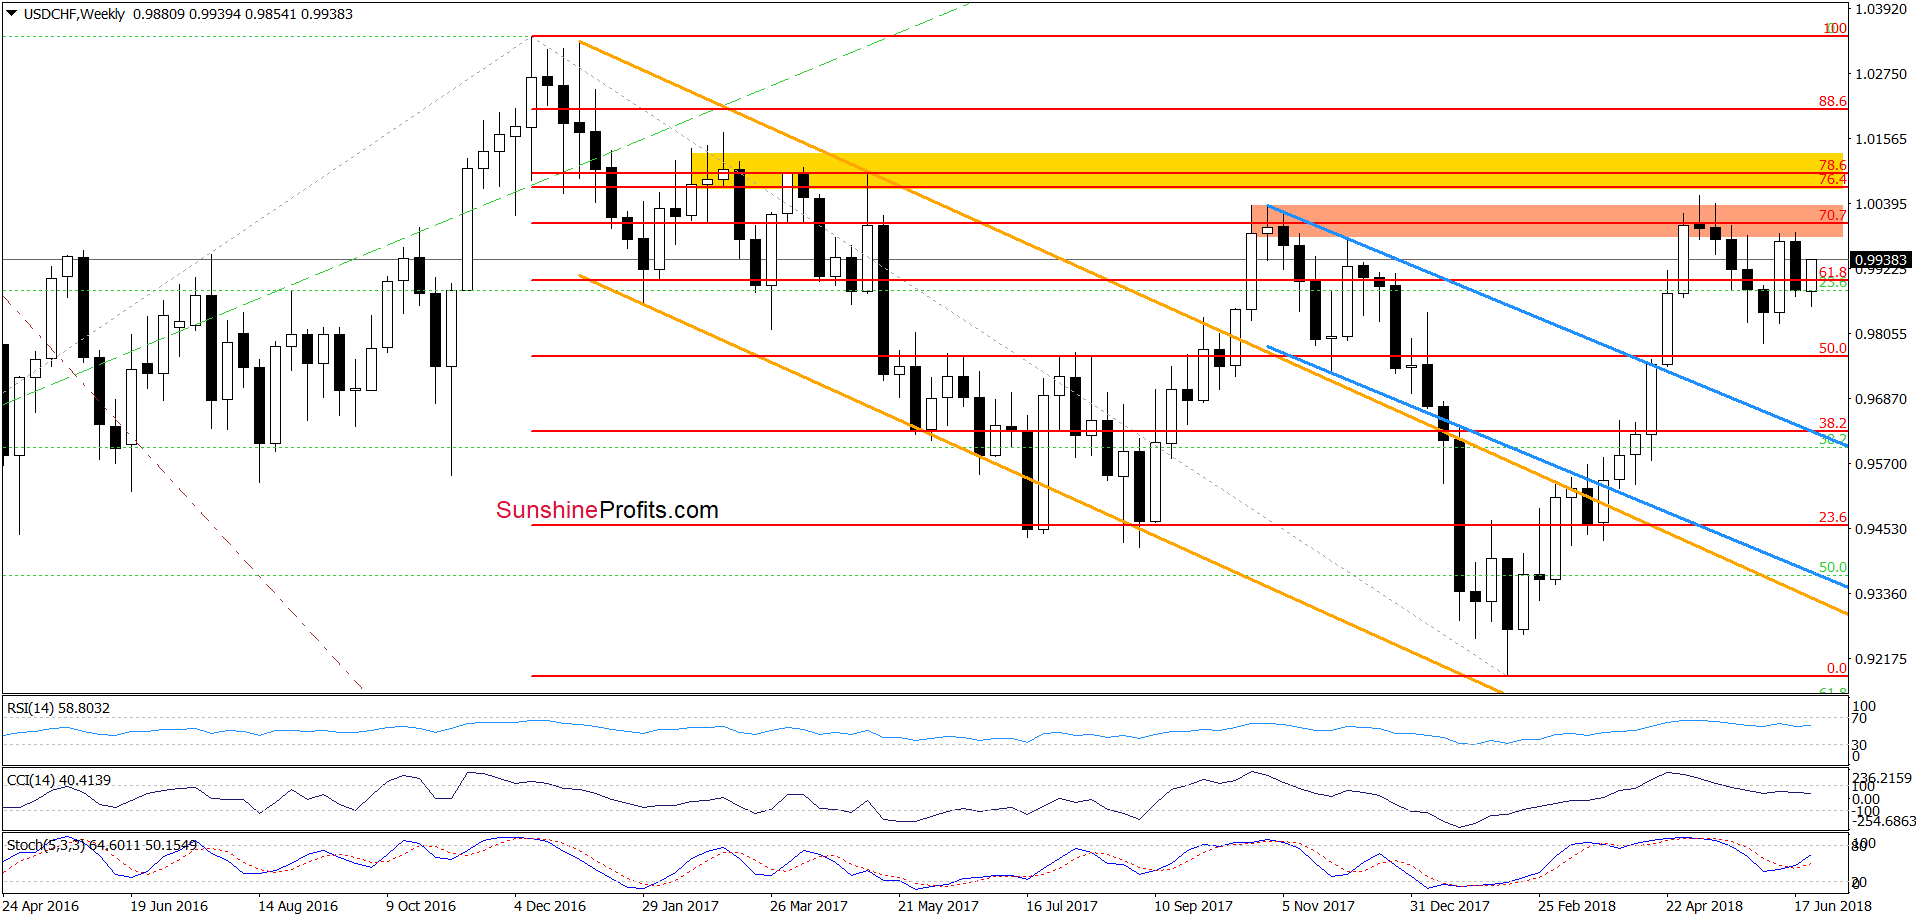
Will we see further improvement? Taking all the above into account, we think that the buyers will try to hit fresh June peak in the coming days. Nevertheless, we should keep in mind that the road to the north is not as easy as it may seem, because even if the pair goes higher from here, currency bulls will have to overcome the yellow resistance zone (marked on the weekly chart below) before they can enjoy significant increases.
Trading position (short-term; our opinion): No positions are justified from the risk/reward perspective. We will keep you informed should anything change, or should we see a confirmation/invalidation of the above.
Thank you.
Nadia Simmons
Forex & Oil Trading Strategist
Przemyslaw Radomski, CFA
Founder, Editor-in-chief, Gold & Silver Fund Manager
Gold & Silver Trading Alerts
Forex Trading Alerts
Oil Investment Updates
Oil Trading Alerts

