

Yesterday, GBP/USD moved higher and invalidated the earlier breakdown under the medium-term line, closing the day above it. Positive development? Yes, if only currency bulls…
In our opinion the following forex trading positions are justified - summary:
- EUR/USD: short (a stop-loss order at 1.2806; the initial downside target at 1.2186)
- GBP/USD: short (a stop-loss order at 1.4548; the next downside target at 1.3685)
- USD/JPY: none
- USD/CAD: none
- USD/CHF: none
- AUD/USD: short (a stop-loss order at 0.8222; the initial downside target at 0.7743)
EUR/USD
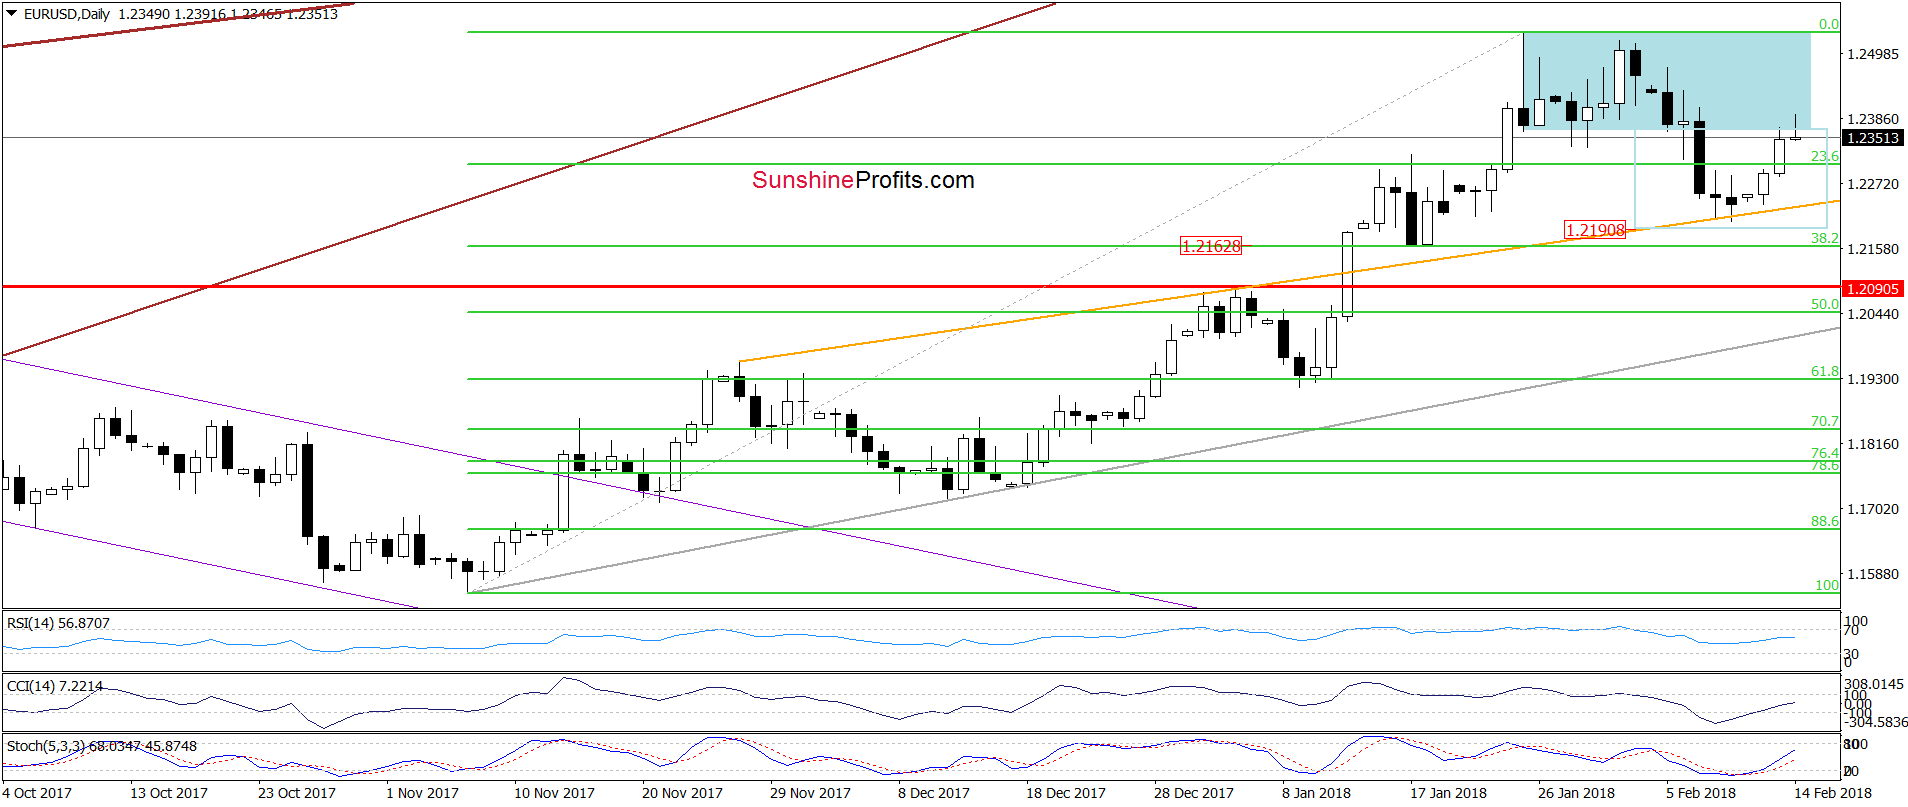
From today’s point of view, we see that the overall situation in the short term hasn’t changed much since our last alert as EUR/USD is still trading below the lower border of the blue consolidation. Therefore, we believe that what we wrote yesterday remains up-to-date:
(...) the exchange rate remains under the previously-broken lower border of the blue consolidation, which means that as long as there is no invalidation of the breakdown under this line all upswings will be nothing more than a verification of the earlier breakdown.
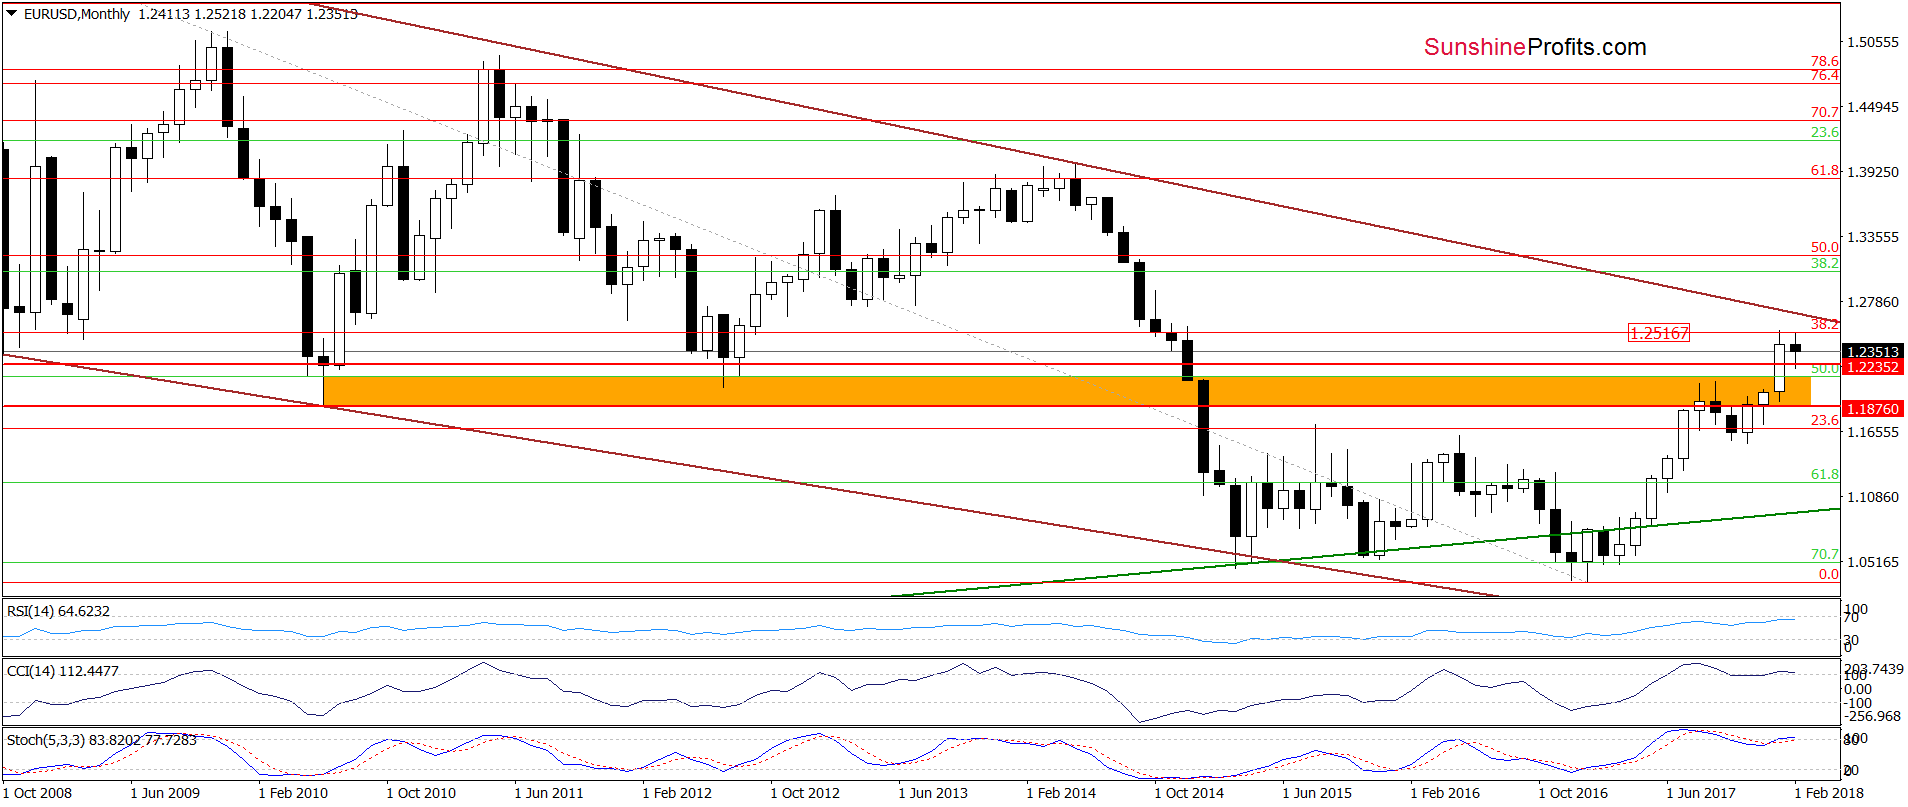
Additionally, when we zoom out our picture, we’ll see (...) that EUR/USD is still trading below the 38.2% Fibonacci retracement, which means that an invalidation of the earlier tiny breakout above this resistance and its negative impact on the exchange rate are still in effect.
On top of that, the current position of the long-term indicators (they are very close to generating the sell signals) increases the probability of further deterioration in the coming days.
Trading position (short-term; our opinion): Short positions (with a stop-loss order at 1.2806 and the initial downside target at 1.2186) are justified from the risk/reward perspective. We will keep you informed should anything change, or should we see a confirmation/invalidation of the above.
GBP/USD
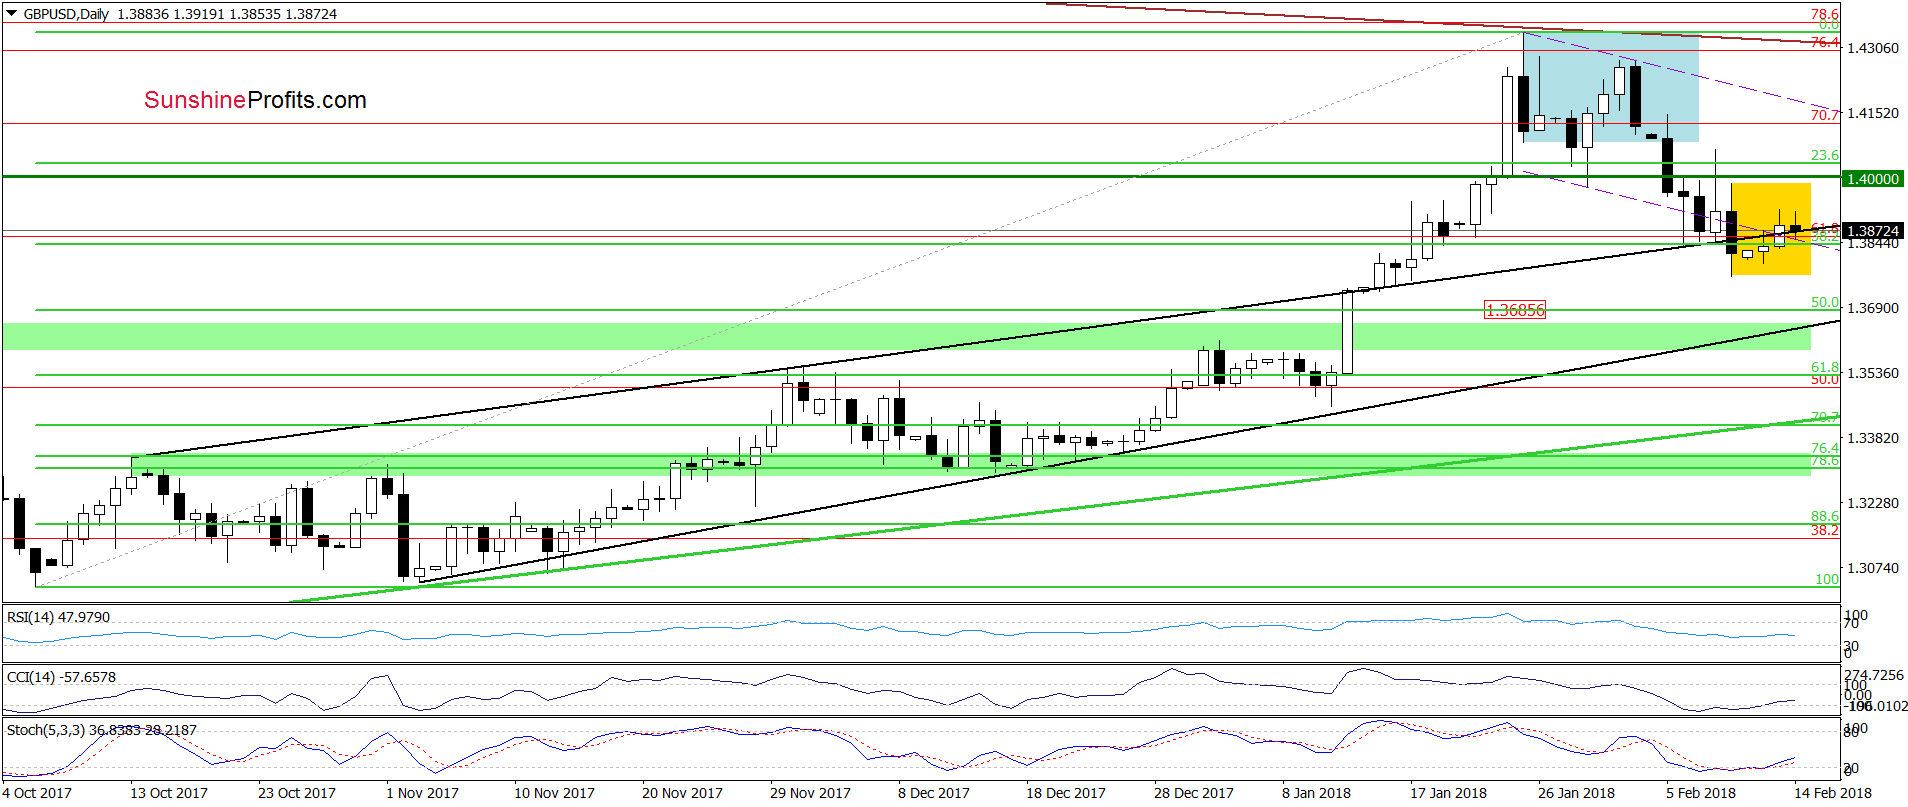
On the daily chart, we see that currency bulls pushed GBP/USD higher and invalidated the earlier breakdown under the upper border of the black rising trend channel yesterday. Despite this positive event and the buy signals generated by the indicators, they didn’t manage to trigger further improvement (even to the first resistance – the upper border of the yellow consolidation), which showed their clear weakness.
As a result, their opponents took control and took the exchange rate lower earlier today.
Taking the above price action into account we think that a daily closure under the black line is very likely later today. Therefore, in our opinion, if the situation develop in line with our assumptions, the pair will likely not only test the lower border of the yellow consolidation (created by the last week’s low), but also drop to around 1.3685, where the 50% Fibonacci retracement (based on the entire October-January upward move) is.
This pro-bearish scenario is also reinforced by the long-term picture of GBP/USD.
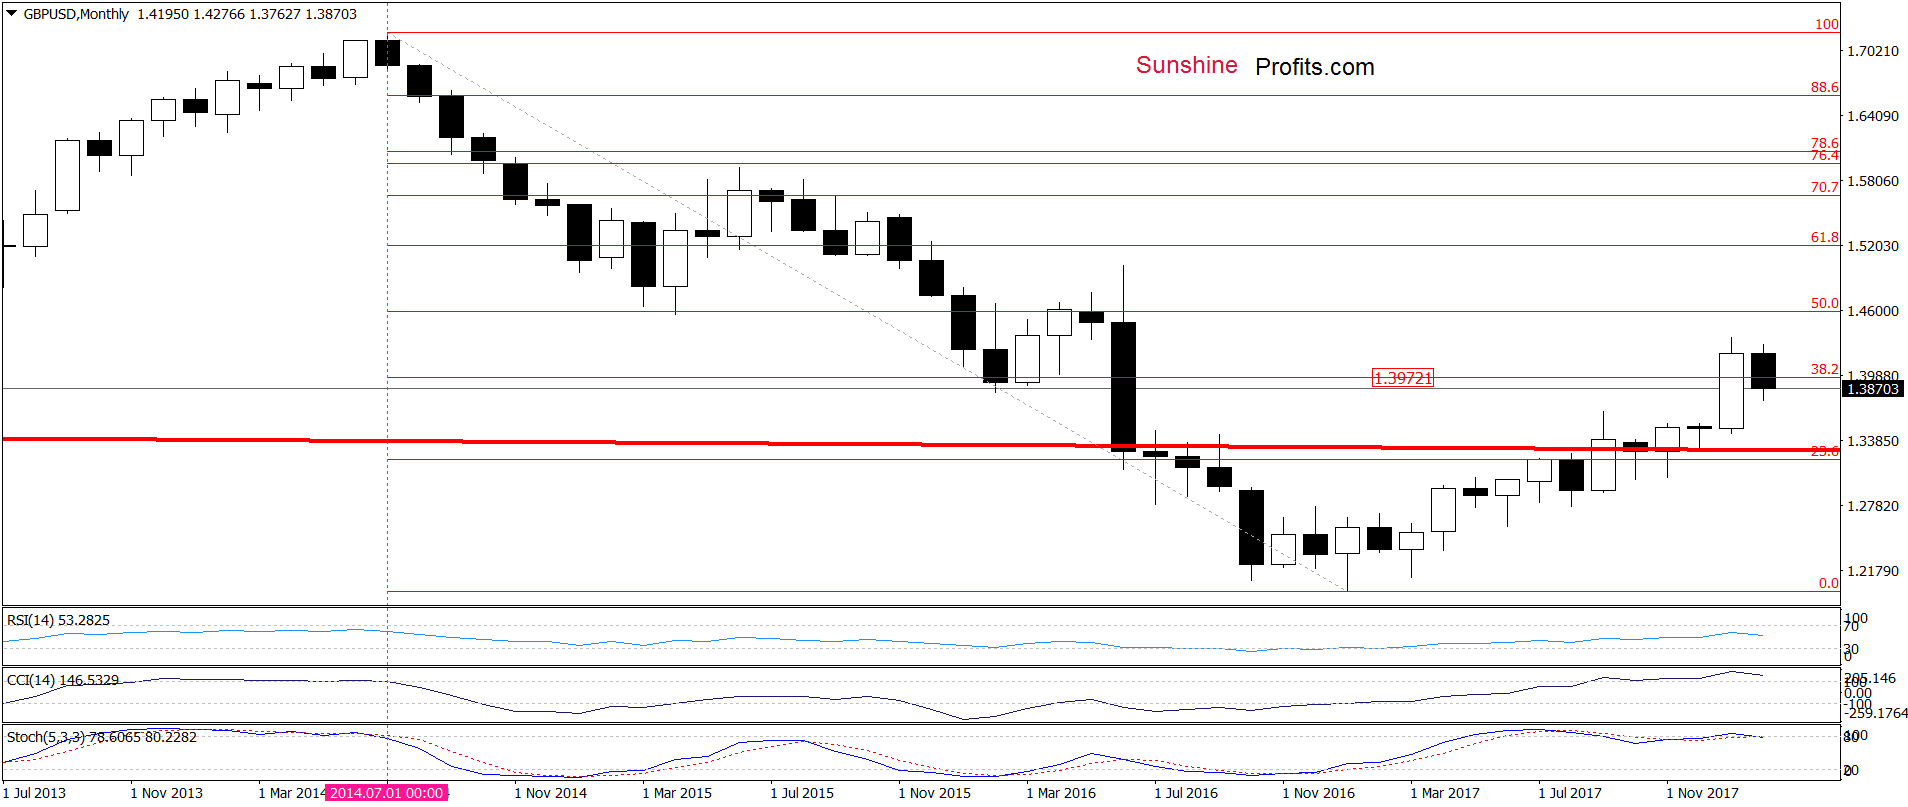
As you see from the broader perspective, the pair invalidated the earlier breakout above the 38.2% Fibonacci retracement, which is a bearish development. Additionally, all indicators are very close to generating the sell signals, which increases the probability of a bigger move to the downside later this month.
Trading position (short-term; our opinion): Short positions (with a stop-loss order at 1.4548 and the next downside target at 1.3685) are justified from the risk/reward perspective. We will keep you informed should anything change, or should we see a confirmation/invalidation of the above.
USD/CAD
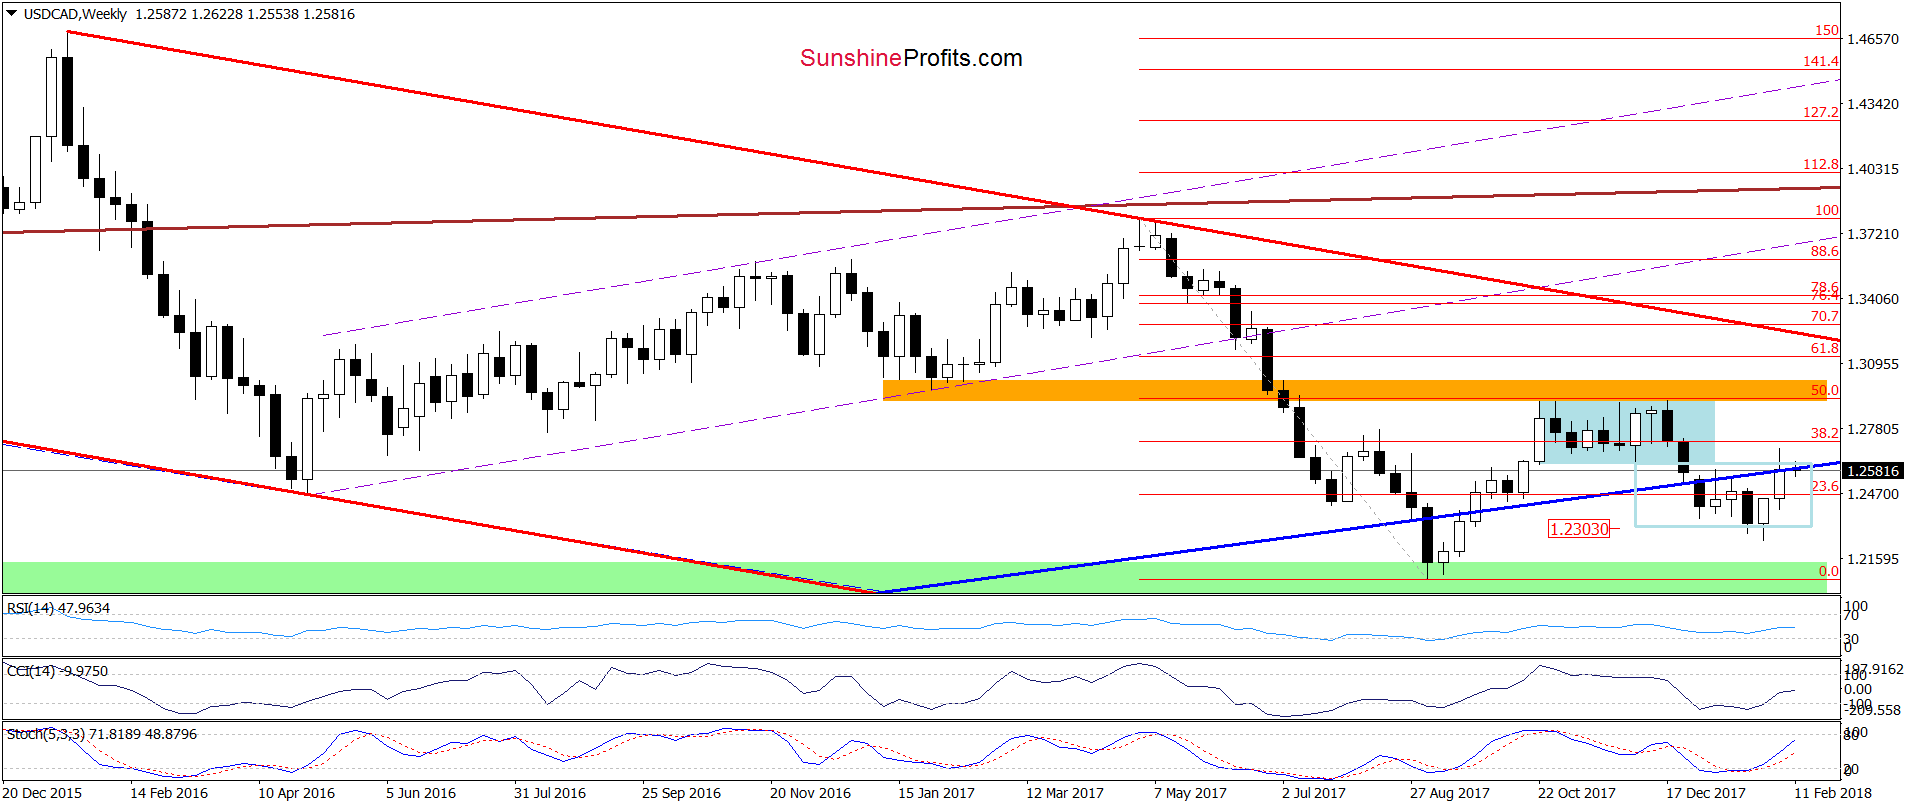
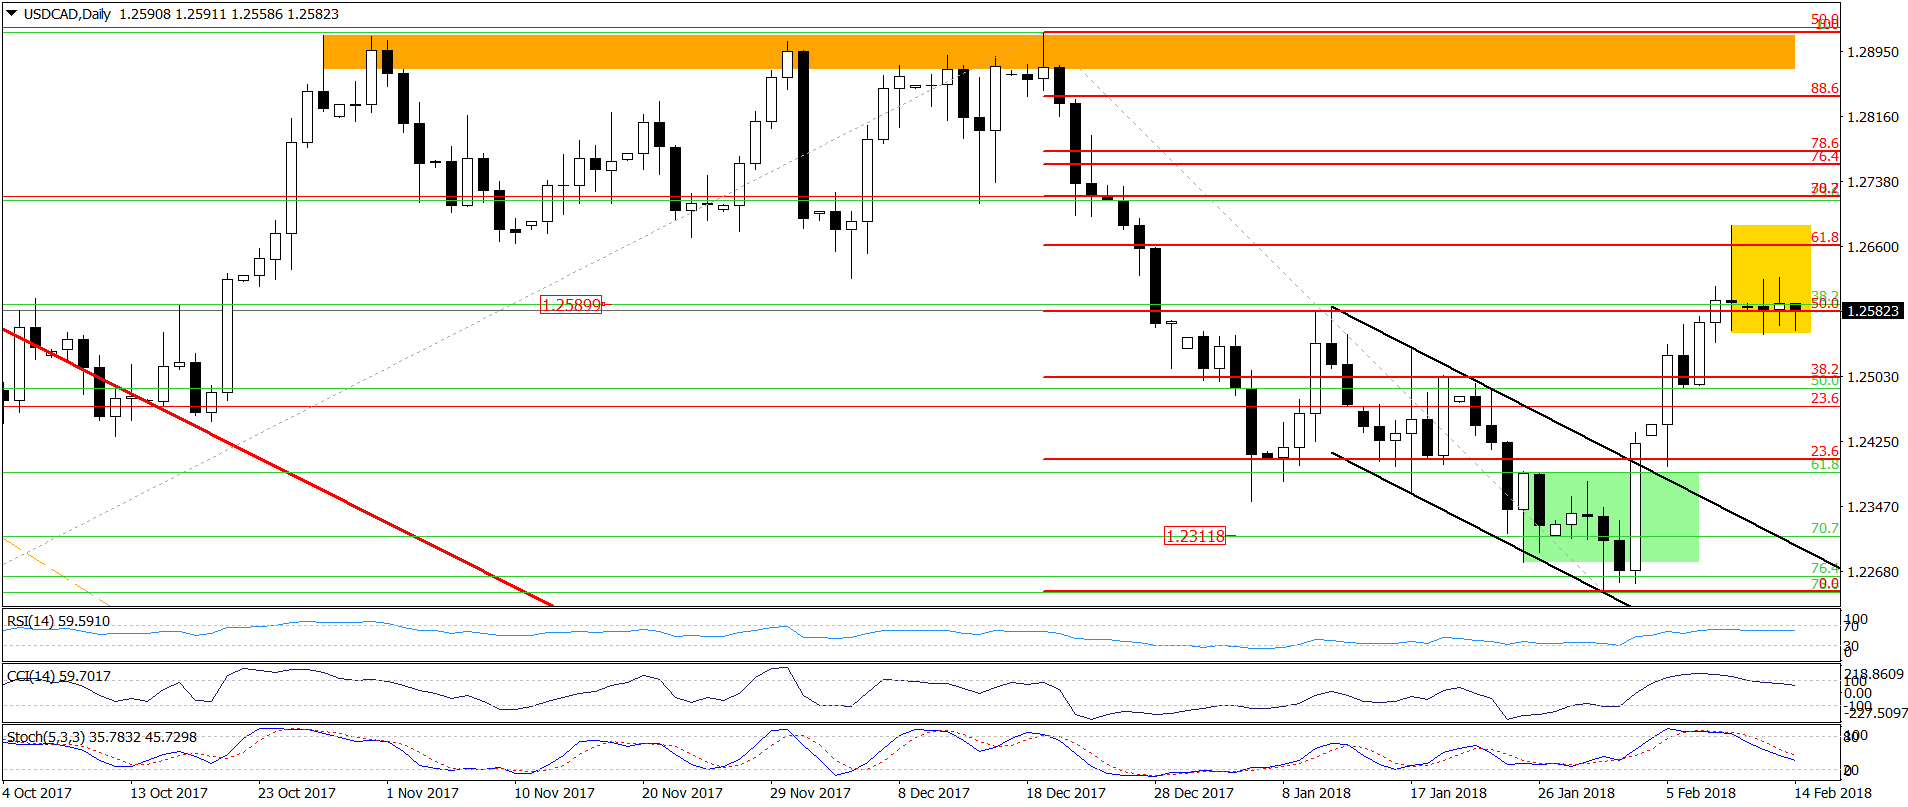
Looking at the above charts, we see that USD/CAD remains in a yellow consolidation, which means that the comments that we made on Monday are still valid:
(...) all daily indicators generated the sell signals, suggesting further declines in the coming week. This pro bearish scenario is also reinforced by the medium-term picture of the exchange rate. Why? (...) the last week’s increase took USD/CAD to the previously-broken blue support/resistance line. When we take a closer look at the chart we see that this line was strong enough to stop currency bulls at the beginning of the previous month, which increases the probability that the history will repeat itself once again in the coming week(s).
Therefore, in our opinion, as long as there is no invalidation of the breakdown under the above-mentioned line all upswings will be nothing more than verifications of the earlier breakdown.
What does it mean for us? If we see a daily closure under the 50% Fibonacci retracement and the January peak (both seen on the daily chart), we’ll consider opening short positions.
Trading position (short-term; our opinion): No positions are justified from the risk/reward perspective now. We will keep you informed should anything change, or should we see a confirmation/invalidation of the above.
Thank you.
Nadia Simmons
Forex & Oil Trading Strategist
Przemyslaw Radomski, CFA
Founder, Editor-in-chief, Gold & Silver Fund Manager
Gold & Silver Trading Alerts
Forex Trading Alerts
Oil Investment Updates
Oil Trading Alerts

