

Third time lucky - in these few words we can summarize the recent sessions in GBP/USD. But what does this actually mean for the relationship between the British pound and the greenback?
EUR/USD
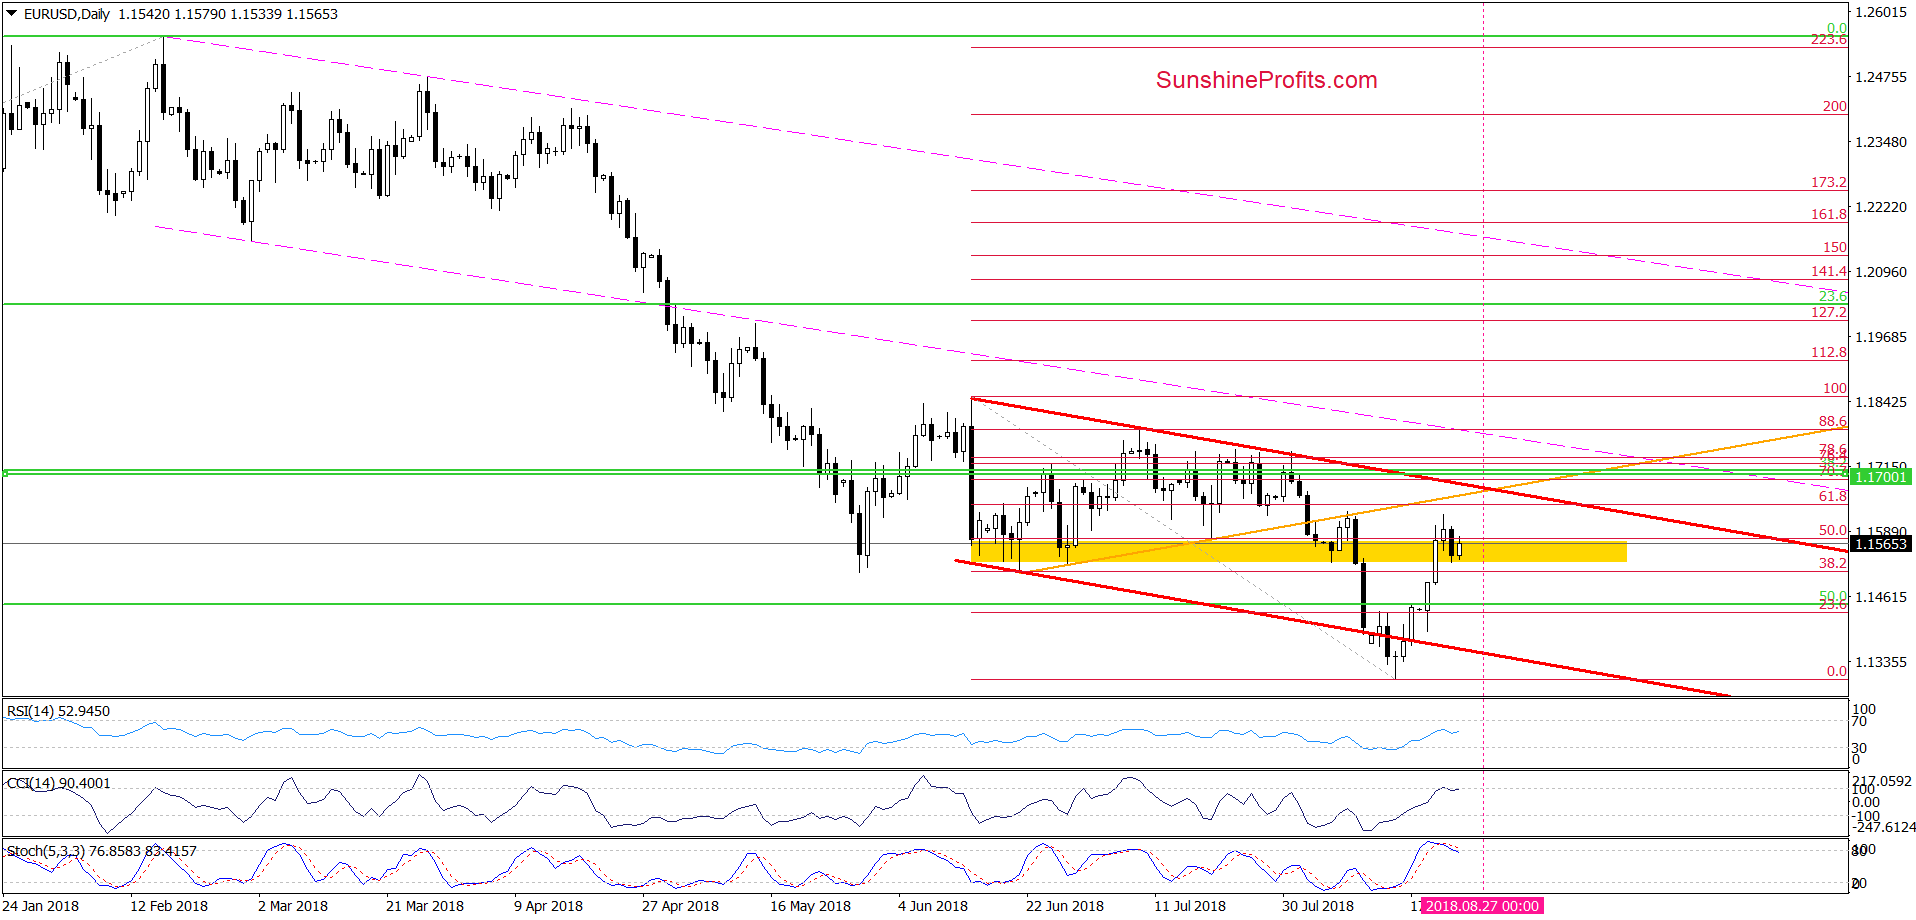
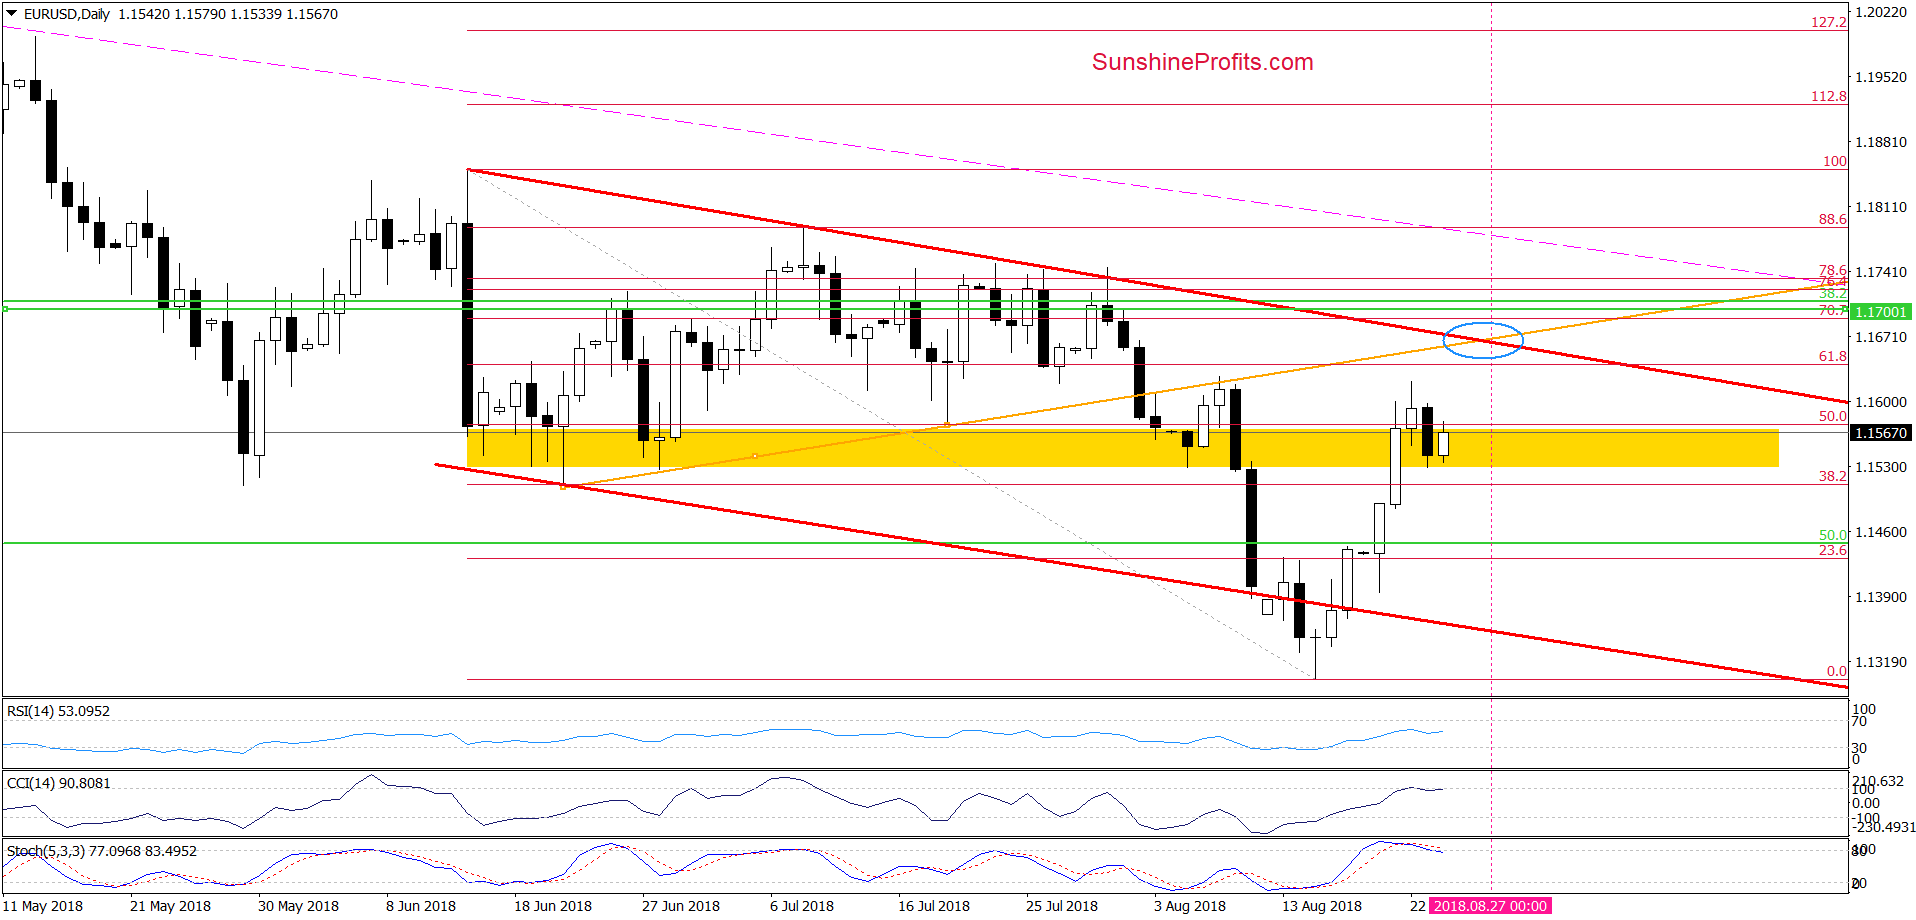
On the daily chart, the yellow zone withstood the selling pressure and currency bulls triggered another upswing earlier today. Taking this fact into account, we continue to believe that further improvement and a test of the 61.8% Fibonacci retracement, the previously-broken orange line of even the upper border of the red declining trend channel (we marked this area with the blue ellipse) is very likely in the following days.
As a reminder, this scenario is also reinforced by the current situation in the USD Index about which we wrote on Wednesday:
Trading position (short-term; our opinion): Connecting the dots, no positions are justified from the risk/reward perspective. We will keep you informed should anything change, or should we see a confirmation/invalidation of the above.
GBP/USD
Quoting our last commentary on this currency pair:
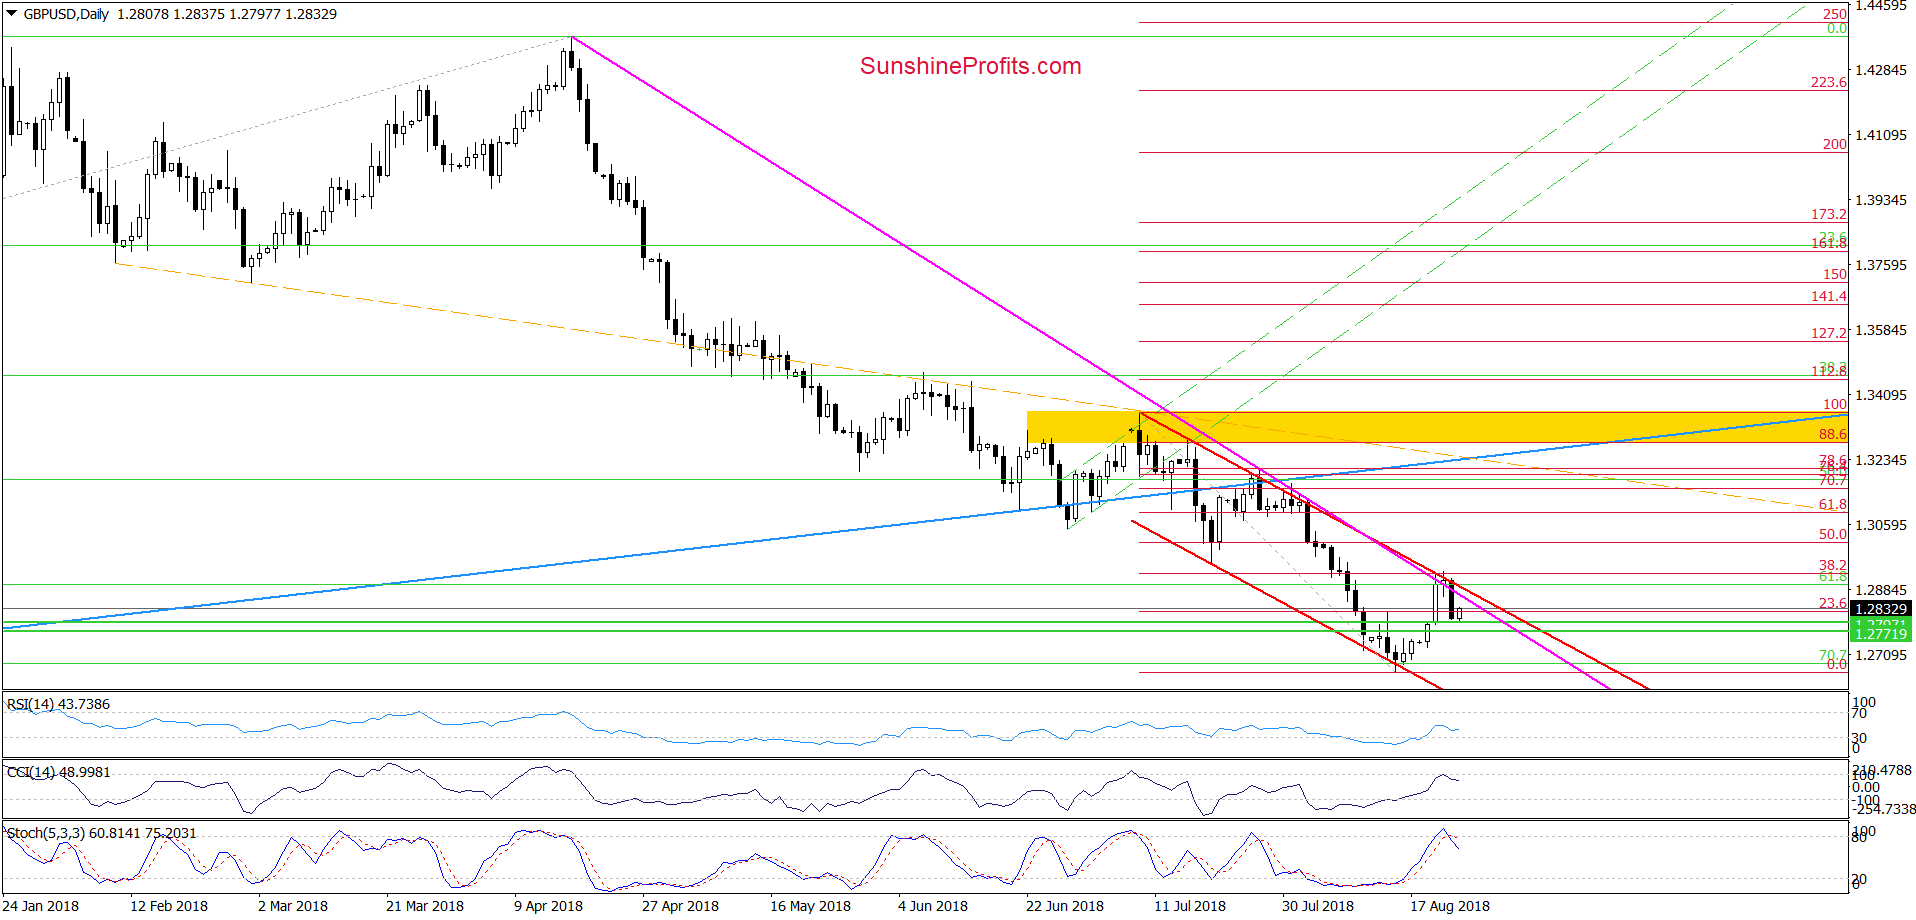
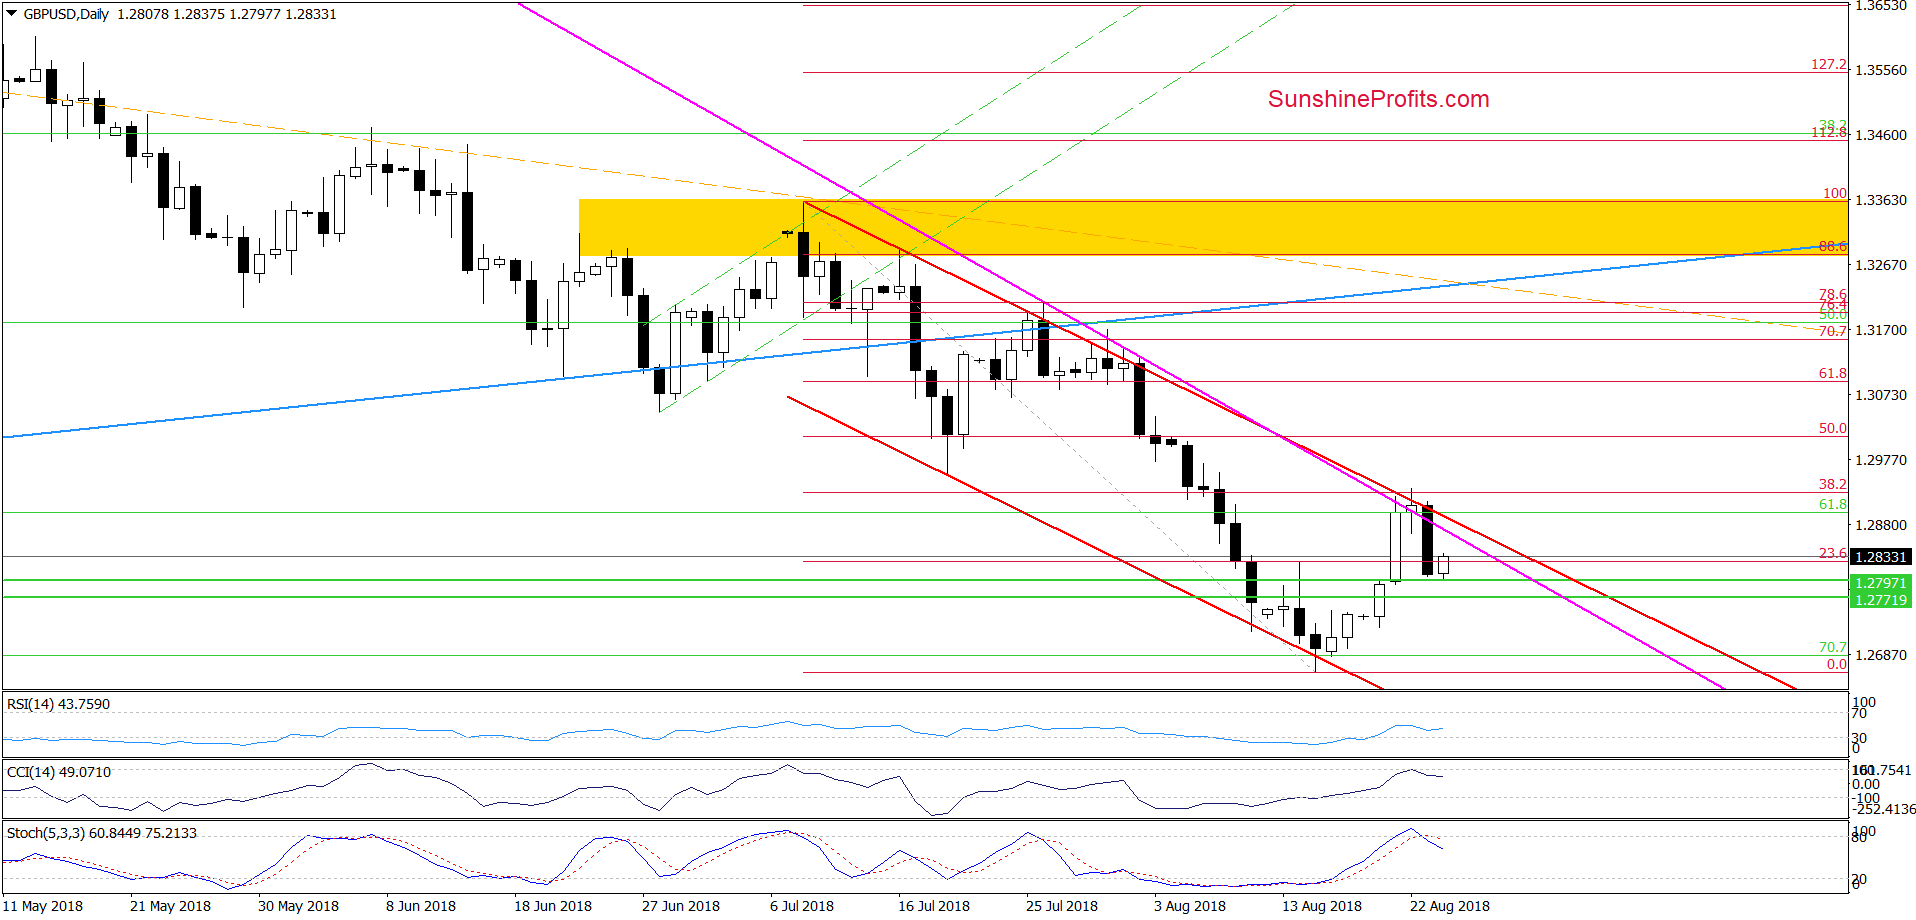
(…) GBP/USD climbed to the first solid resistance zone created by the 38.2% Fibonacci retracement (based on the July-August declines), the upper border of the red declining trend channel and the medium-term pink declining line based on the April and late-July peaks.
What does it mean for GBP/USD? In our opinion, as long as there is no breakout above it, higher values of the exchange rate are not likely to be seen. (…)
From today’s point of view, we see that the combination of the above-mentioned resistances stopped the buyers yesterday. After third unsuccessful attempt to go higher, currency bears showed their claws and triggered a quite sharp move to the downside.
Although earlier today, the exchange rate rebounded a bit, we continue to think that as long as there is no breakout above the upper line of the red declining trend channel and the medium-term pink declining line a bigger move to the upside is doubtful (especially when we factor in the sell signals generated by the CCI and the Stochastic Oscillator).
Nevertheless, taking into account the current situation in EUR/USD and the USD Index (they still have space for growing/declining to their upside/downside targets), it seems to us that we’ll see another test of the abovementioned lines before GBP/USD starts another trip to the south (most likely on Monday).
If the situation develops in line with this scenario, we’ll likely re-open short positions at the beginning of the next week. Stay tuned.
Trading position (short-term; our opinion): No positions are justified from the risk/reward perspective. We will keep you informed should anything change, or should we see a confirmation/invalidation of the above.
USD/JPY
On Monday, we wrote the following:
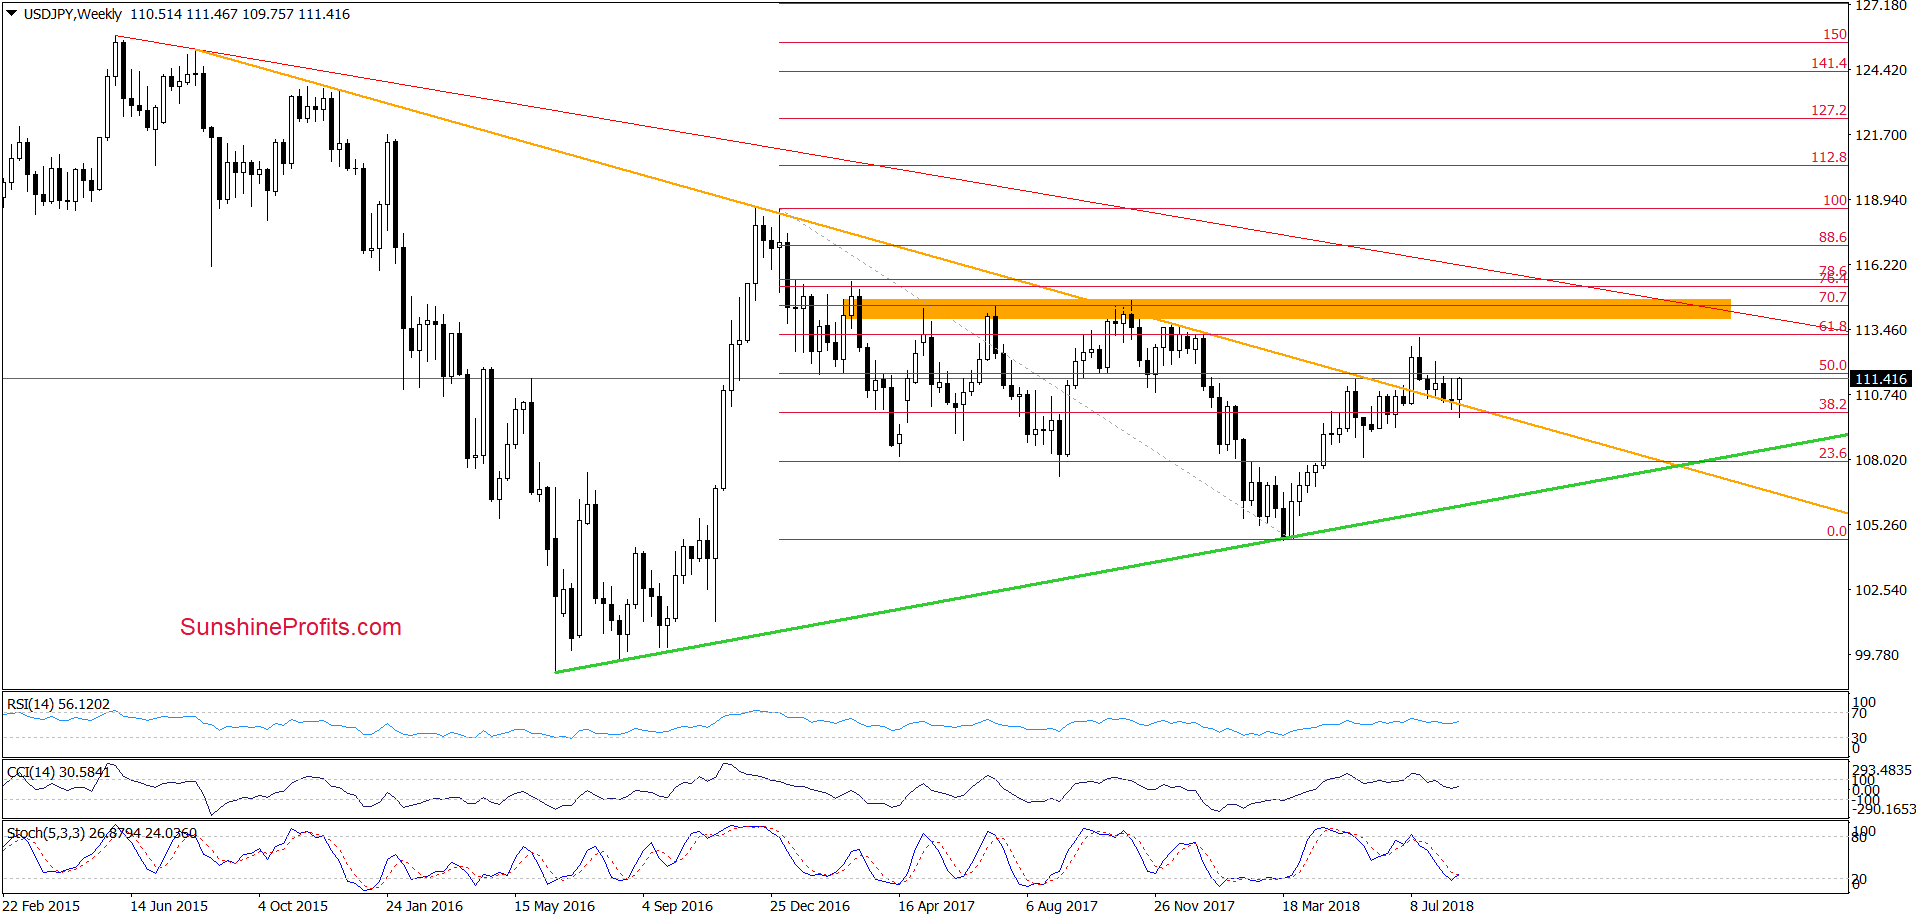
(…) as long as the buyers’ strong and solid ally (the long-term orange support line seen more clearly on the weekly chart below) continues to keep declines in check a sizable move to the downside is not likely to be seen.
(…) please note that USD/JPY closed the previous week above this very important support line, which looks like another verification of the earlier breakout. Therefore, as long as there is no weekly closure under this line one more reversal from here should not surprise us.
Looking at the above chart, we see that the situation developed in tune with our assumptions and USD/JPY bounced off the above-mentioned major support earlier this week.
How did this increase affect the very short-term chart? Let’s check.
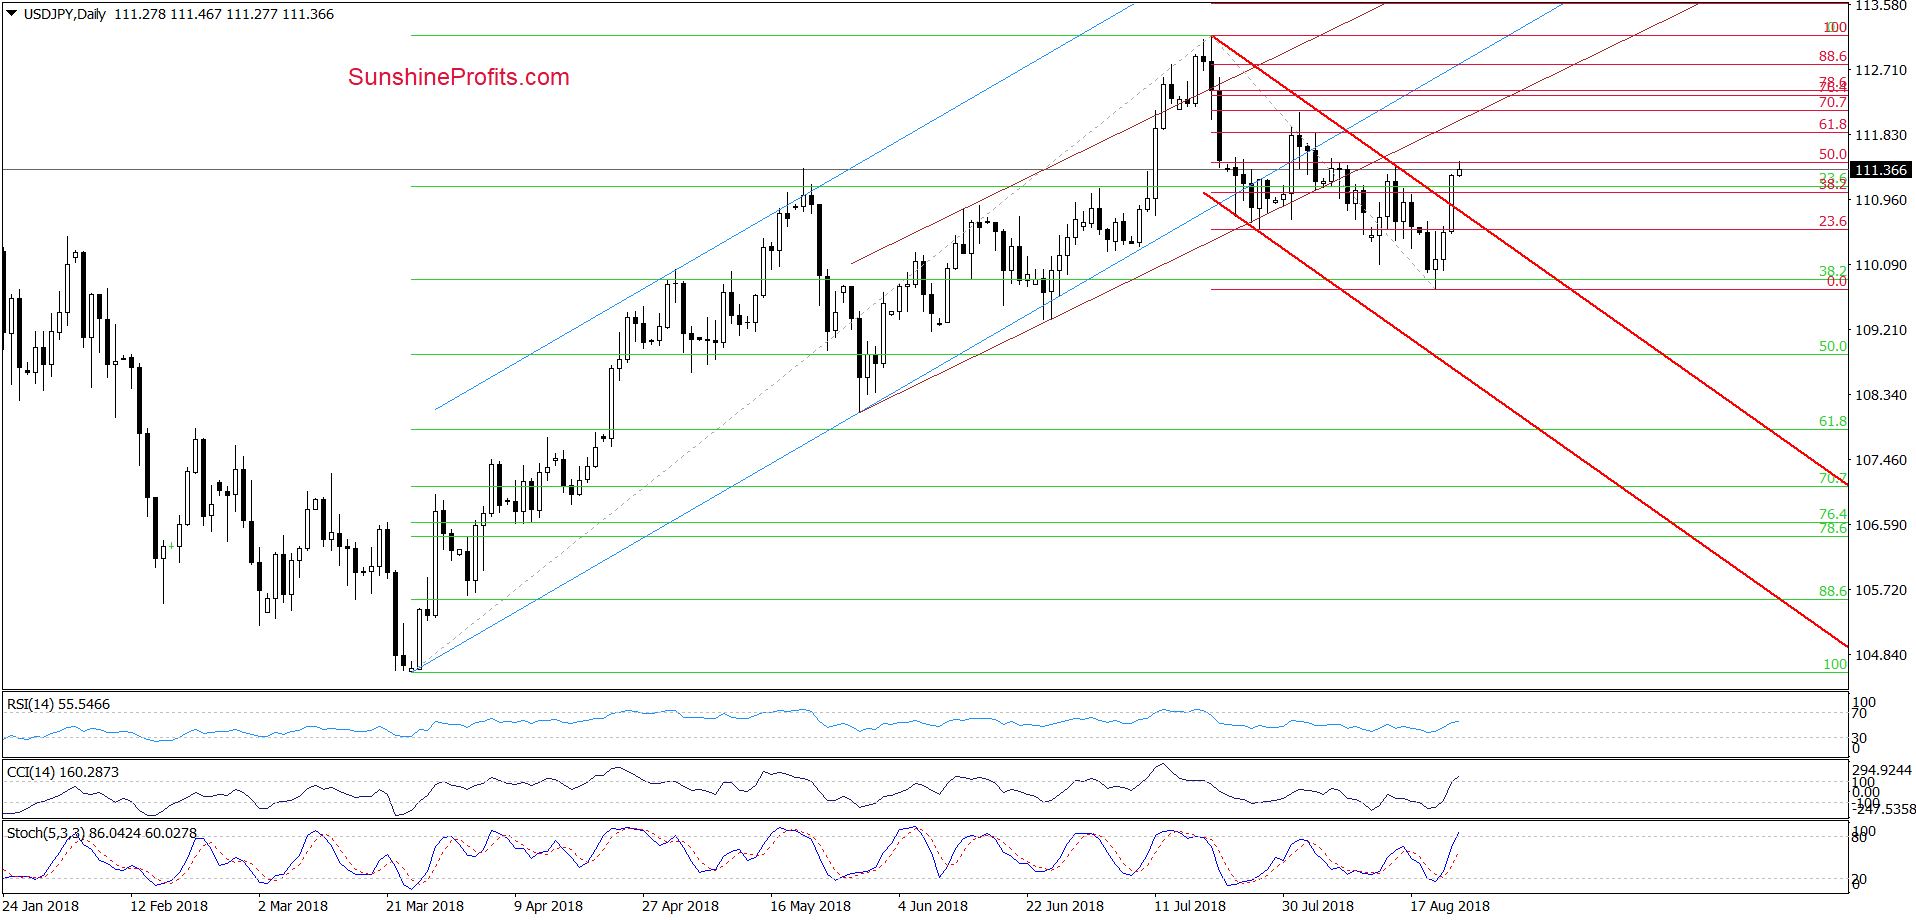
The first thing that catches the eye on the daily chart is a breakout above the upper border of the red declining trend channel, which took place during yesterday’s session.
Thanks to this increase, the pair also broke above the 38.2% Fibonacci retracement (based on the entire July-August decline), which encouraged currency bulls to fight earlier today.
As a result, the exchange rate climbed to the next retracement, which together with the buy signals generated by the daily indicators and the medium-term picture suggests that we’ll likely see a test of the 61.8% Fibonacci retracement, early-August highs or even the previously-broken lower border of the brown rising trend channel in the coming day(s).
Trading position (short-term; our opinion): No positions are justified from the risk/reward perspective. We will keep you informed should anything change, or should we see a confirmation/invalidation of the above.
Thank you.
Nadia Simmons
Forex & Oil Trading Strategist
Przemyslaw Radomski, CFA
Founder, Editor-in-chief, Gold & Silver Fund Manager
Gold & Silver Trading Alerts
Forex Trading Alerts
Oil Investment Updates
Oil Trading Alerts

