
The euro extended losses and hit a fresh 11-month low against the greenback as minutes from the Federal Reserve's most recent meeting showed the central bank debating whether to raise interest rates sooner than expected. In this way, EUR/USD approached an important support zone. Will it trigger a corrective upswing? Or maybe it will be the last stop before new lows?
In our opinion the following forex trading positions are justified - summary:
EUR/USD
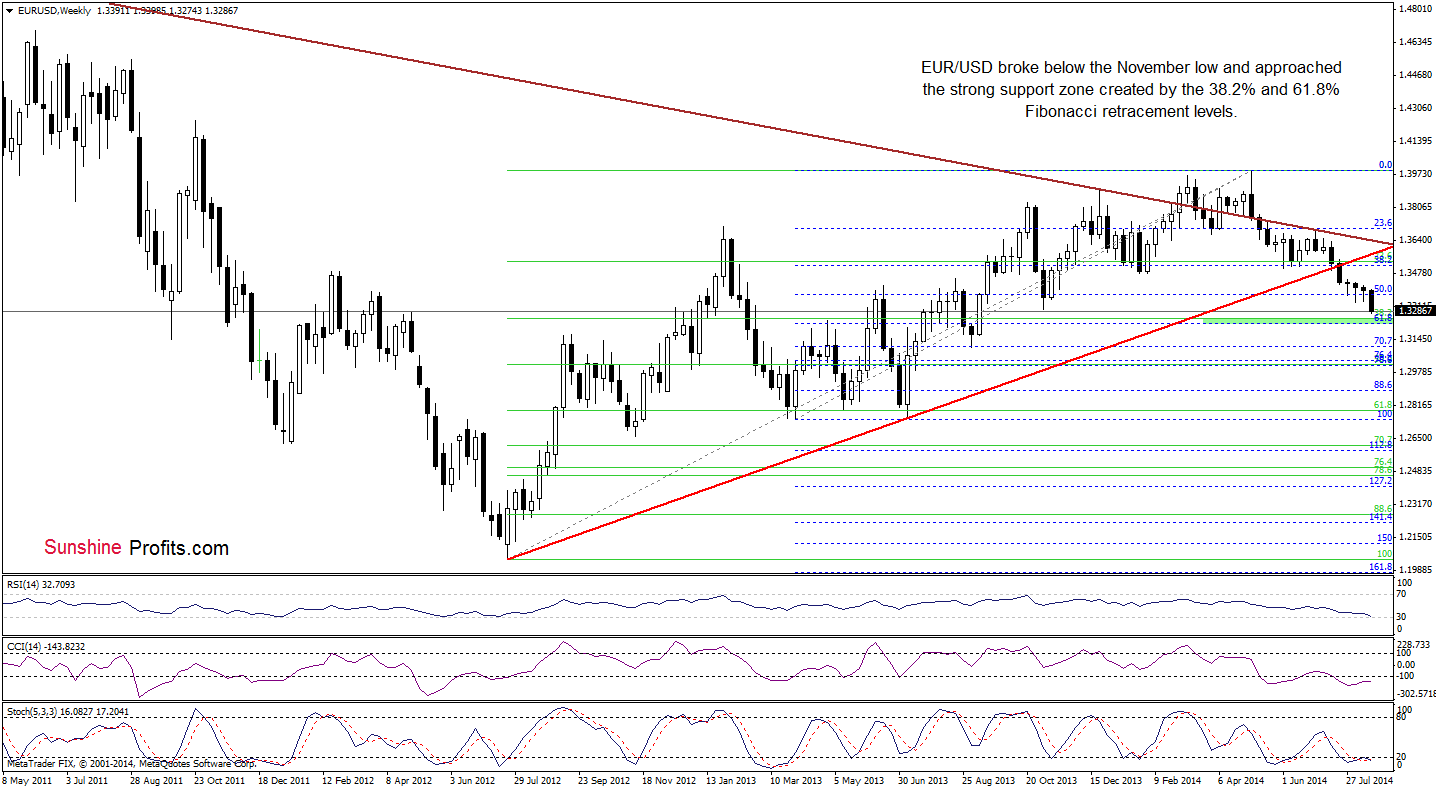
Looking at the above chart, we see that the situation in the medium term has deteriorated as EUR/USD dropped below the November low of 1.3295. Therefore, we believe that our last commentary is up-to-date:
(…) if currency bears show their claws and push the pair below it, EUR/USD will test the strength of the strong support zone created by the 38.2% Fibonacci retracement based on the entire 2012-2014 rally and 61.8% the next Fibonacci retracement (based on the March 2013-May 2014 increase) around 1.3222-1.3250.
Will the daily chart give us more clues about future moves? Let’s check.
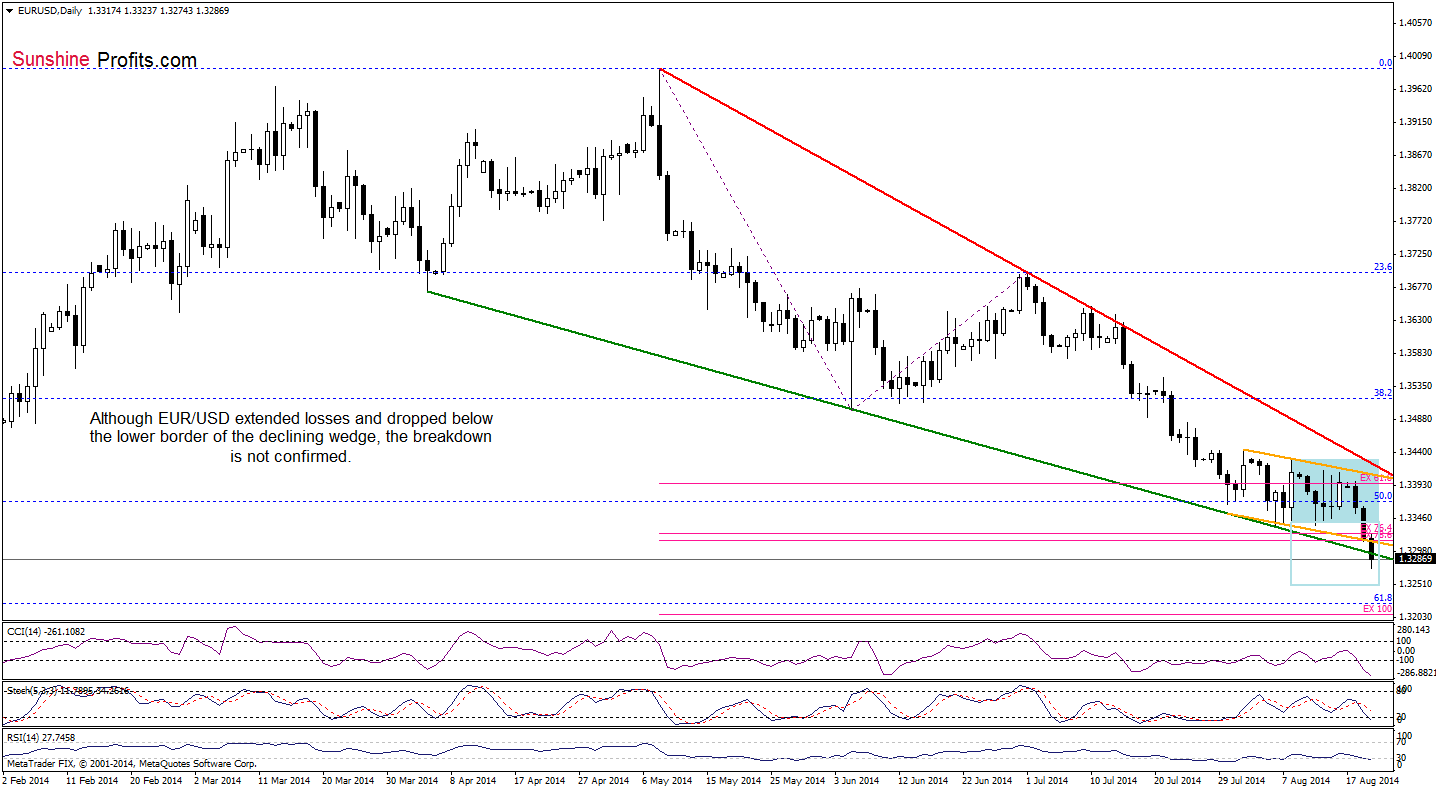
Earlier today, EUR/USD moved lower and broke not only below the 76.4% and 78.6% Fibonacci price projections and the November low, but also under the lower border of the declining wedge. This is a bearish signal, which suggests that the exchange rate will extend losses and (more likely than not) drop to around 1.3254, where the size of the downswing will correspond to the height of the consolidation (marked with blue). At this point, it’s worth noting that this area is reinforced by the green support zone marked on the weekly chart, which may pause or even stop further deterioration.
Very short-term outlook: mixed
Short-term outlook: mixed
MT outlook: mixed
LT outlook: bearish
Trading position (short-term): In our opinion no positions are justified from the risk/reward perspective. We will keep you informed should anything change, or should we see a confirmation/invalidation of the above.
USD/JPY
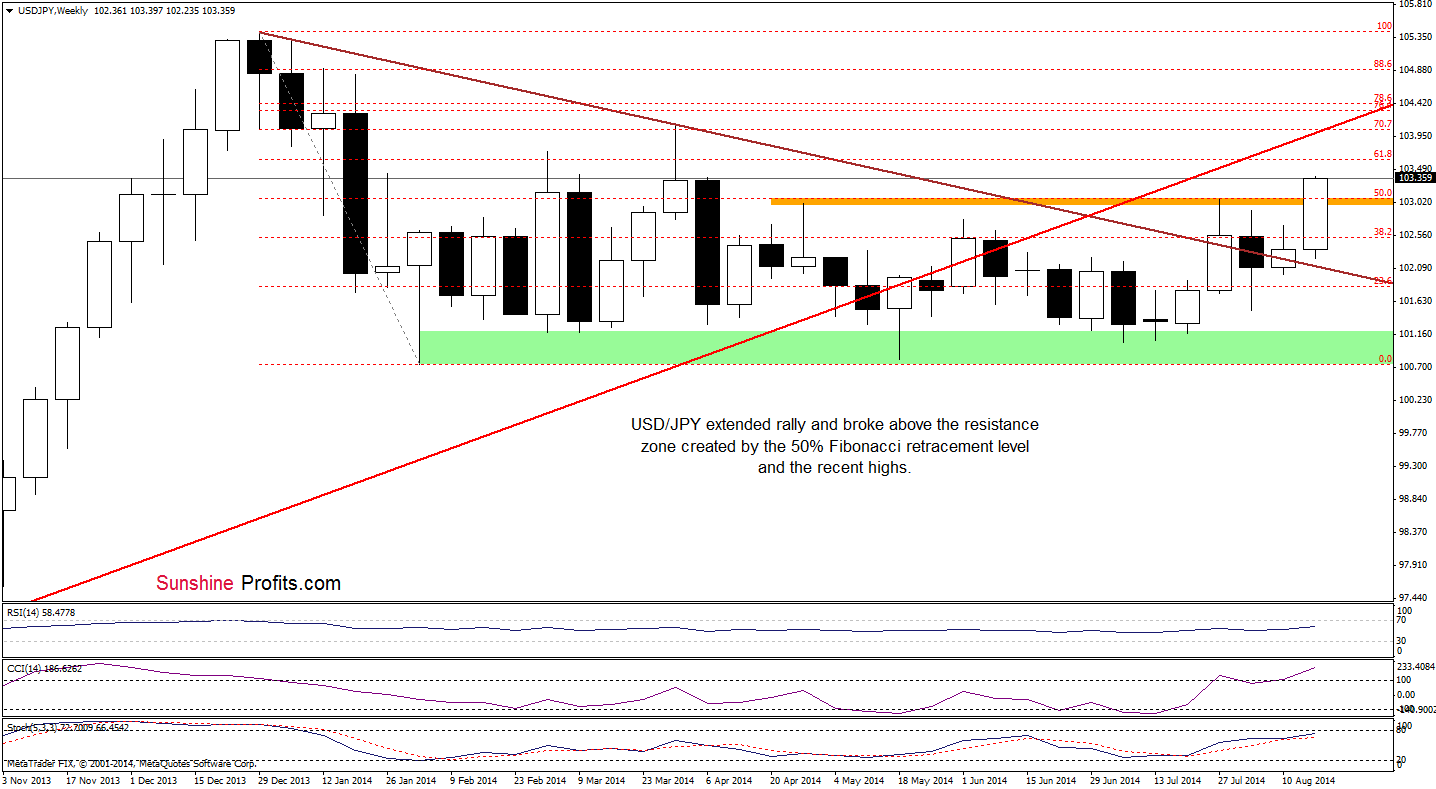
The medium-term picture has improved as USD/JPY bounced off the long-term declining support/resistance line and broke above the orange resistance zone created by the 50% Fibonacci retracement level and the recent highs. This is a bullish development, which suggests that we’ll see further improvement and an increase to (at least) the next Fibonacci retracement or even to the long-term red resistance line, which intersects the 70.7% Fibonacci retracement at the moment.
Once we know the above, let’s examine the daily chart.
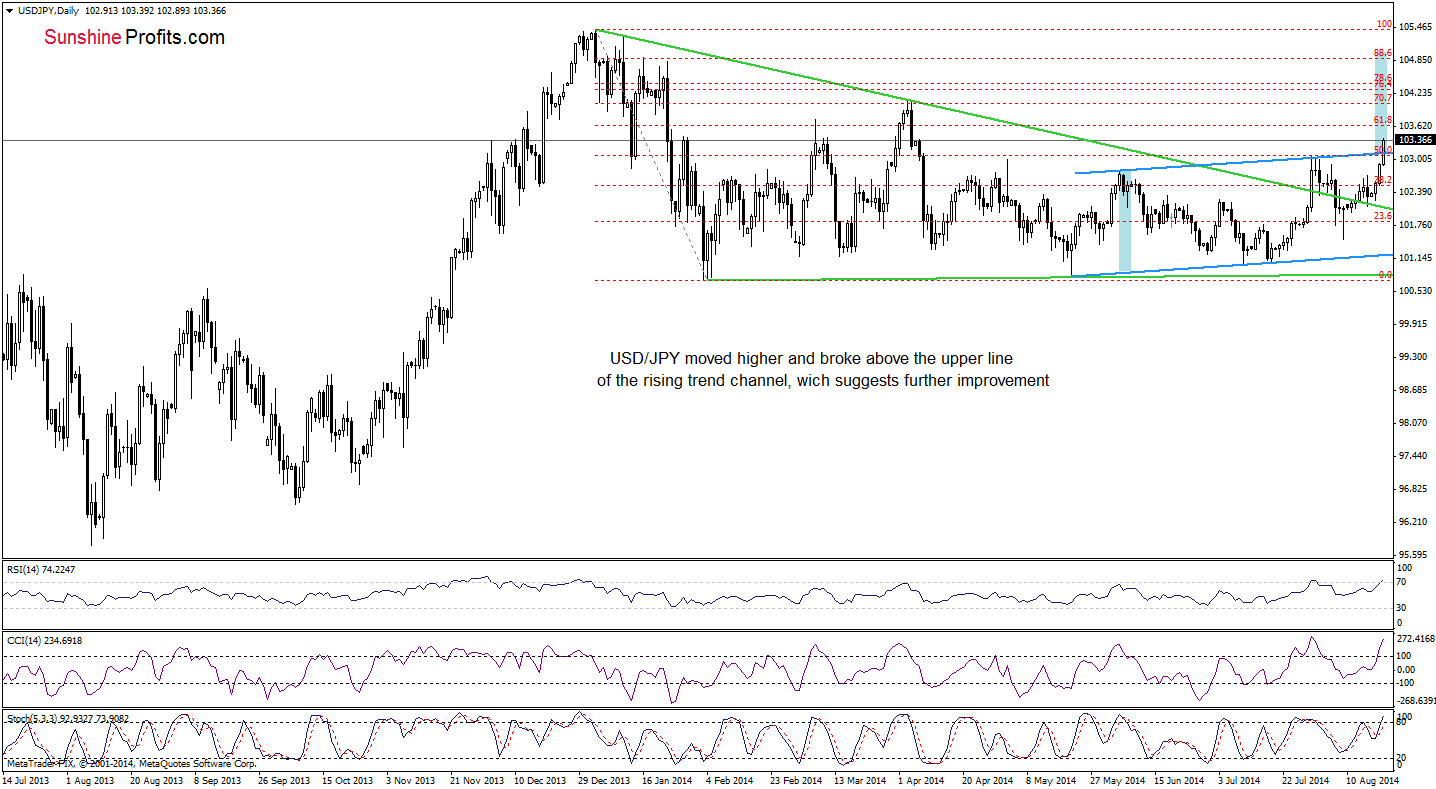
The first thing that catches the eye on the above chart is a breakout above the upper line of the rising trend cannel. This is a strong bullish signal, which will (if it is not invalidated) trigger further improvement in the coming day (or even days). How high could USD/JPY go? As you see on the above chart, if currency bulls do not give up and break above the April high (which is reinforced by the 70.7% Fibonacci retracement), we may see an increase even to around 104.81, where the size of the upswing will correspond to the height of the trend channel. Despite this bullish scenario, we should keep in mind that the RSI climbed above the level of 70, while the CCI and Stochastic Oscillator are overbought, which suggests that a pause (or a pullback) is just around the corner. If this is the case, the pair will likely reverse and come back to the line of the rising trend cannel, which serves as the nearest support.
Very short-term outlook: bullish
Short-term outlook: mixed with bullish bias
MT outlook: mixed
LT outlook: bearish
Trading position (short-term): In our opinion no positions are justified from the risk/reward perspective at the moment. We will keep you informed should anything change, or should we see a confirmation/invalidation of the above.
AUD/USD
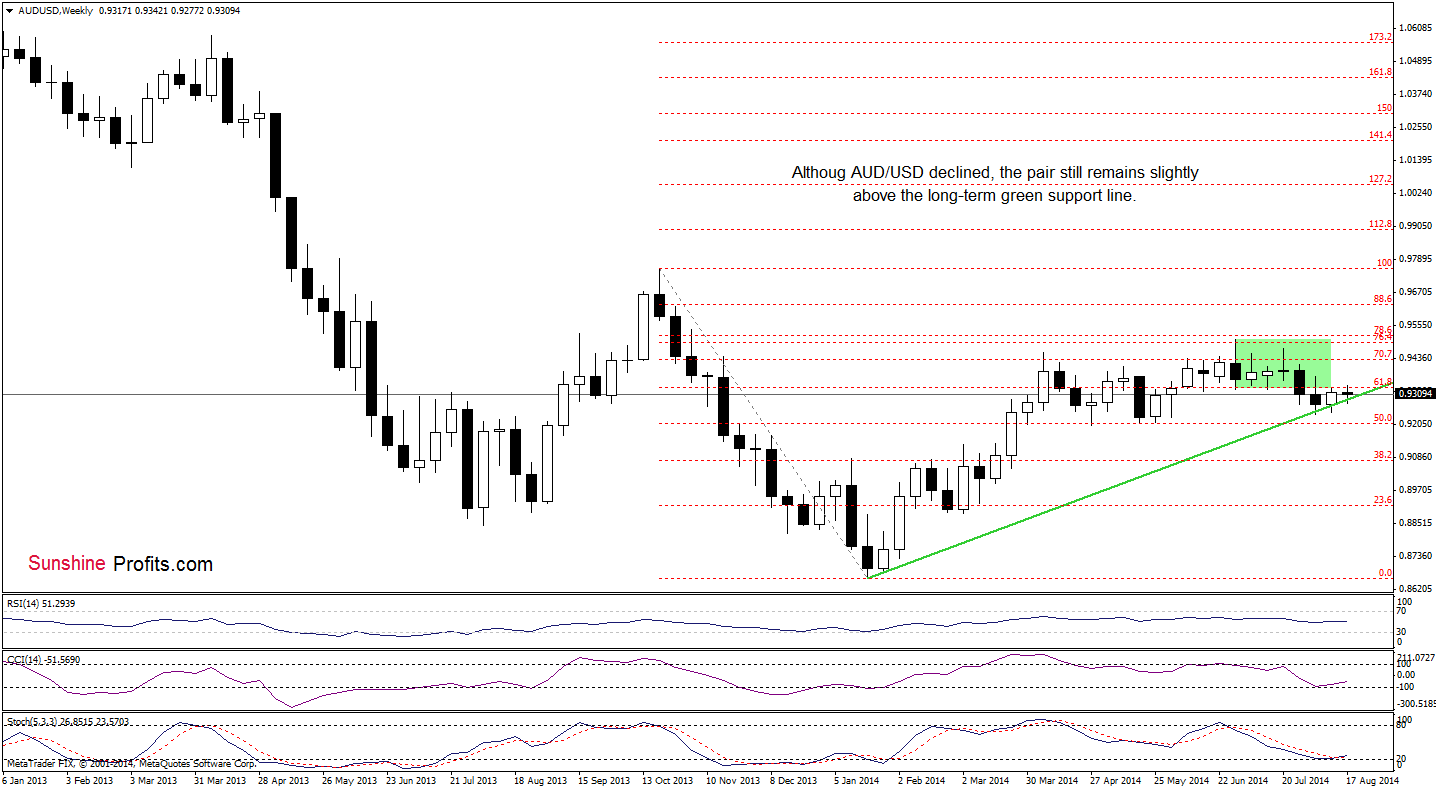
The medium-term picture hasn’t changed much as AUD/USD still remains between the long-term green line and the previously-broken lower border of the consolidation.
Can we infer something more from the daily chart?
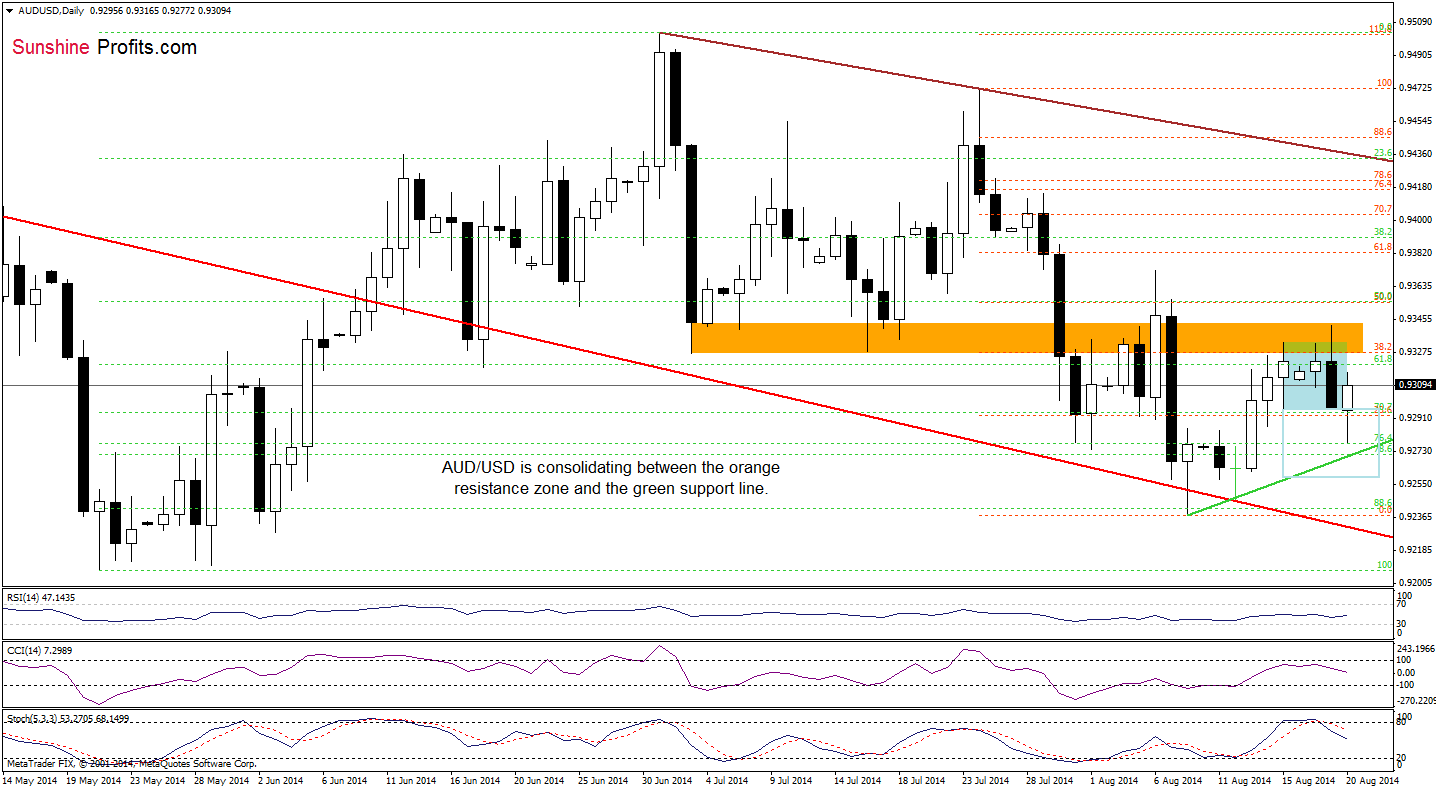
From this perspective, we see that the situation hasn’t changed much since our last commentary on this currency pair was posted. The reason? Although we saw a small breakout above the upper line of the consolidation, currency bulls didn’t manage to push the pair above the orange resistance zone, which resulted in a drop below the lower border of the formation. Despite this deterioration, AUD/USD reversed and came back to the consolidation range. In our opinion, as long as there is no breakout above the upper line of the formation (or a breakdown below the green support line), another sizable move is not likely to be seen. Nevertheless, the current position of the indicators suggests that the next move will be to the downside.
Very short-term outlook: mixed
Short-term outlook: mixed
MT outlook: mixed
LT outlook: bearish
Trading position (short-term): In our opinion, no positions are justified from the risk/reward perspective. We will keep you informed should anything change, or should we see a confirmation/invalidation of the above.
Thank you.
Nadia Simmons
Forex & Oil Trading Strategist
Przemyslaw Radomski, CFA
Founder, Editor-in-chief
Gold & Silver Trading Alerts
Forex Trading Alerts
Oil Investment Updates
Oil Trading Alerts

