

Earlier today, the USD Index extended gains and came back above the level of 100 as political uncertainty pushed the euro sharply lower. In this environment, EUR/USD slipped below 1.0700 and reached the first support zone. What happened with the other currency pairs at the same time?
In our opinion the following forex trading positions are justified - summary:
- EUR/USD: short (a stop-loss order at 1.0957; the initial downside target at 1.0538)
- GBP/USD: short (a stop-loss order at 1.2543; the initial downside target at 1.2260)
- USD/JPY: none
- USD/CAD: long (a stop-loss order at 1.3055; the initial upside target at 1.3302)
- USD/CHF: long (a stop-loss order at 0.9879; the initial upside target at 1.0064)
- AUD/USD: short (a stop-loss order at 0.7723; the initial downside target at 0.7520)
EUR/USD
On Friday, we wrote the following:
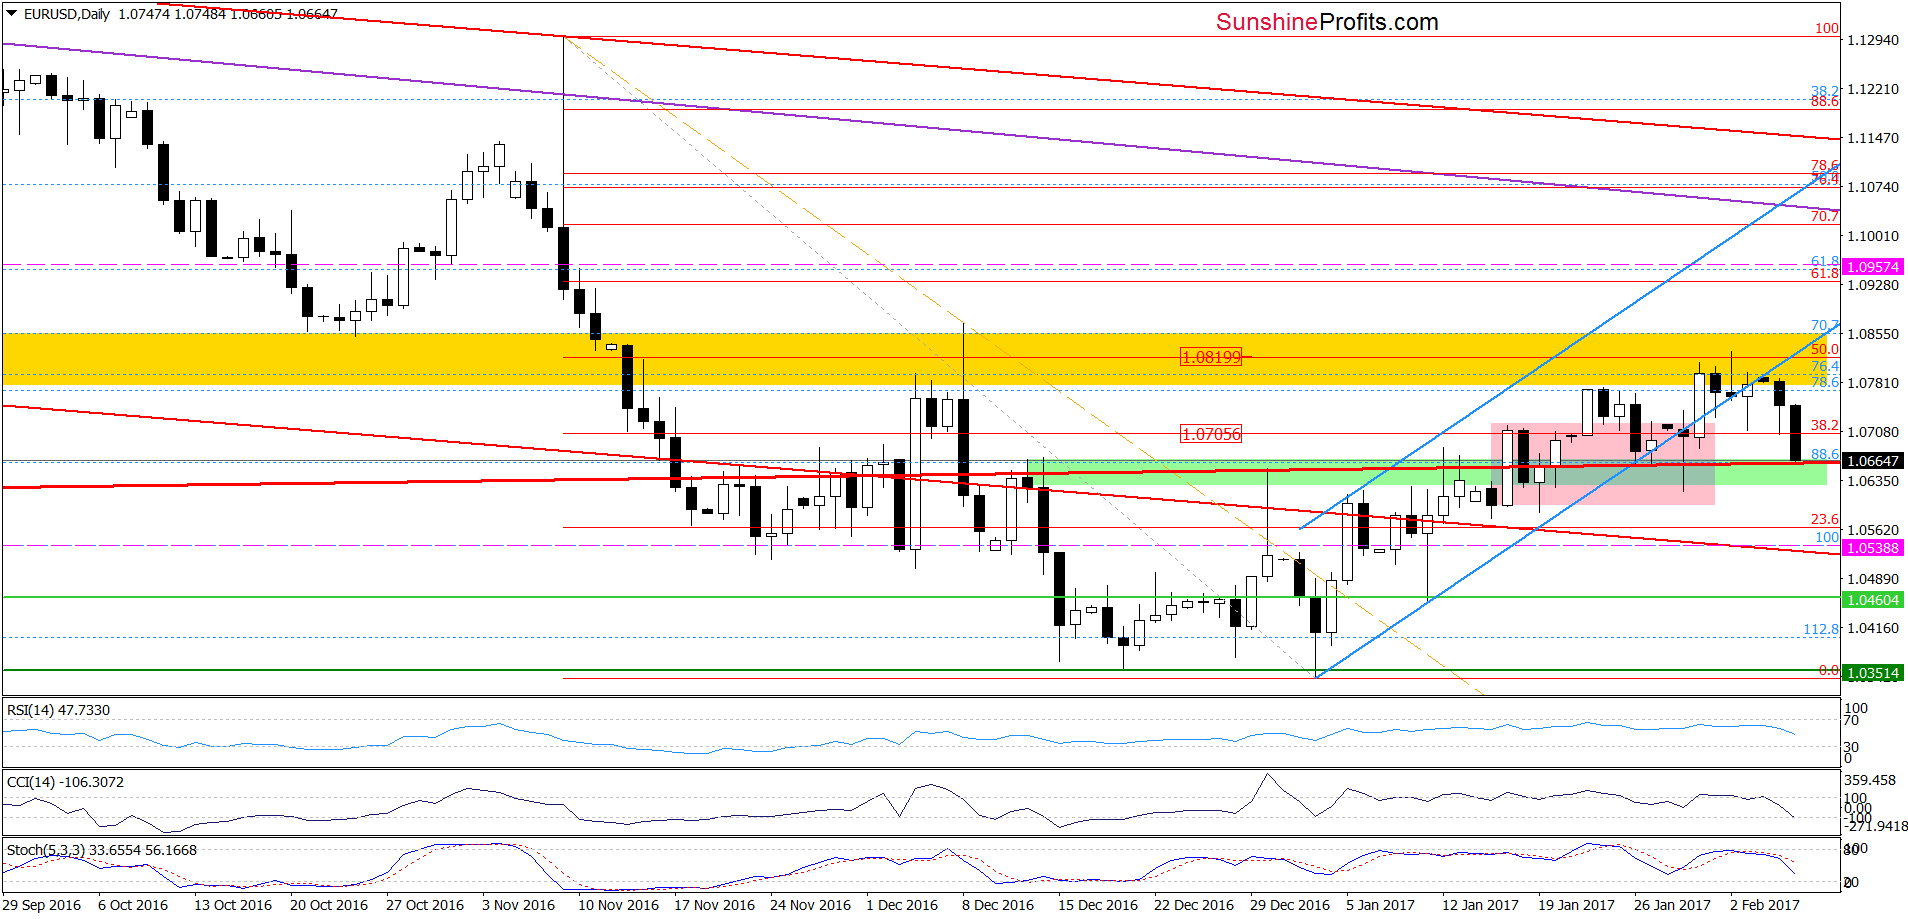
(…) What’s next? Taking into account the breakdown under the lower border of the blue rising trend channel and the sell signals generated by the indicators, we think that the pair will extend losses in the coming days (especially if the exchange rate closes today’s session under this line). If this is the case, the initial downside target will be the green support zone seen on the daily chart.
Looking at the daily chart, we see that the situation developed in line with the above scenario and EUR/USD reached our first downside target earlier today. Although this support could trigger a small rebound from here, the sell signals generated by the indicators are still in play, supporting currency bears and further deterioration. If this is the case and the pair drops under the long-term red support line (seen more clearly on the weekly chart), we’ll see (at least) a test of the lower border of the pink consolidation and the January 19 low of 1.0588 in the following days.
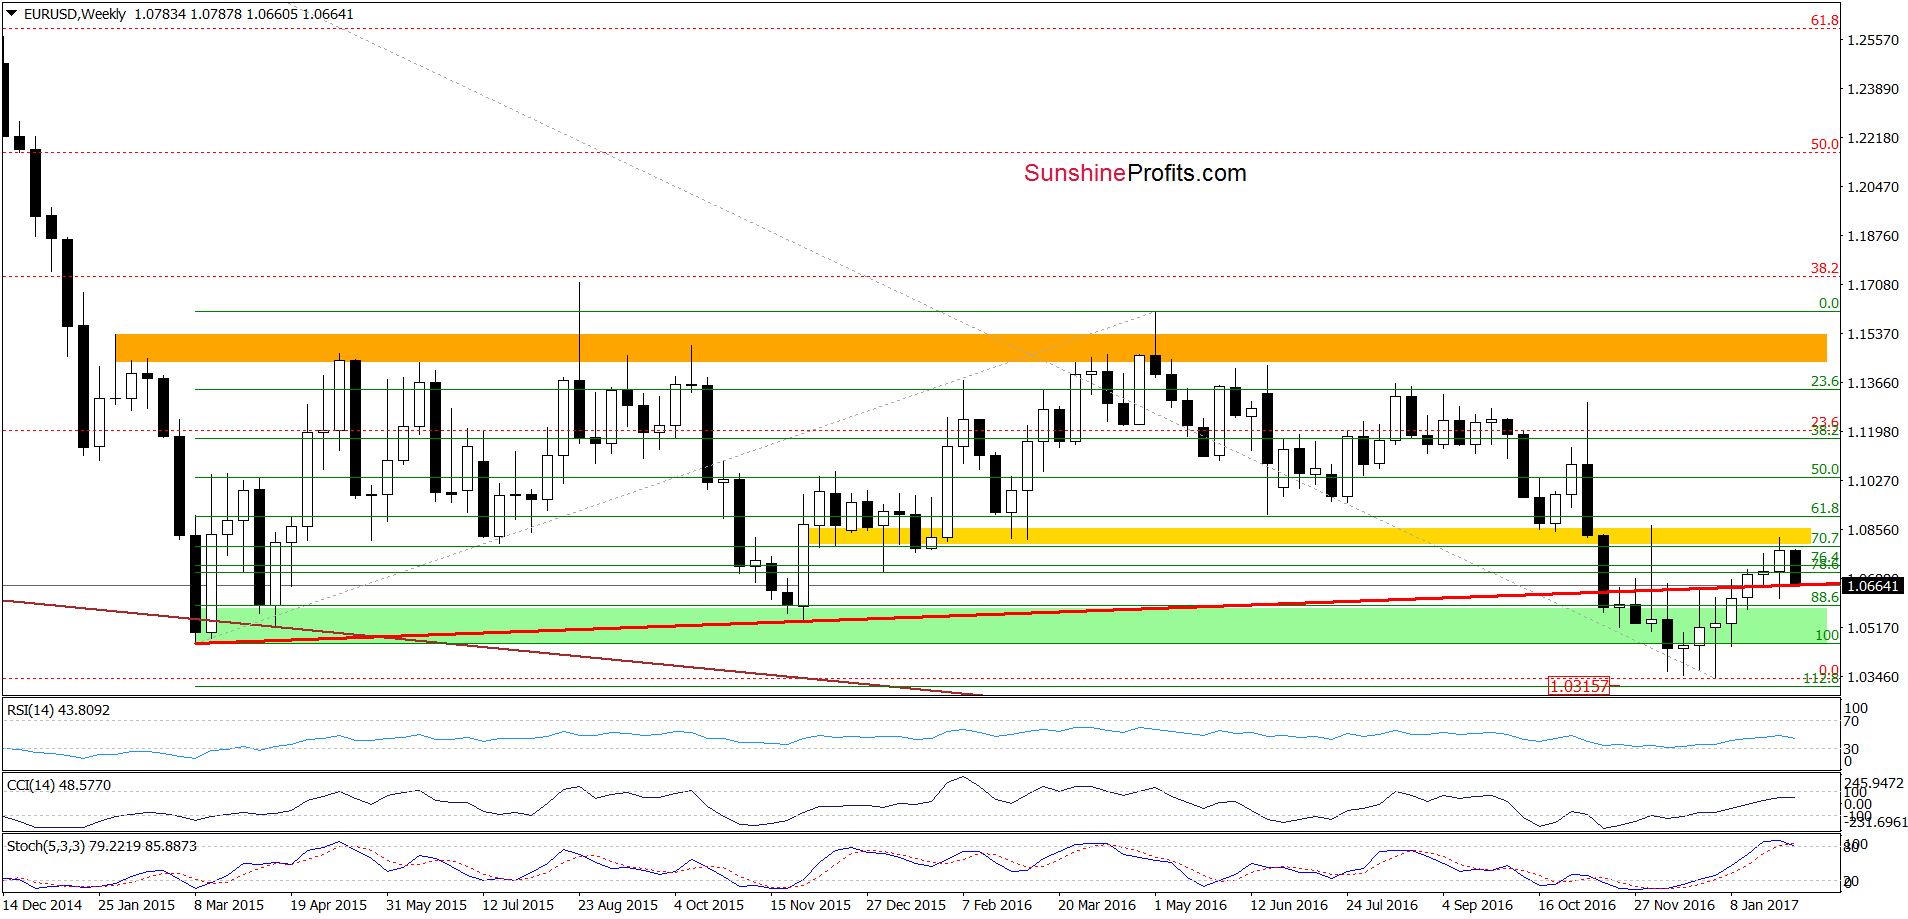
Before we move to the next currency pair, please keep in mind what we wrote yesterday about the long-term picture of EUR/USD:
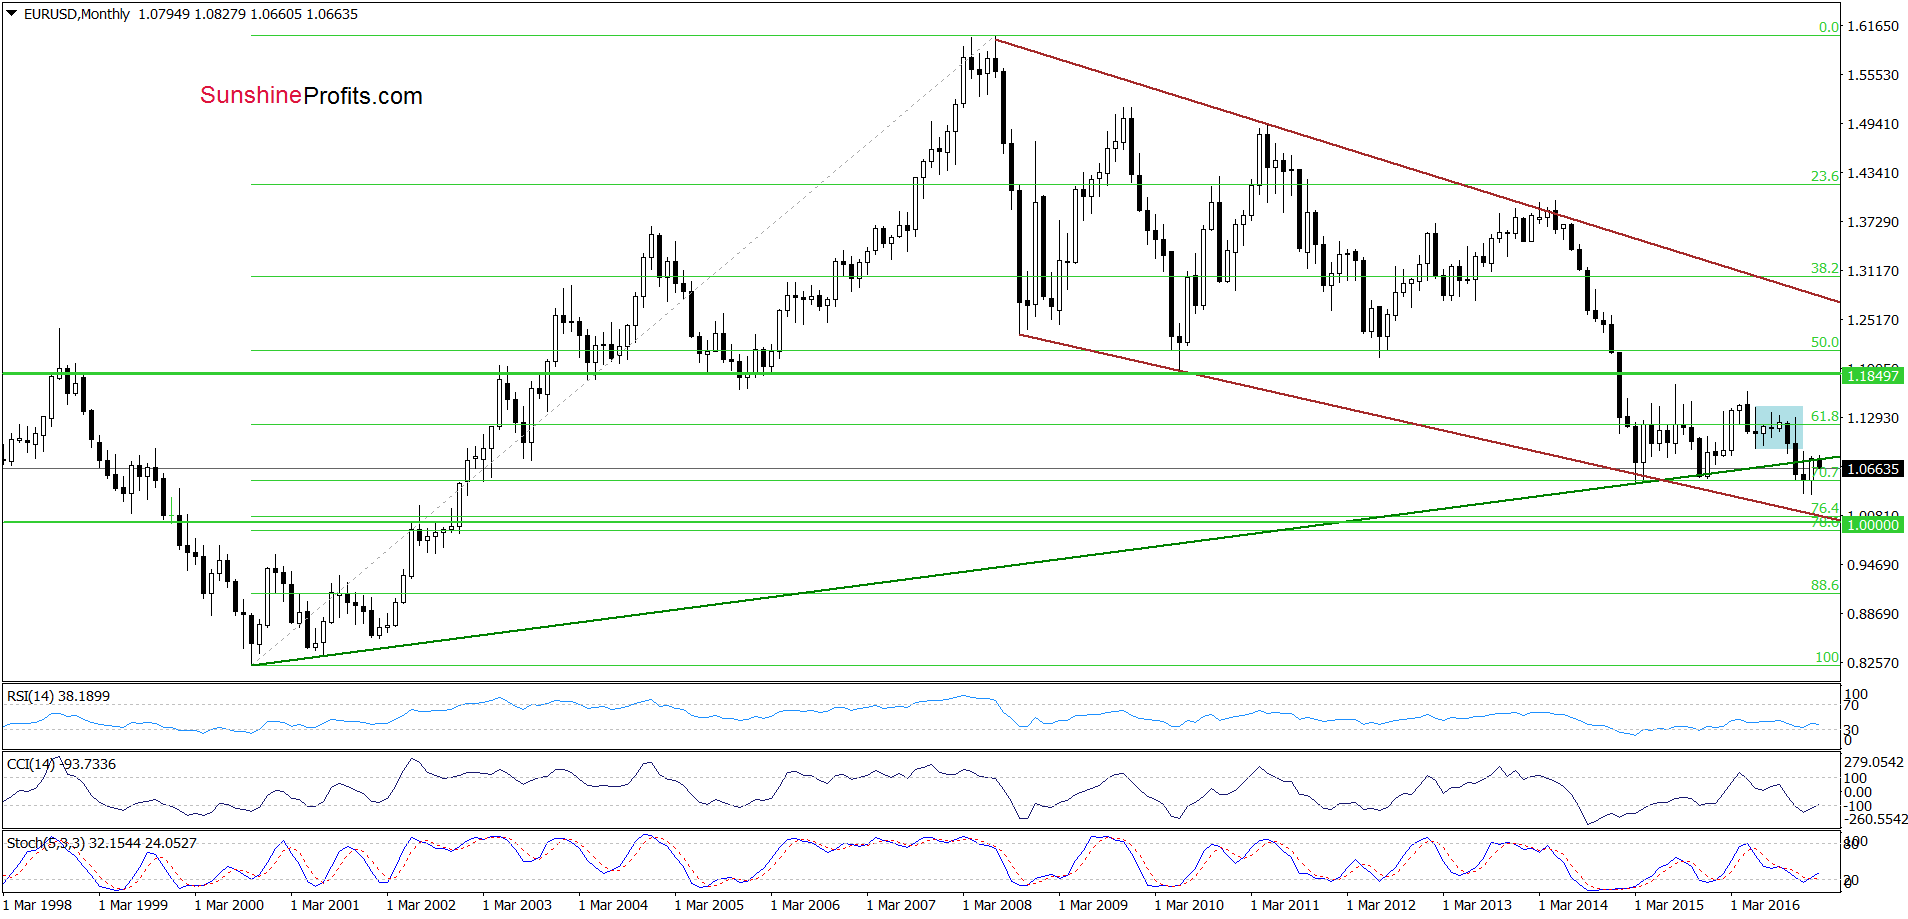
From this perspective, we see that the exchange rate climbed in the previous month to the previously-broken long-term green line, which serves as the key resistance at the moment. Although currency bulls tried to push EUR/USD higher earlier this month, they failed, which resulted in a pullback. This action looks like a verification of the earlier breakdown under this important line, suggesting lover values of the exchange rate in the coming days/weeks.
Very short-term outlook: bearish
Short-term outlook: mixed with bearish bias
MT outlook: mixed
LT outlook: mixed
Trading position (short-term; our opinion): Short positions (with a stop-loss order at 1.0957 and the initial downside target at 1.0538) are justified from the risk/reward perspective. We will keep you informed should anything change, or should we see a confirmation/invalidation of the above.
GBP/USD
Quoting our last commentary on this currency pair:
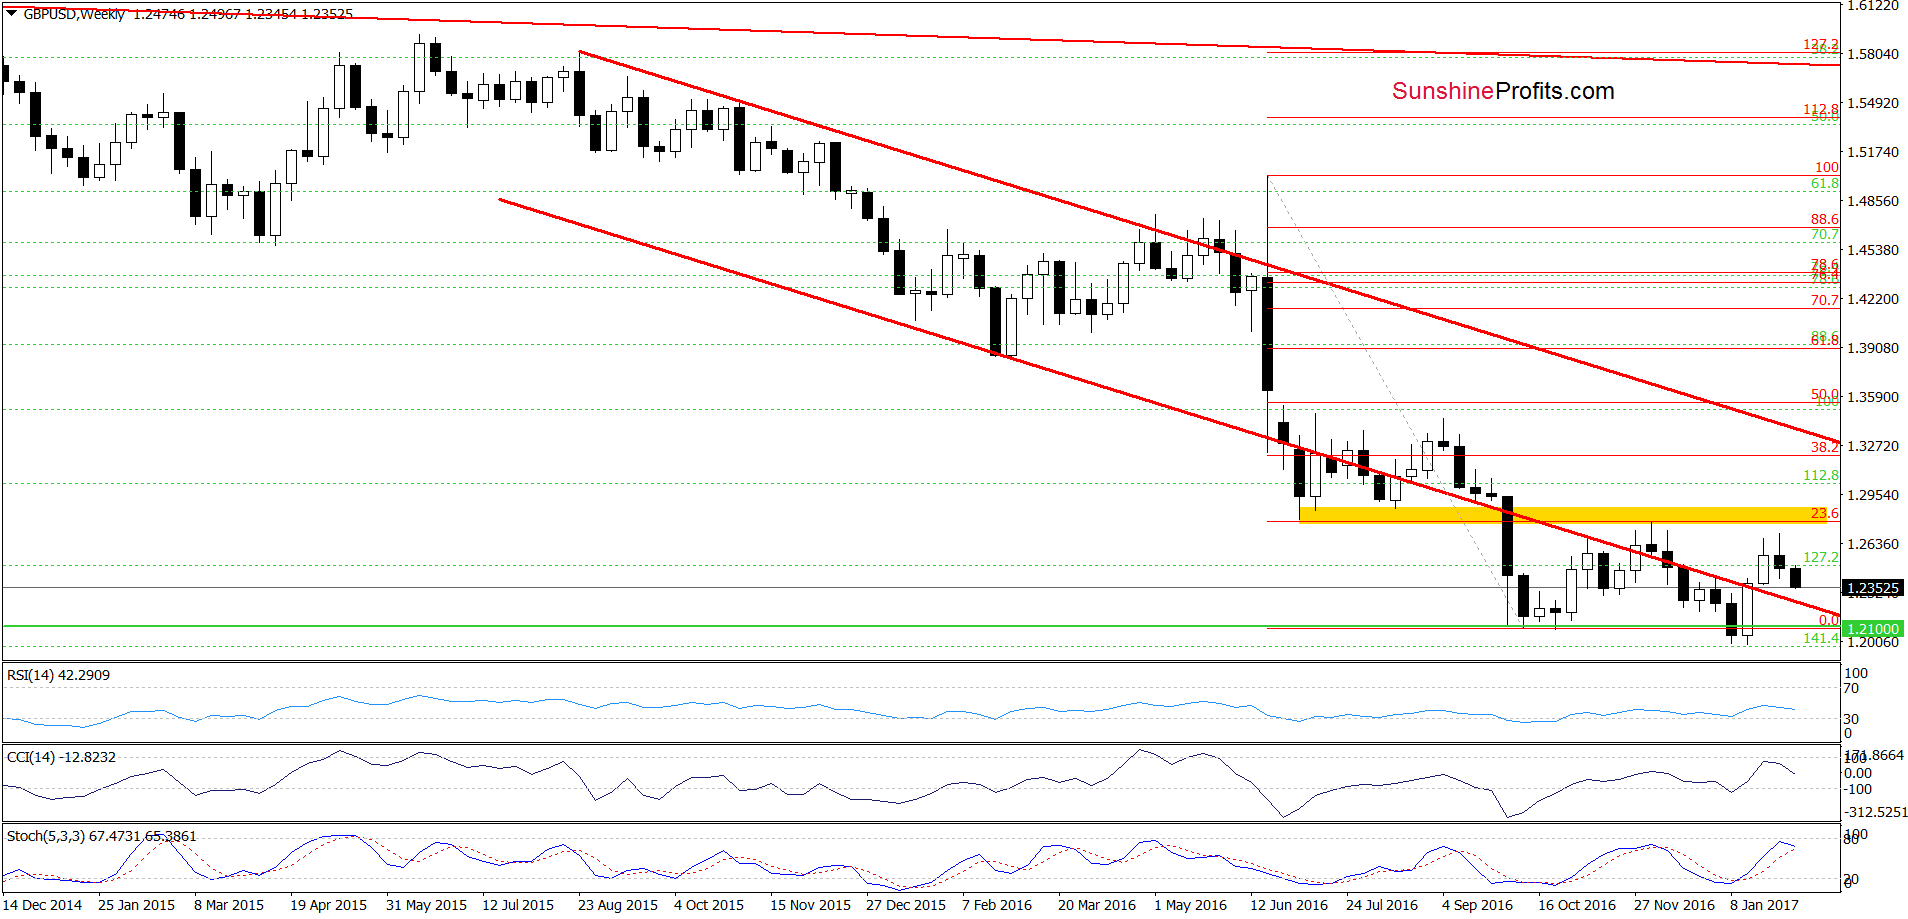
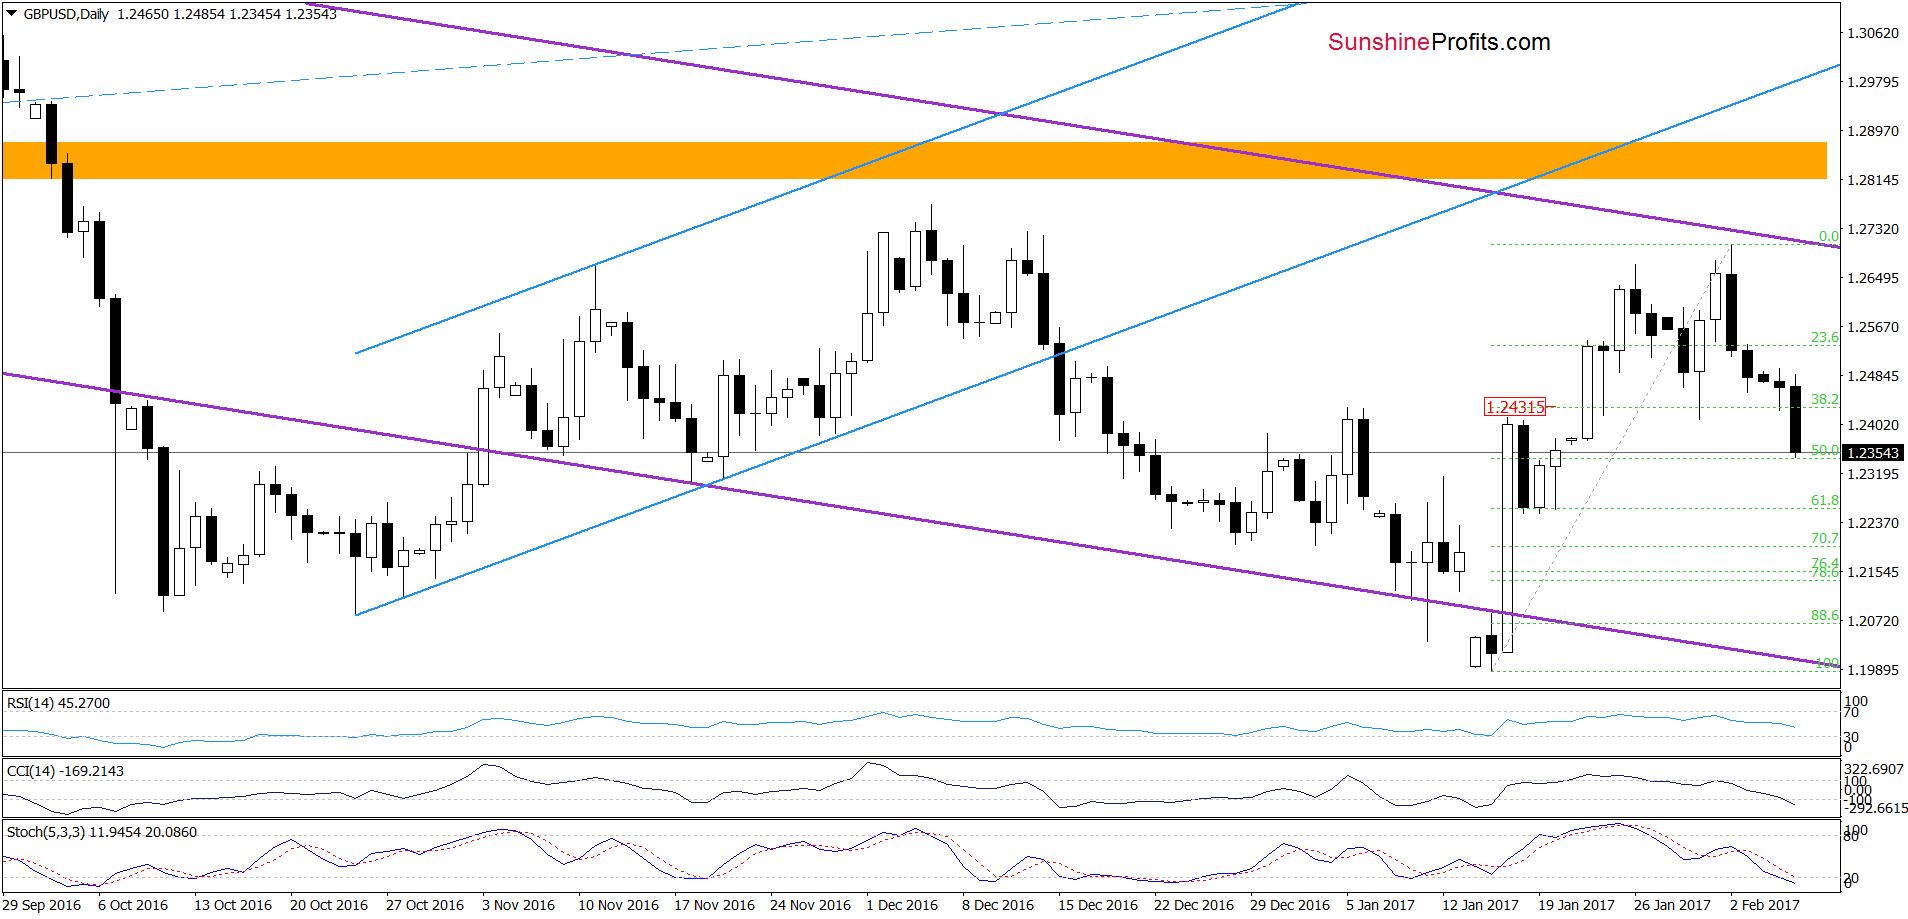
(…) the exchange rate approached our upside targets, which encouraged currency bears to act. As a result, GBP/USD moved sharply lower and the CCI and the Stochastic Oscillator generated sell signals, which suggest further deterioration in the coming days. How low could the exchange rate go? In our opinion, the initial downside target will be the 38.2% Fibonacci retracement (around 1.2431) and this week’s low of 1.2410.
From today’s point of view, we see that currency bears pushed GBP/USD lower (as we had expected) and the pair not only slipped to our initial downside targets, but also declined under the January 31 low, which resulted in a drop to the 50% Fibonacci retracement. Although this support level could encourage currency bulls to act, we think that as long as there are no buy signals generated by the indicators, another attempt to move lower is likely. If this is the case and GBP/USD declines lower, the next downside target will be the 61.8% retracement and the mid-January lows (around 1.2251-1.2260). At this point, it is also worth noting that slightly below this area is also the previously-broken lower border of the red declining trend channel (marked on the weekly chart), which serves as an additional support.
Very short-term outlook: bearish
Short-term outlook: mixed with bearish bias
MT outlook: mixed
LT outlook: mixed
Trading position (short-term; our opinion): Short positions (with a stop-loss order at 1.2543 and the initial downside target at 1.2260) are justified from the risk/reward perspective. We will keep you informed should anything change, or should we see a confirmation/invalidation of the above.
USD/JPY
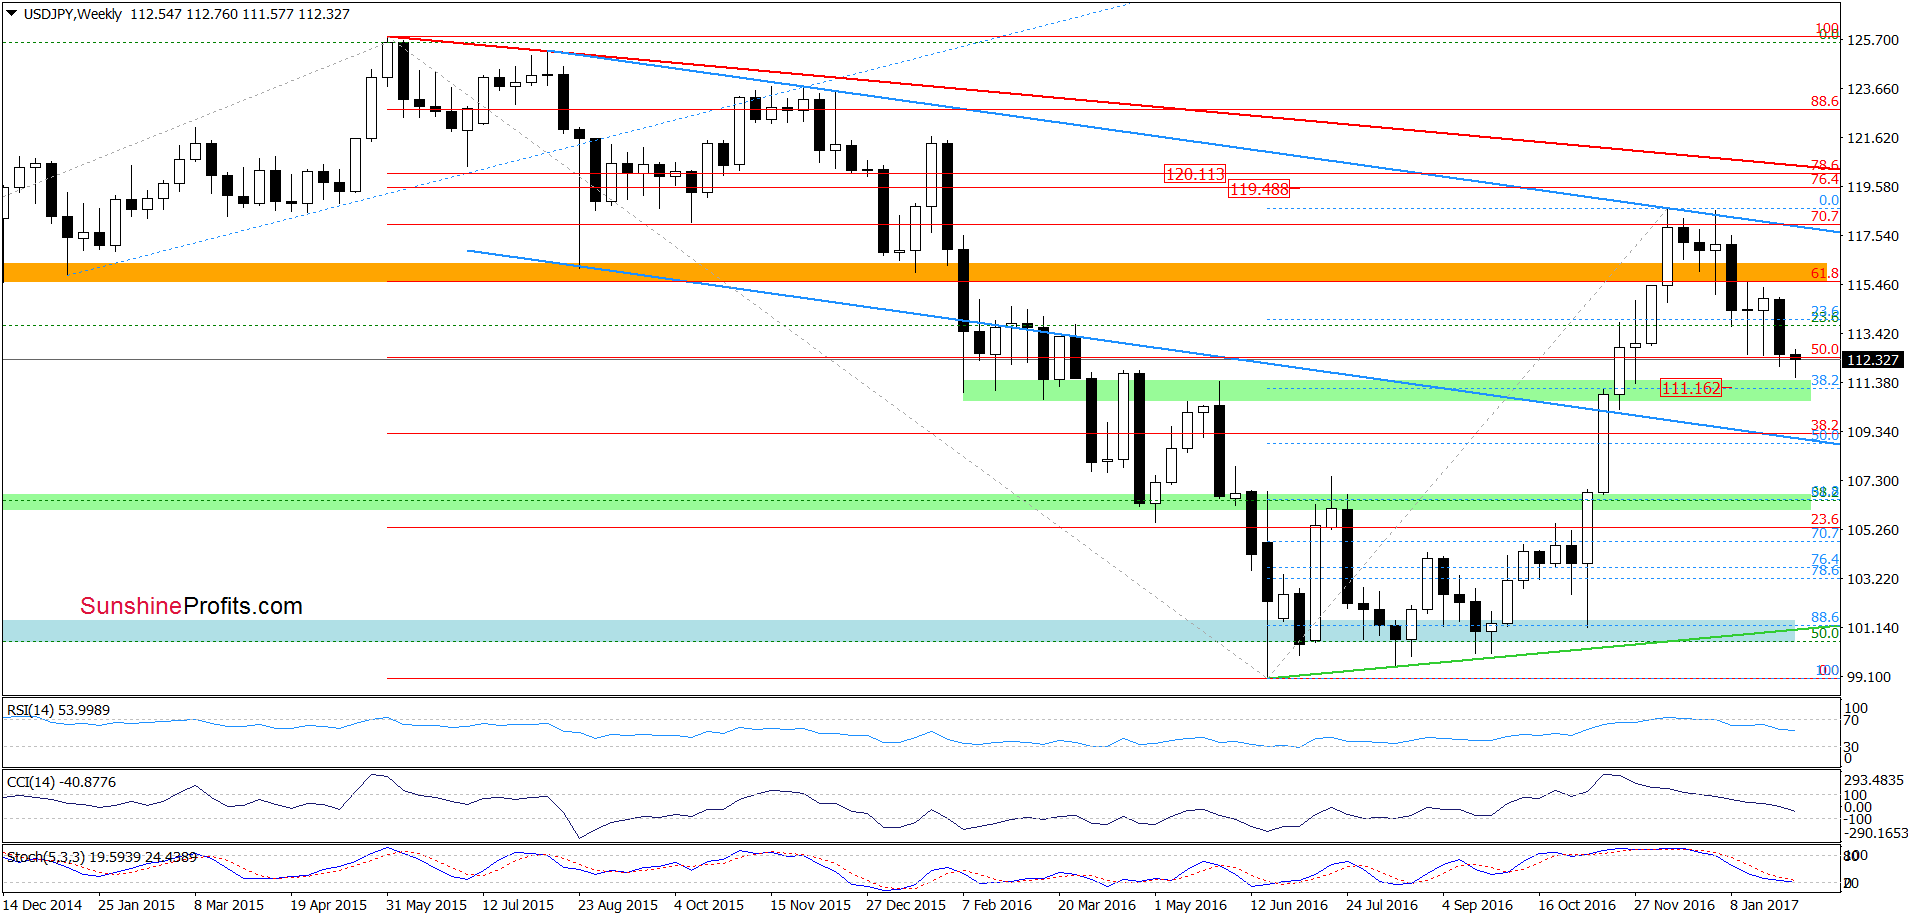
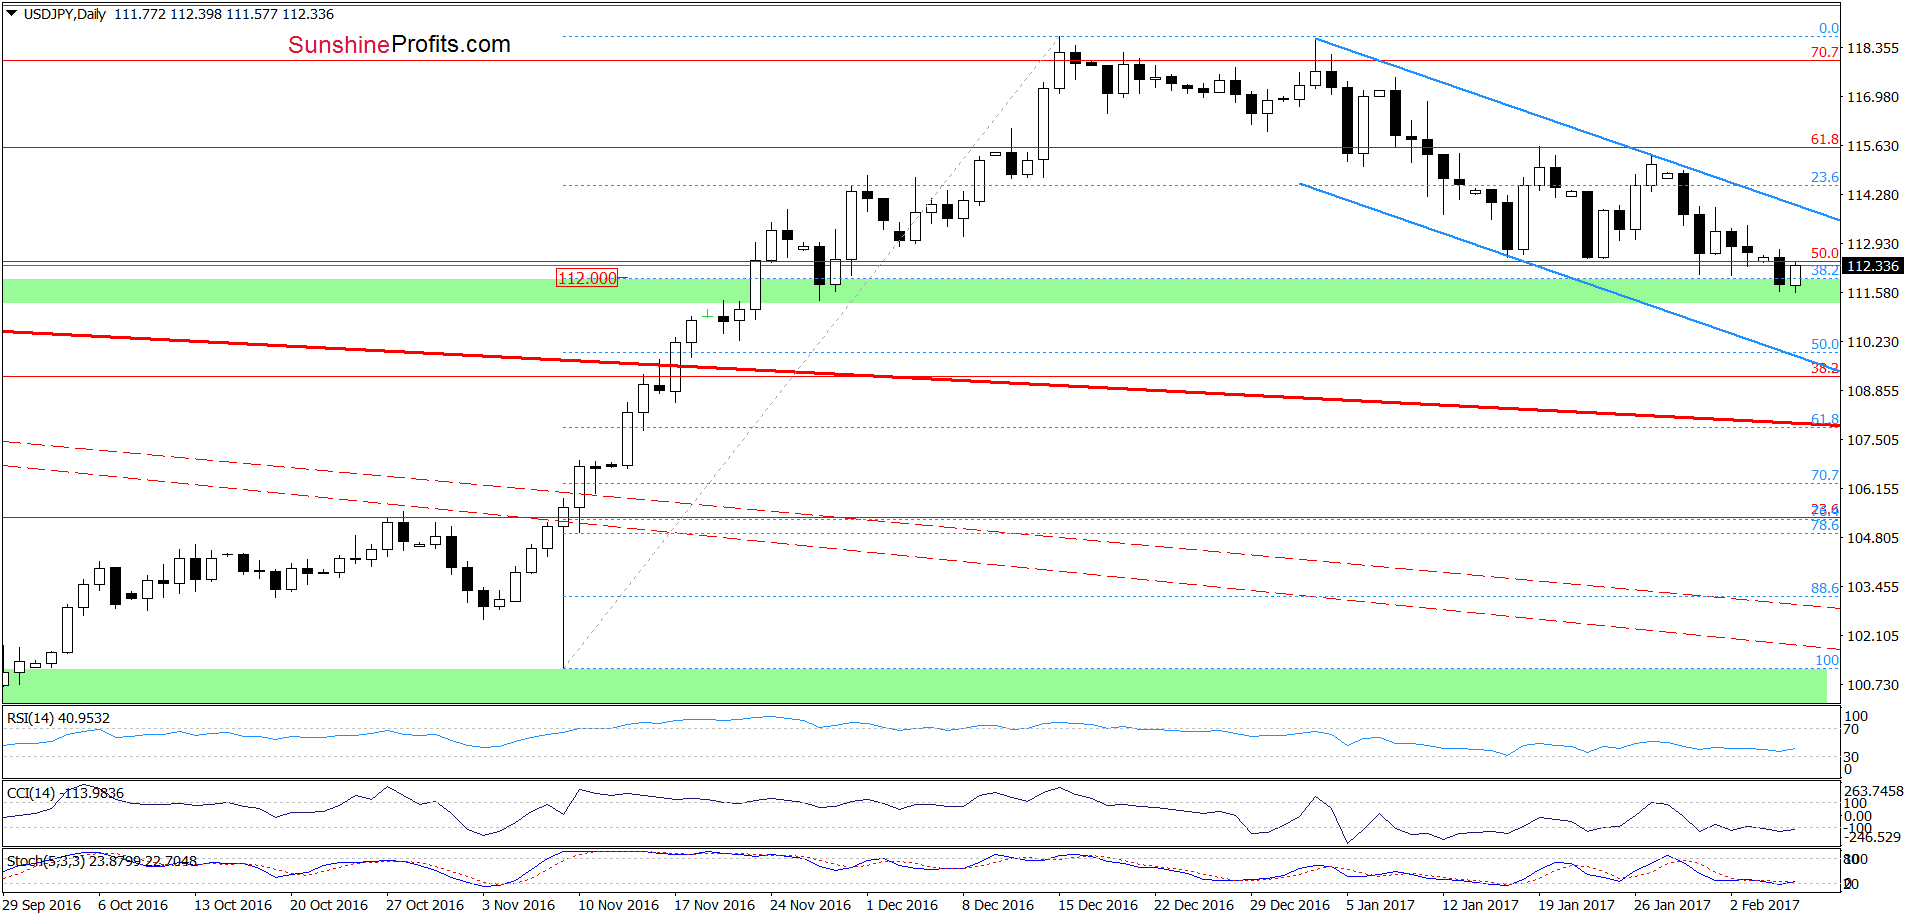
On the daily chart, we see that USD/JPY extended declines and slipped slightly below the 38.2% Fibonacci retracement based on the entire November-December upward move yesterday. Despite this move, the green support zone encouraged currency bulls to act, which resulted in an invalidation of this small breakdown earlier today. Taking this event into account and the current position of the indicators (they are very close to generating buy signals), we think that further improvement is just around the corner. If this is the case, the initial upside target will be the upper border of the blue declining trend channel (currently around 113.88).
Very short-term outlook: mixed with bullish bias
Short-term outlook: mixed
MT outlook: mixed
LT outlook: mixed
Trading position (short-term; our opinion): No positions are justified from the risk/reward perspective. We will keep you informed should anything change, or should we see a confirmation/invalidation of the above.
USD/CAD
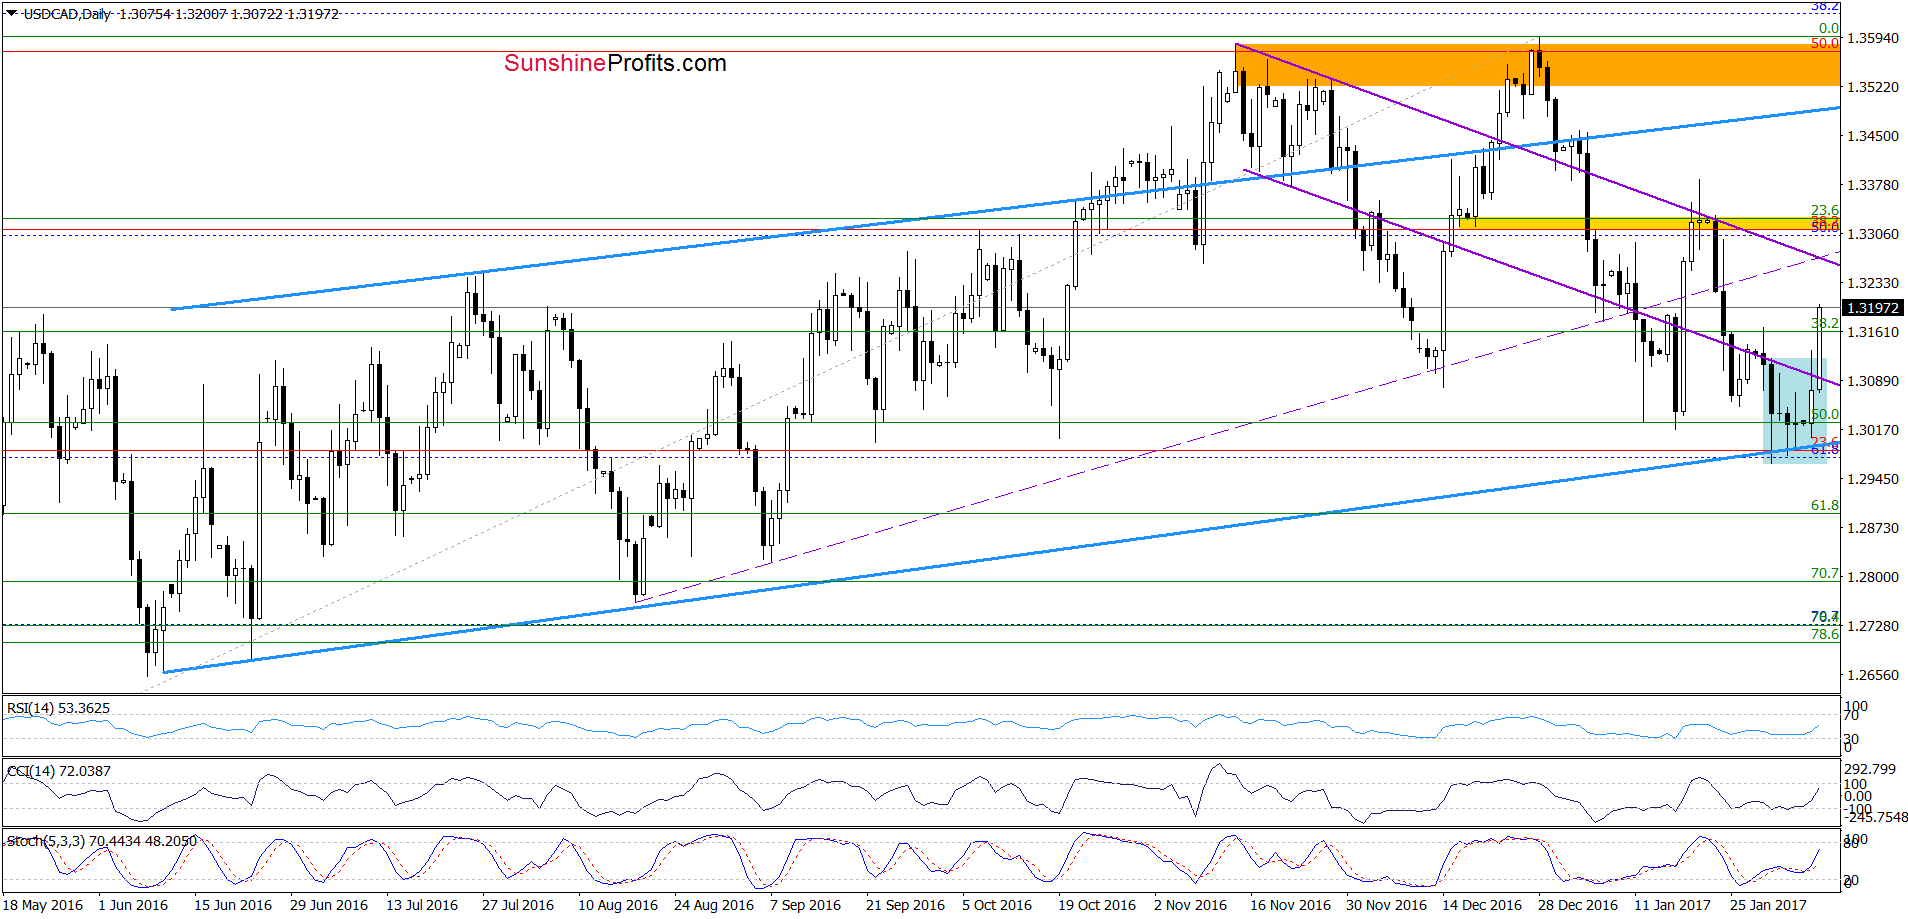
Yesterday, we wrote:
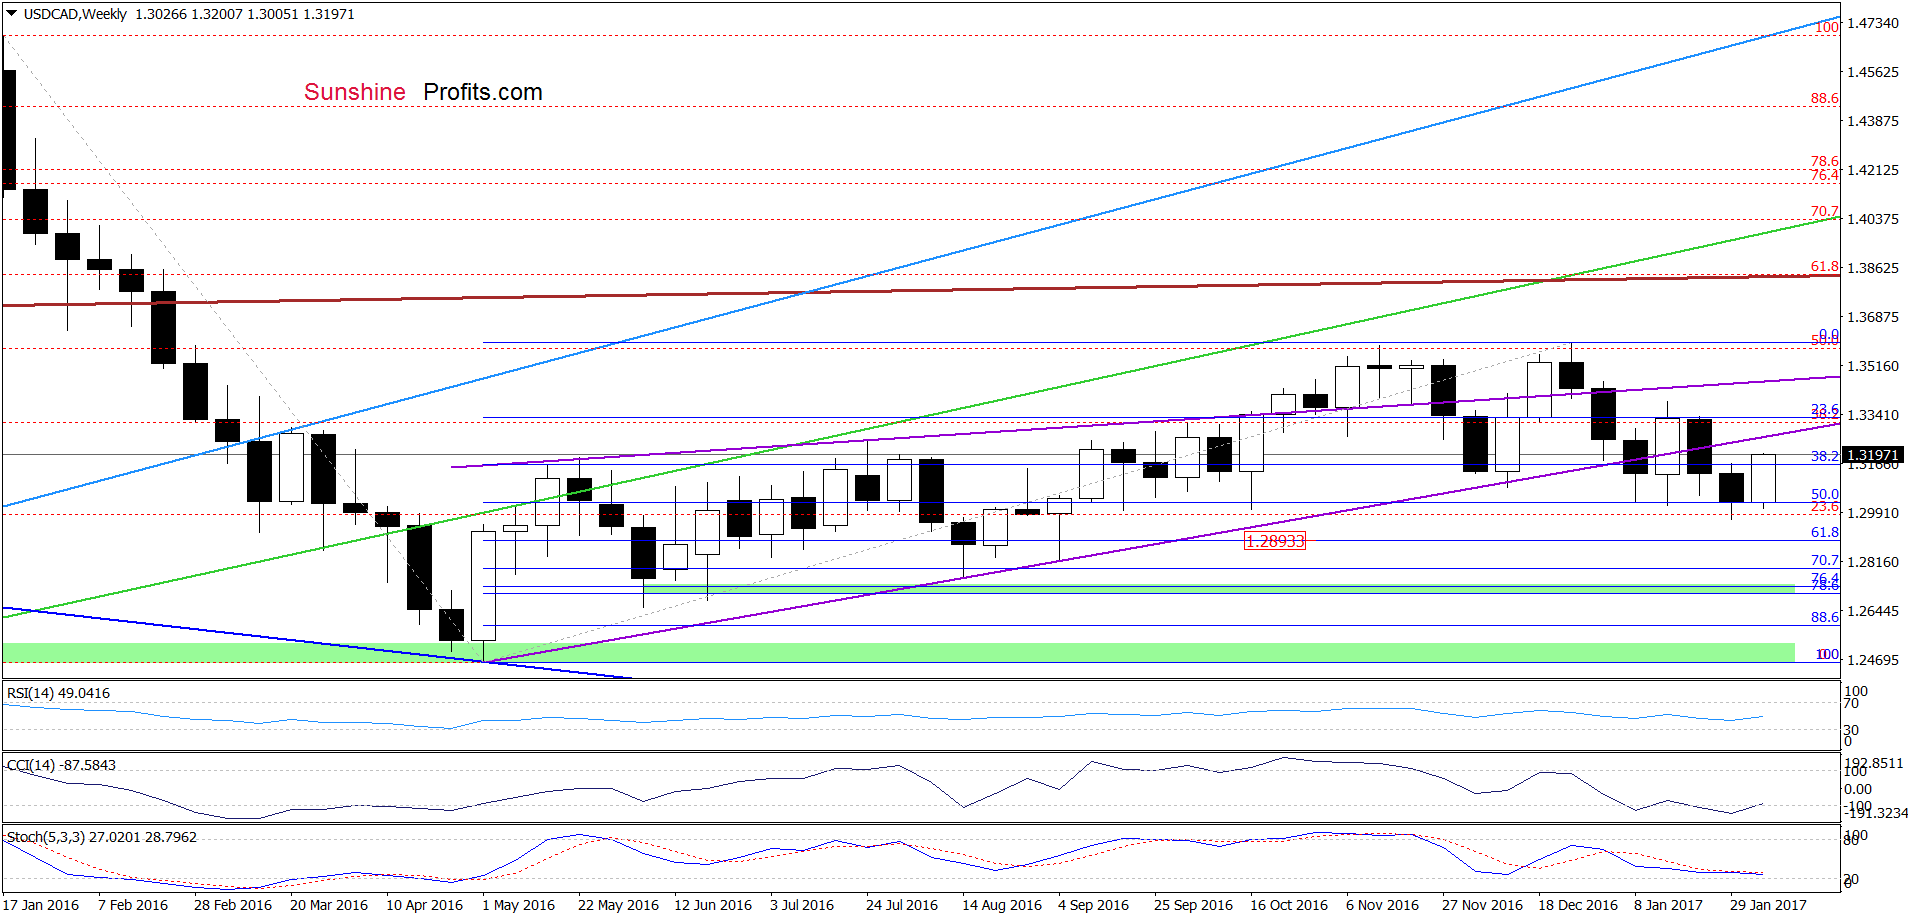
(…) although USD/CAD tested the strength of the blue support line several times in the previous week, currency bears didn’t manage to push the pair below it. As a result, the exchange rate rebounded earlier today, which together with the buy signals generated by the indicators suggest further improvement in the coming days. Nevertheless, in our opinion, a bigger move to the upside will be more likely and reliable if USD/CAD invalidates the earlier breakdown under the lower border of the purple declining trend channel.
Looking at the daily chart, we see that the situation developed in tune with our yesterday’s assumptions and the exchange rate increased above the lower border of the purple declining trend channel, invalidating the earlier breakdown. Taking this fact into account and the buy signals generated by the indicators, we think that the pair will test (at least) the upper border of the purple trend channel (currently around 1.3264). If this resistance is broken, the next upside target will be the yellow resistance zone and the January 20 high of 1.3385.
Very short-term outlook: bullish
Short-term outlook: mixed with bullish bias
MT outlook: mixed
LT outlook: mixed
Trading position (short-term; our opinion): Long positions (with a stop-loss order at 1.3055 and the initial upside target at 1.3302) are justified from the risk/reward perspective. We will keep you informed should anything change, or should we see a confirmation/invalidation of the above.
USD/CHF
Quoting our last commentary on this currency pair:
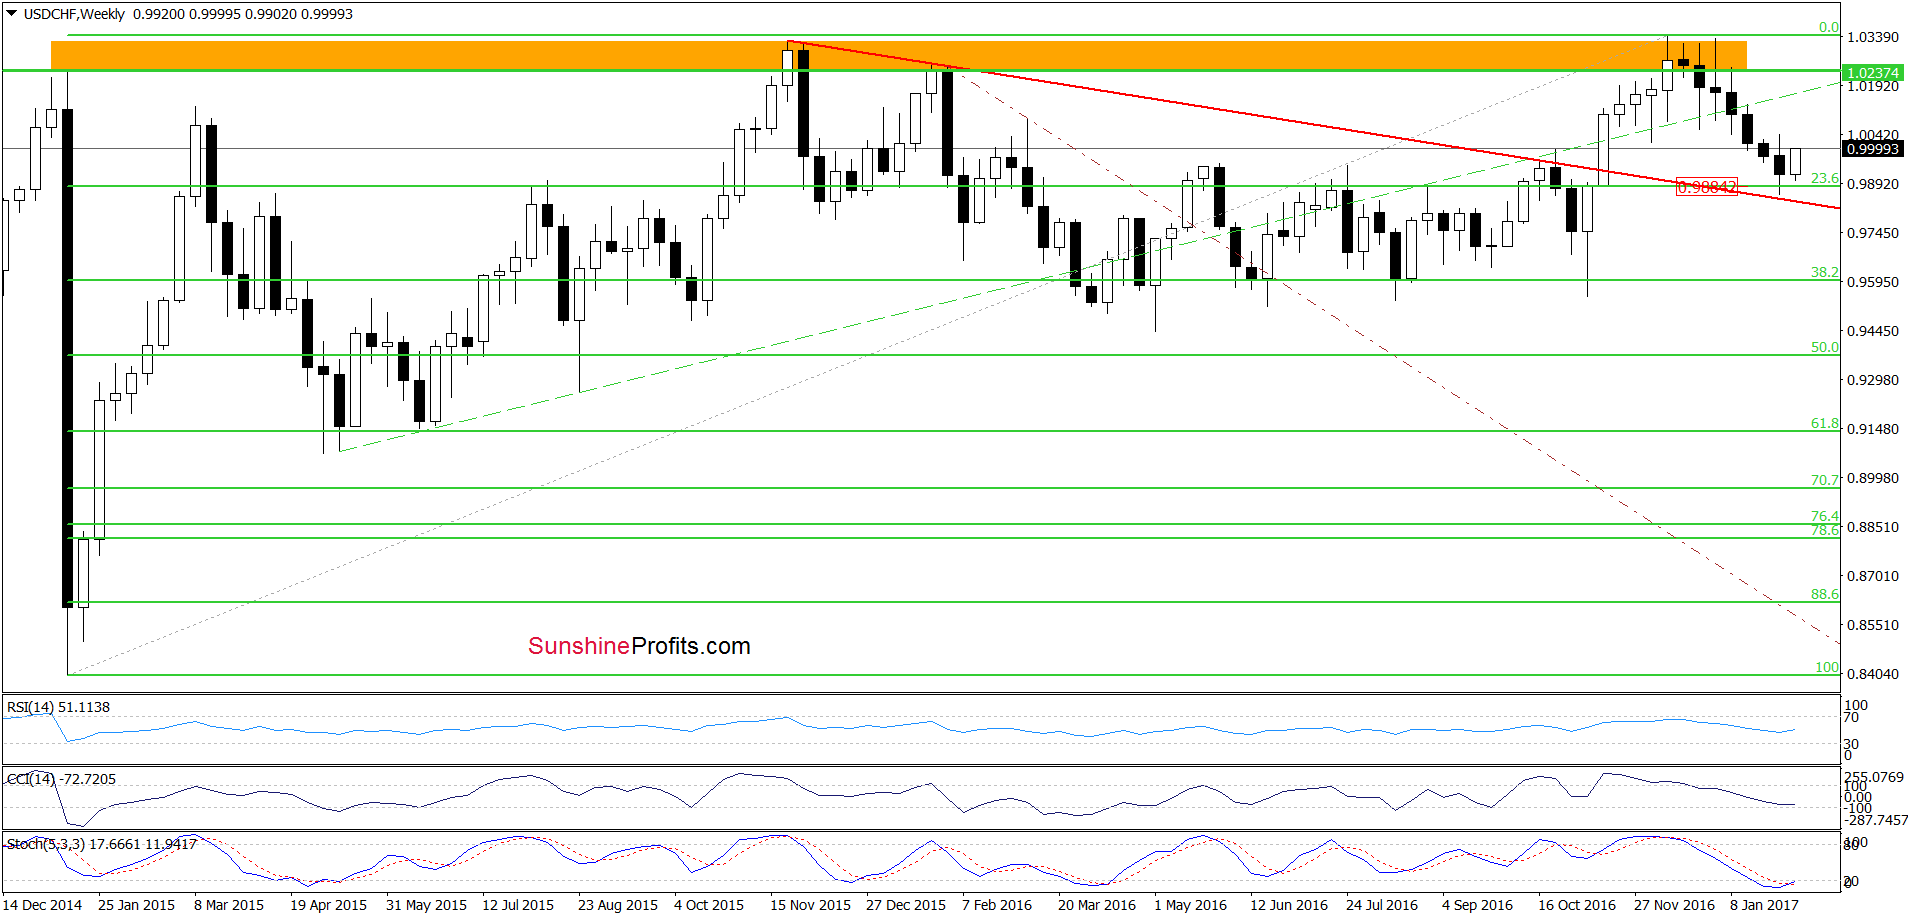
(…) USD/CHF is consolidating under the previously-broken green zone. Nevertheless, the CCI and the Stochastic Oscillator generated the buy signals, which suggest that currency bulls will try to push the pair higher in the coming days. If this is the case and we see such price action the initial upside target will be the orange resistance zone. However, in our opinion, further improvement will be more likely and reliable if USD/CHF breaks above the upper border of the purple declining trend channel seen on the daily chart.
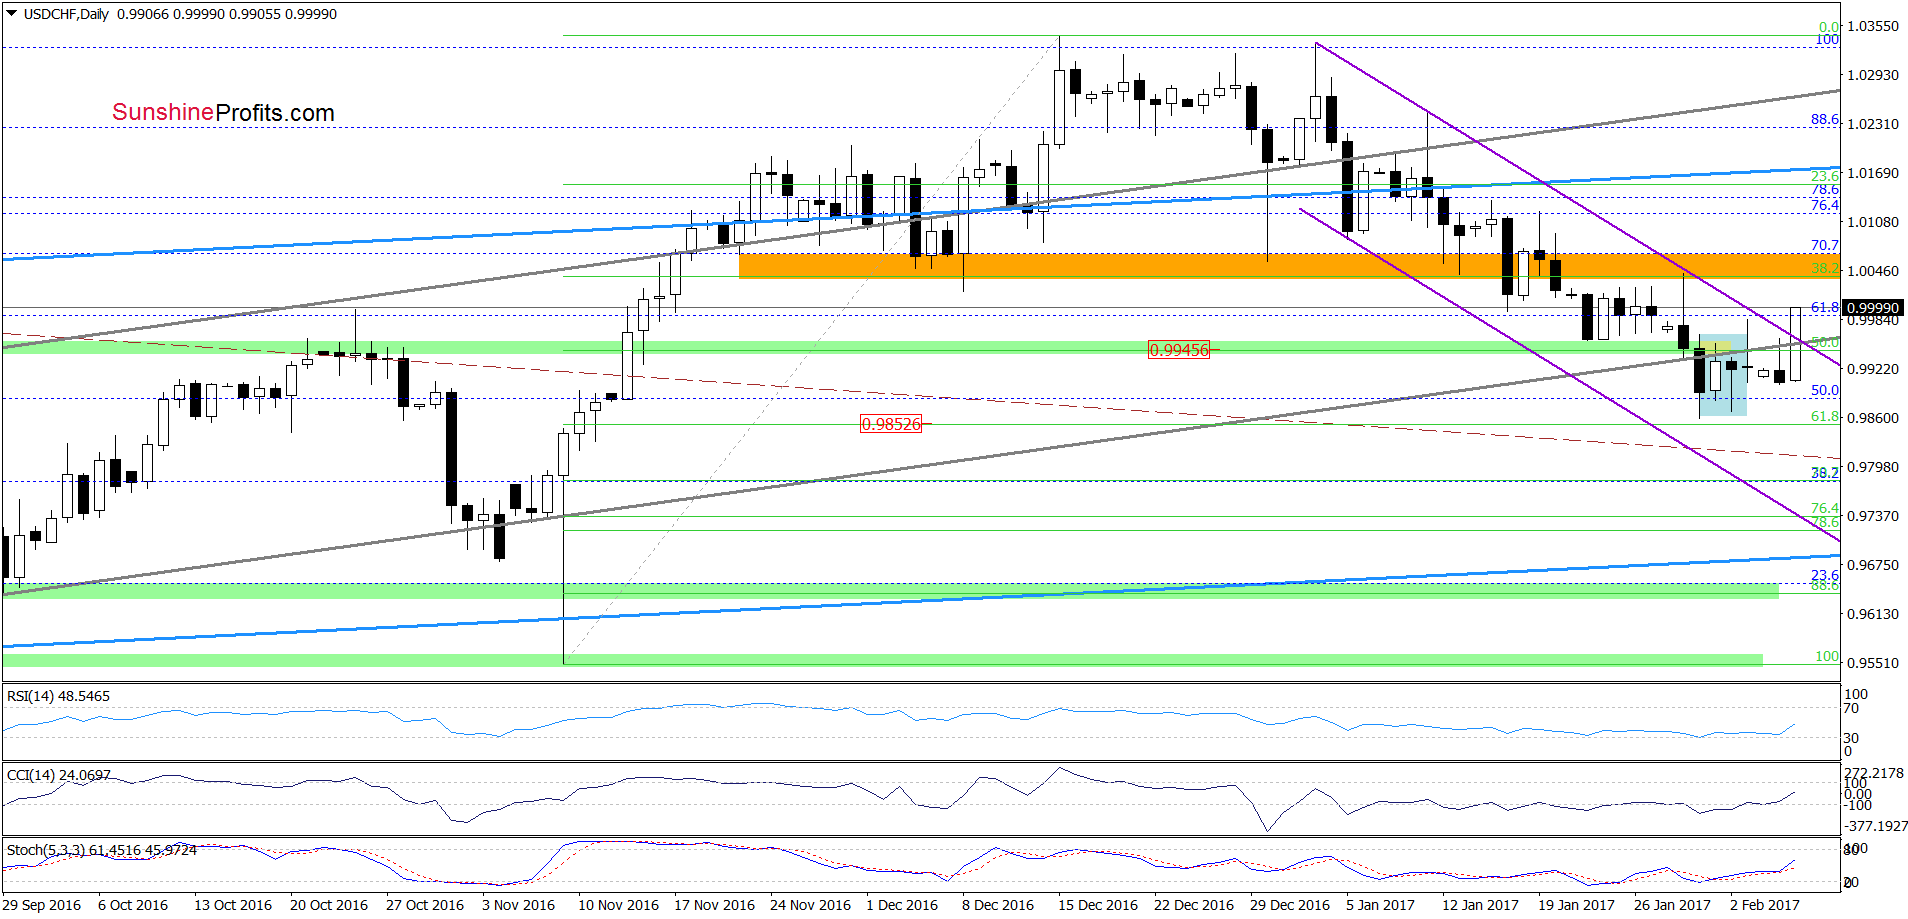
On the daily chart, we see that currency bulls pushed the exchange rate higher (as we had expected), which resulted in a breakout above the upper border of the purple declining trend channel. This is a bullish development, which together with the buy signals generated by the indicators suggest further improvement and (at least) a test of our initial upside target. If this area is broken, we may see even an increase to the previously-broken upper border of the blue rising trend channel (currently around 1.0172) in the following days.
Very short-term outlook: bullish
Short-term outlook: mixed with bullish bias
MT outlook: mixed
LT outlook: mixed
Trading position (short-term; our opinion): Long positions (with a stop-loss order at 0.9879 and the initial upside target at 1.0064) are justified from the risk/reward perspective. We will keep you informed should anything change, or should we see a confirmation/invalidation of the above.
AUD/USD
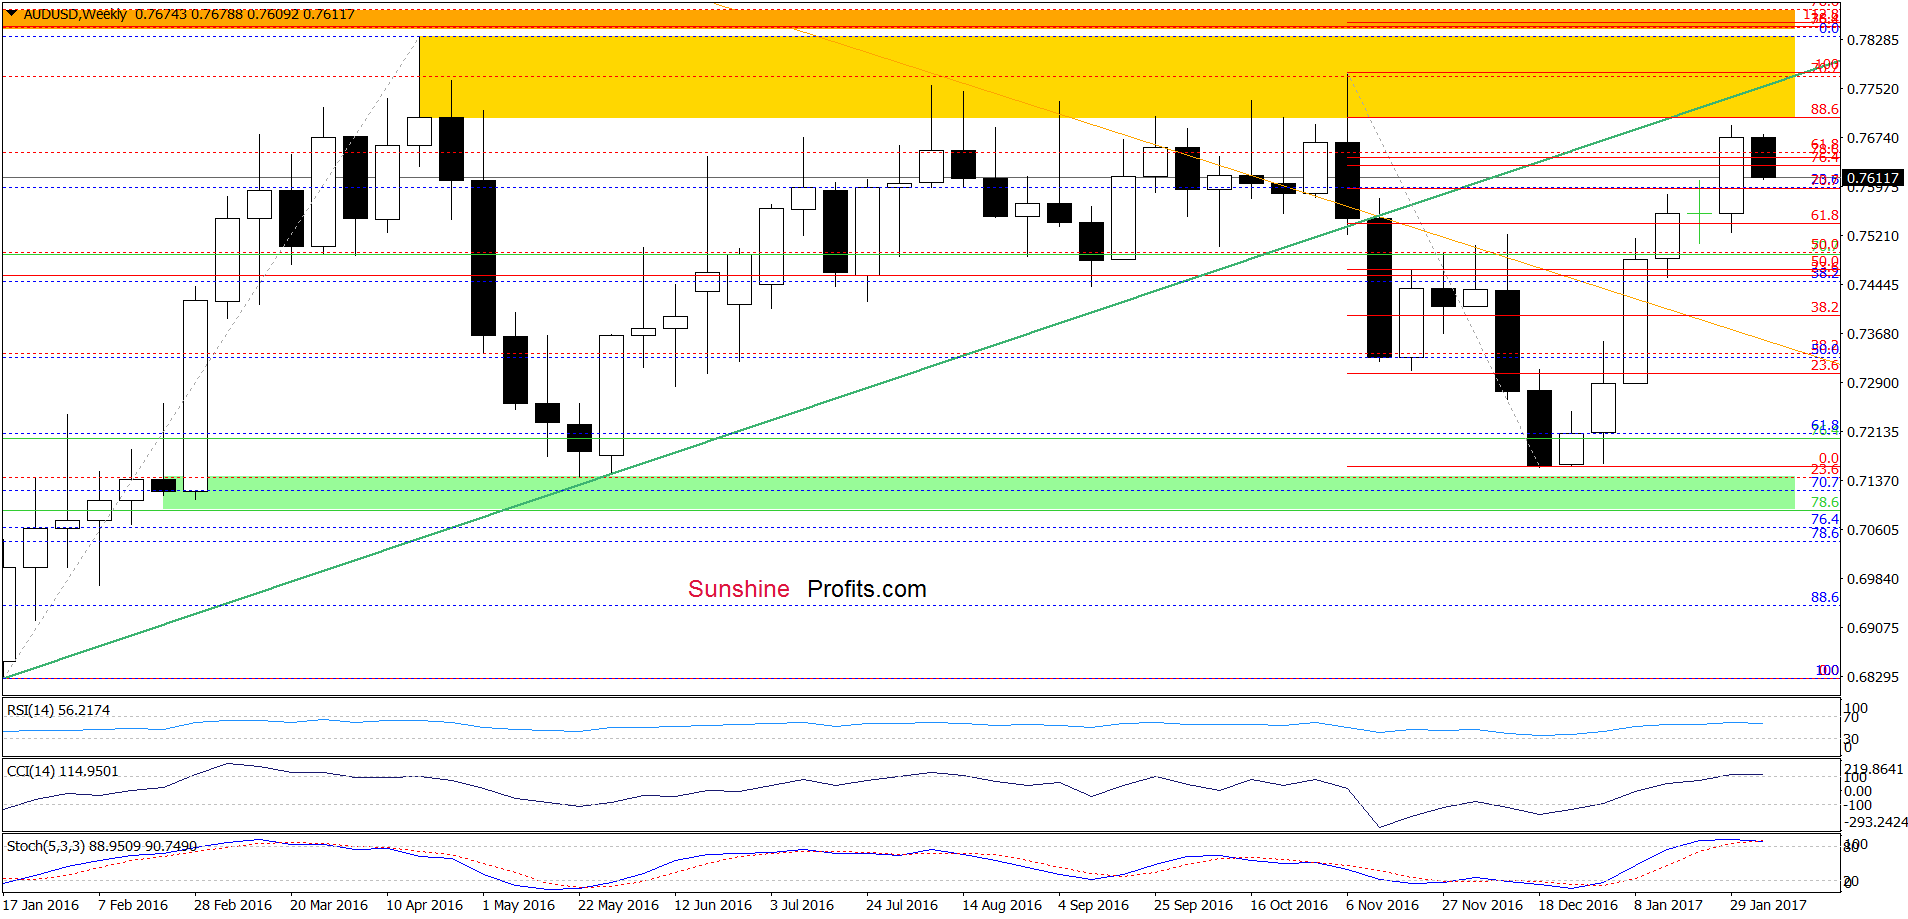
Yesterday, we wrote the following:
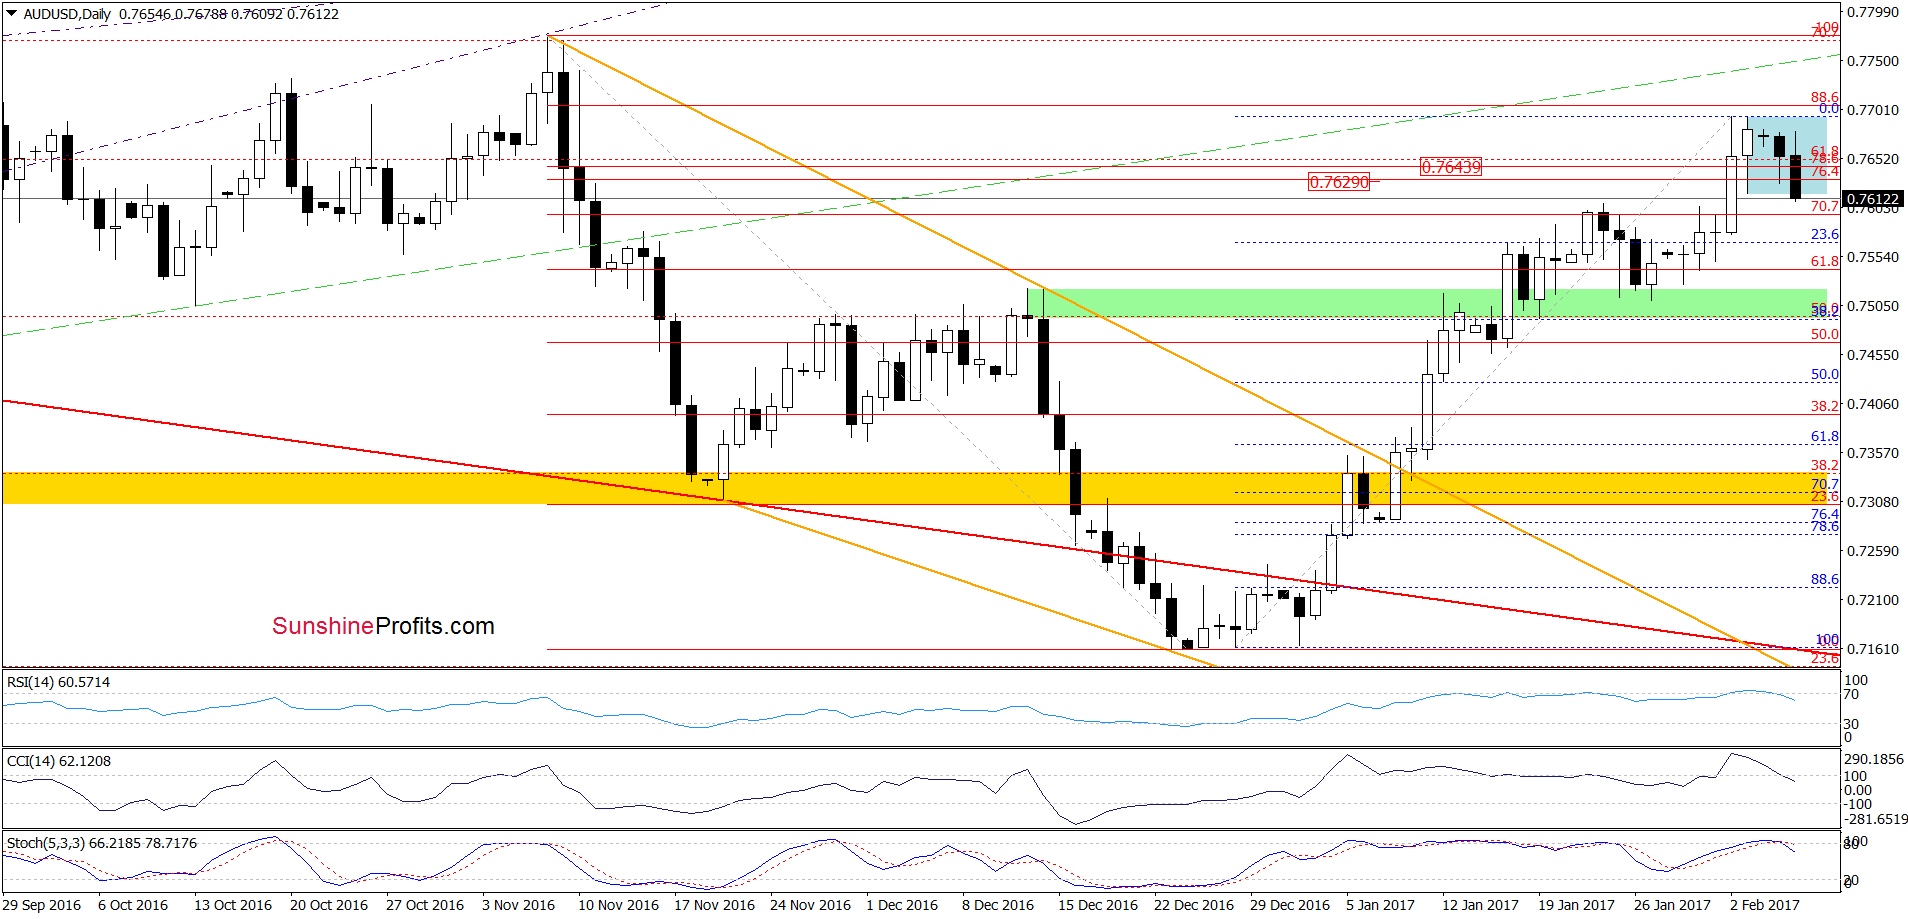
(…) AUD/USD reached our upside targets. With the recent increases the exchange rate approached the 88.6% Fibonacci retracement and the yellow resistance zone (marked on the weekly chart), while the daily and weekly indicators climbed to the overbought zones. Such situation increases the probability of reversal and declines in the following days. Therefore if the pair drops below the January 24 low of 0.7606 and the daily indicators generate sell signals, well consider opening short positions.
From today’s point of view, we see that the situation developed in line with yesterday’s scenario and AUD/USD extended losses, slipping under the lower border of the blue consolidation (based on the January 24 low of 0.7606). Additionally, all indicators generated the sell signals, increasing the probability of further declines. If this is the case and AUD/USD moves lower from here, the next downside target will be the green support zone seen on the daily chart (around 0.7520).
Very short-term outlook: bearish
Short-term outlook: mixed with bearish bias
MT outlook: mixed
LT outlook: mixed
Trading position (short-term; our opinion): Short positions (with a stop-loss order at 0.7723 and the initial downside target at 0.7520) are justified from the risk/reward perspective. We will keep you informed should anything change, or should we see a confirmation/invalidation of the above.
As a reminder – “initial target price” means exactly that – an “initial” one, it’s not a price level at which we suggest closing positions. If this becomes the case (like it did in the previous trade) we will refer to these levels as levels of exit orders (exactly as we’ve done previously). Stop-loss levels, however, are naturally not “initial”, but something that, in our opinion, might be entered as an order.
Thank you.
Nadia Simmons
Forex & Oil Trading Strategist
Przemyslaw Radomski, CFA
Founder, Editor-in-chief, Gold & Silver Fund Manager
Gold & Silver Trading Alerts
Forex Trading Alerts
Oil Investment Updates
Oil Trading Alerts

