

Although the Labor Department showed that the unemployment rate dropped to a 16-year low of 4.3%, the U.S. economy added only 138,000 jobs in May, missing forecasts of 185,000 new jobs. Thanks to these disappointing numbers the USD Index extended losses and slipped to the lowest level since early November. How did drop affect the euro, the Swiss franc and the Australian dollar?
In our opinion the following forex trading positions are justified - summary:
- EUR/USD: none
- GBP/USD: short (a stop-loss order at 1.3232; the initial downside target at 1.2375)
- USD/JPY: long (a stop-loss order at 107.62; the initial upside target at 113.08)
- USD/CAD: none
- USD/CHF: none
- AUD/USD: none
EUR/USD
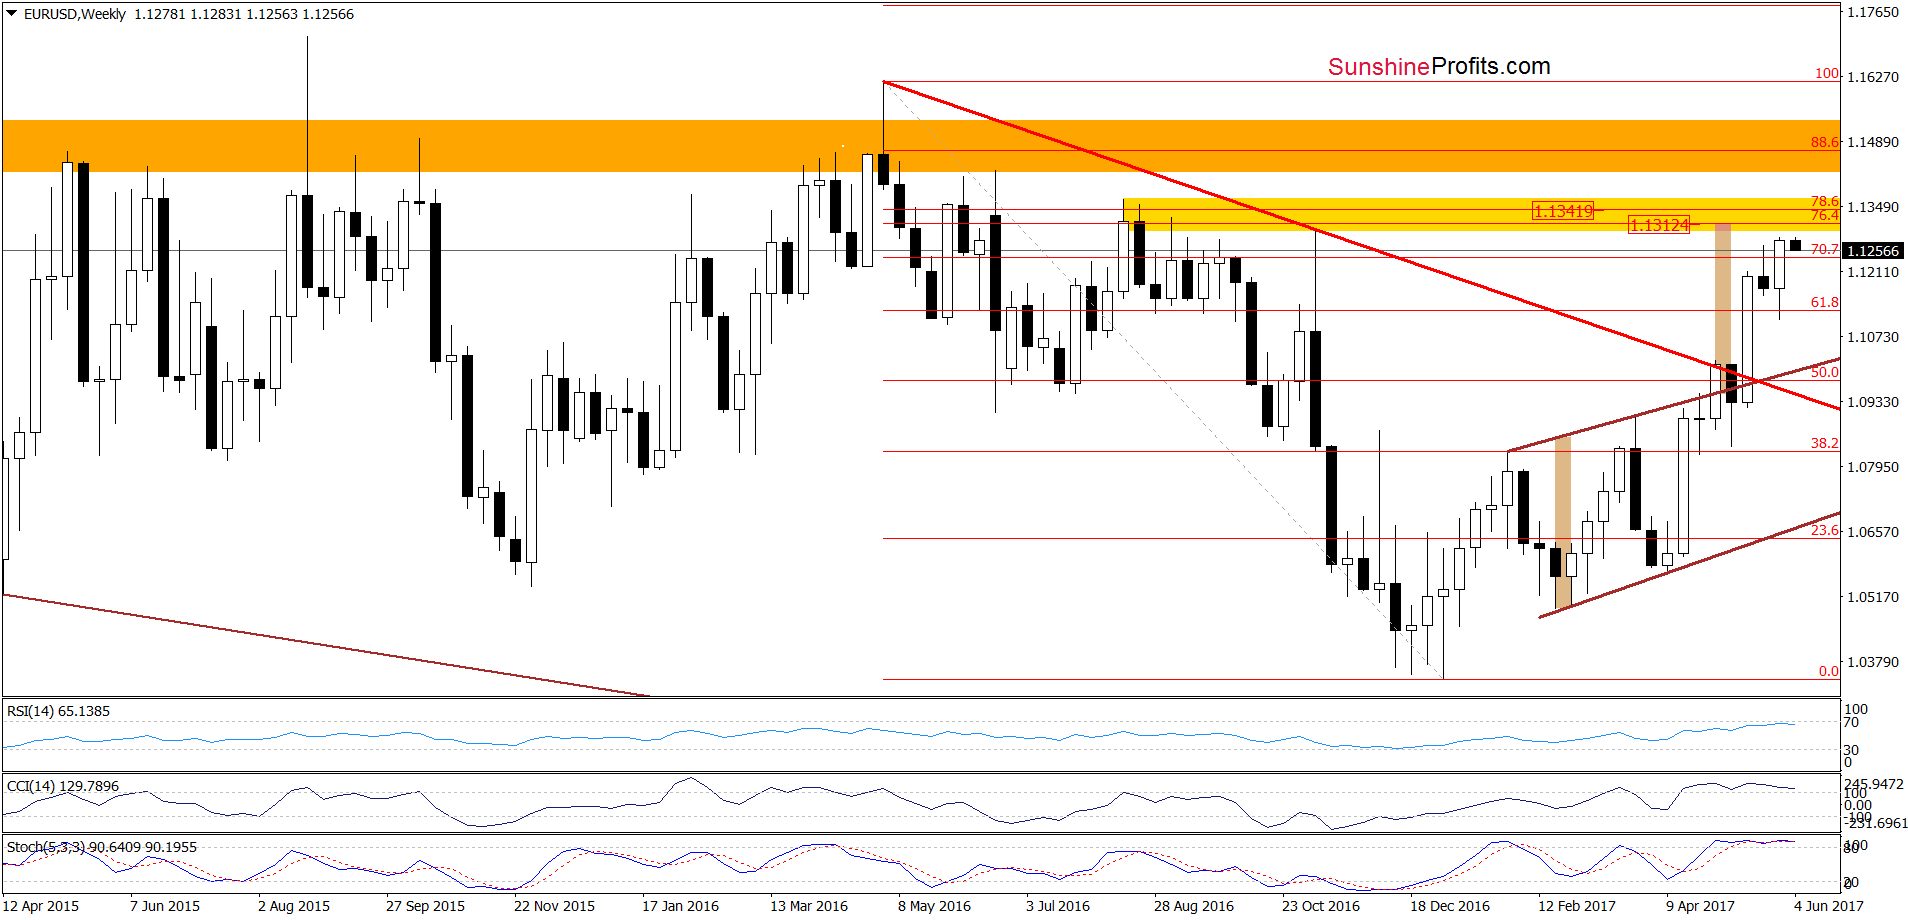
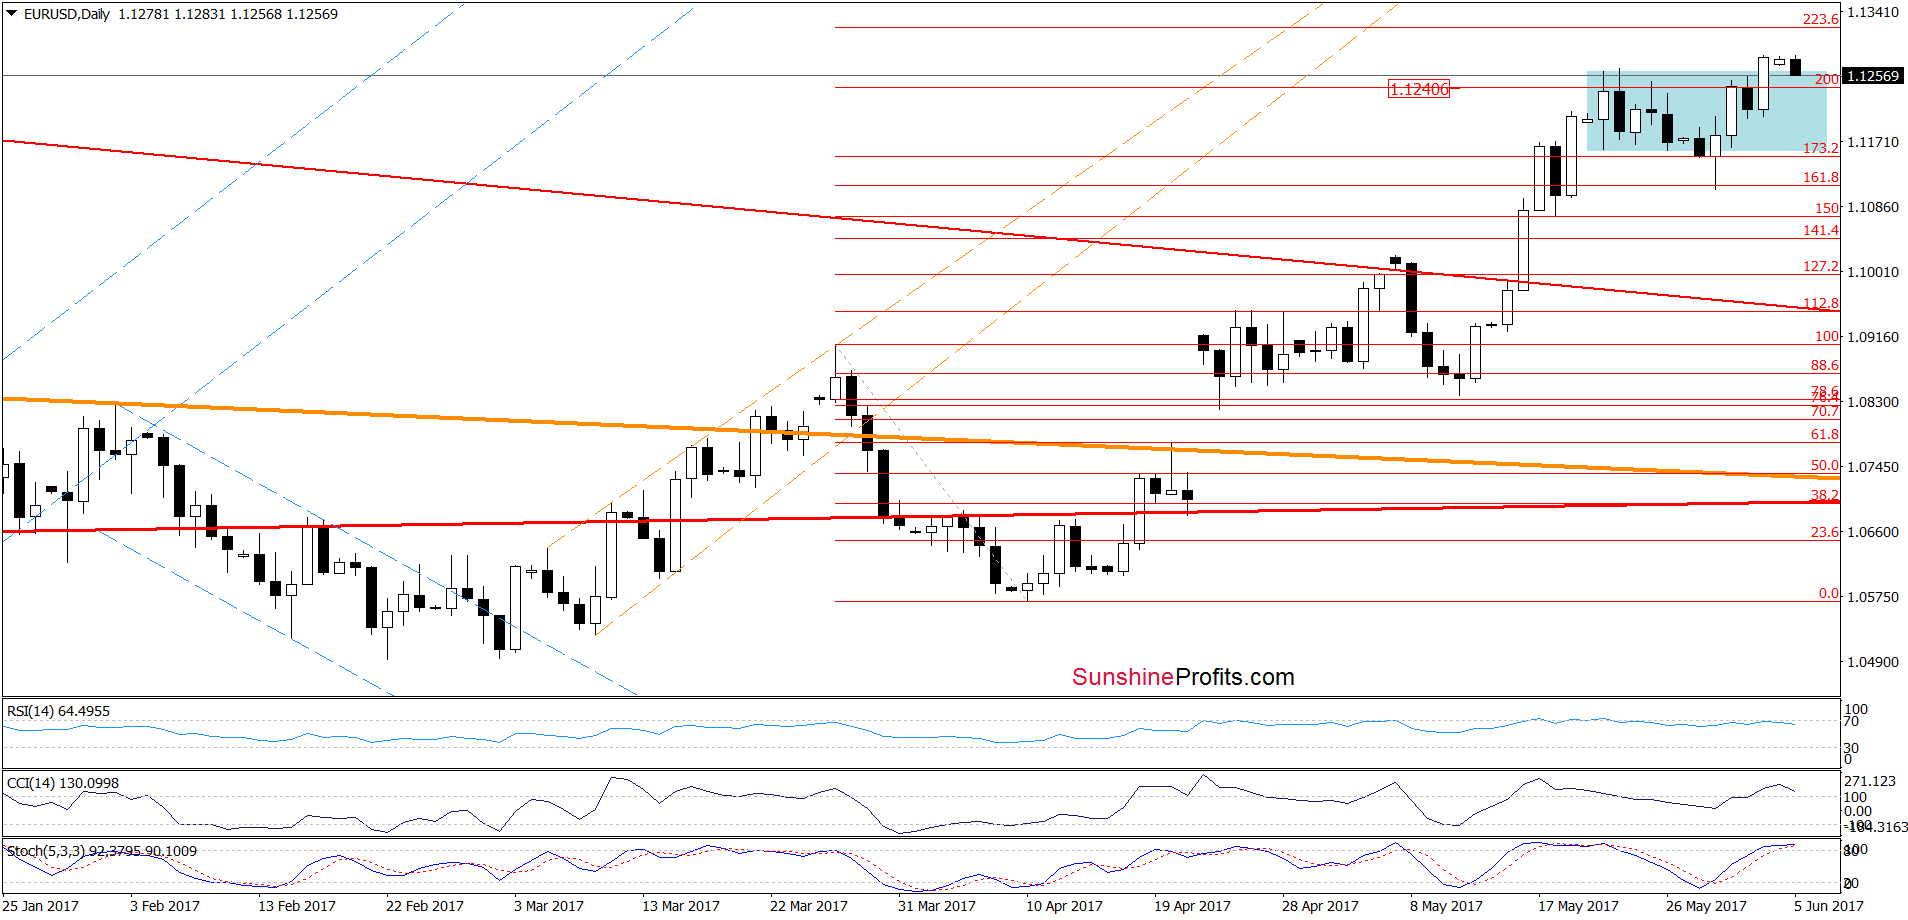
Looking at the charts, we see that Friday’s disappointing U.S. data pushed the euro above the upper border of the blue consolidation, which approached EUR/USD to the yellow resistance zone marked on the weekly chart. As you see, the proximity to this area encouraged currency bears to act, which resulted in a pullback earlier today. Thanks to this drop, the exchange rate slipped under the previous highs, which is a negative event. However, it will turn into bearish only if the pair closes today’s session inside the consolidation. If we see such price action, it will likely trigger further deterioration in the coming days, but until this time, waiting at the sidelines for a profitable opportunity is justified from the risk/reward perspective.
Very short-term outlook: mixed
Short-term outlook: mixed with bearish bias
MT outlook: mixed
LT outlook: mixed
Trading position (short-term; our opinion): No positions are justified from the risk/reward perspective. We will keep you informed should anything change, or should we see a confirmation/invalidation of the above.
USD/CHF
Quoting our Thursday’s commentary on this currency pair:
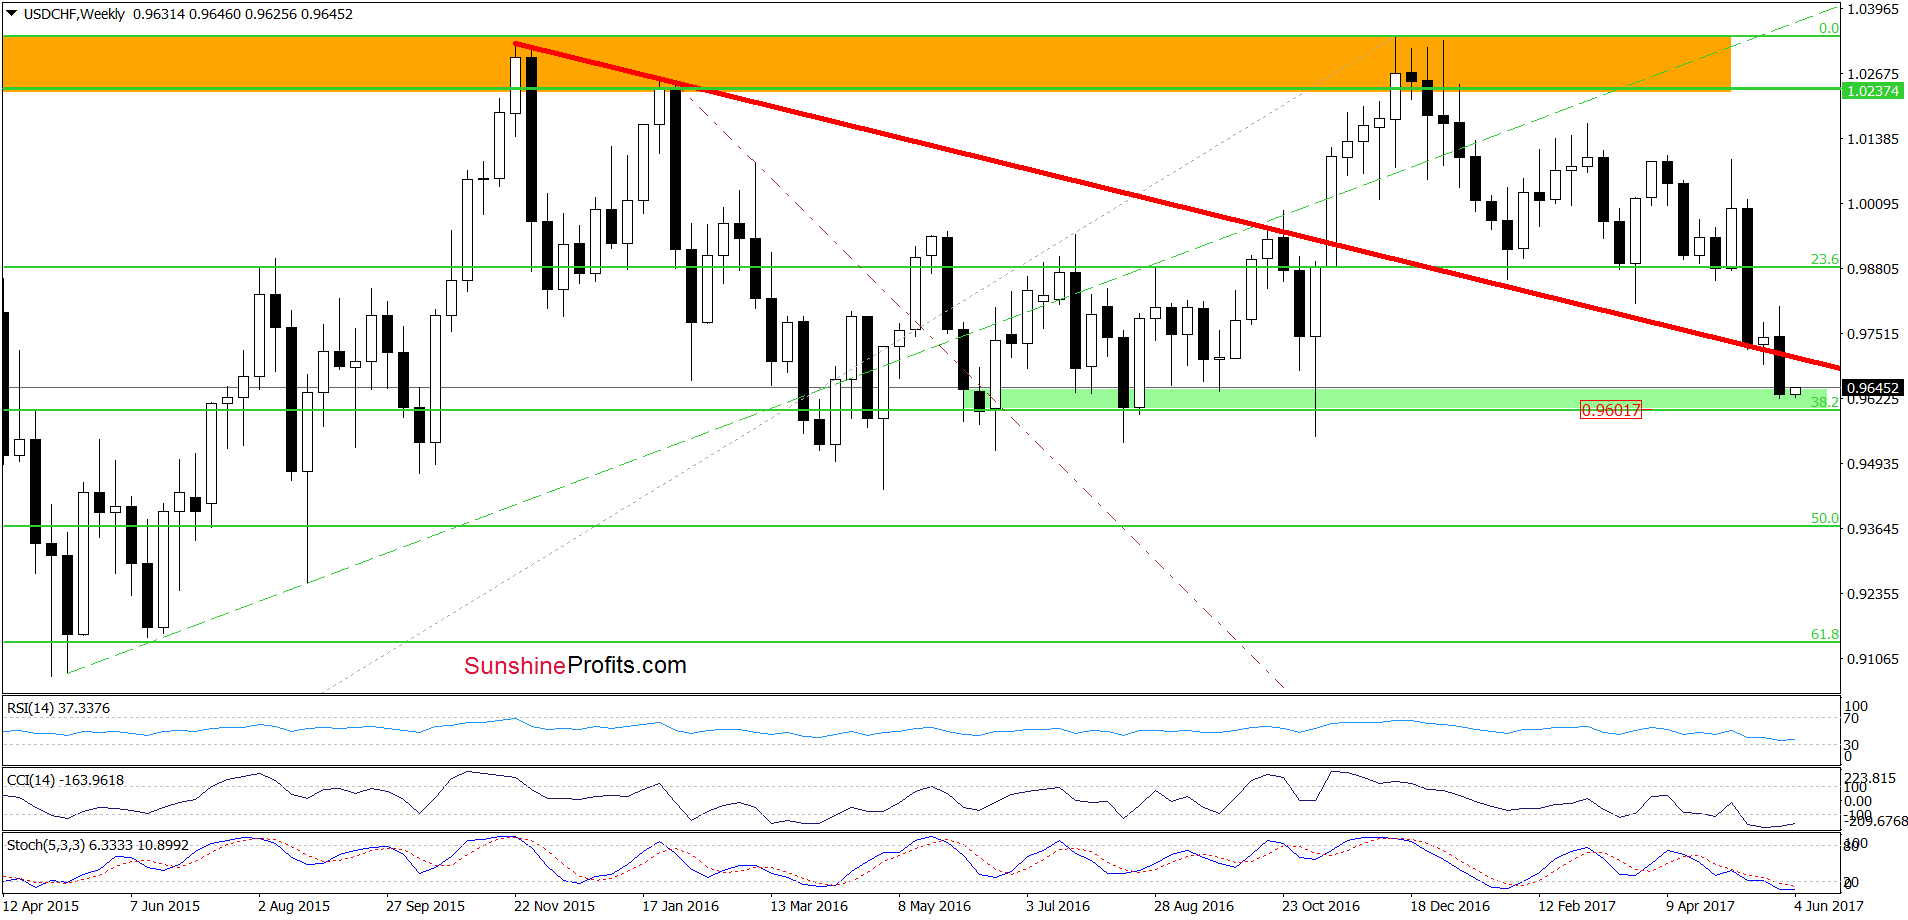
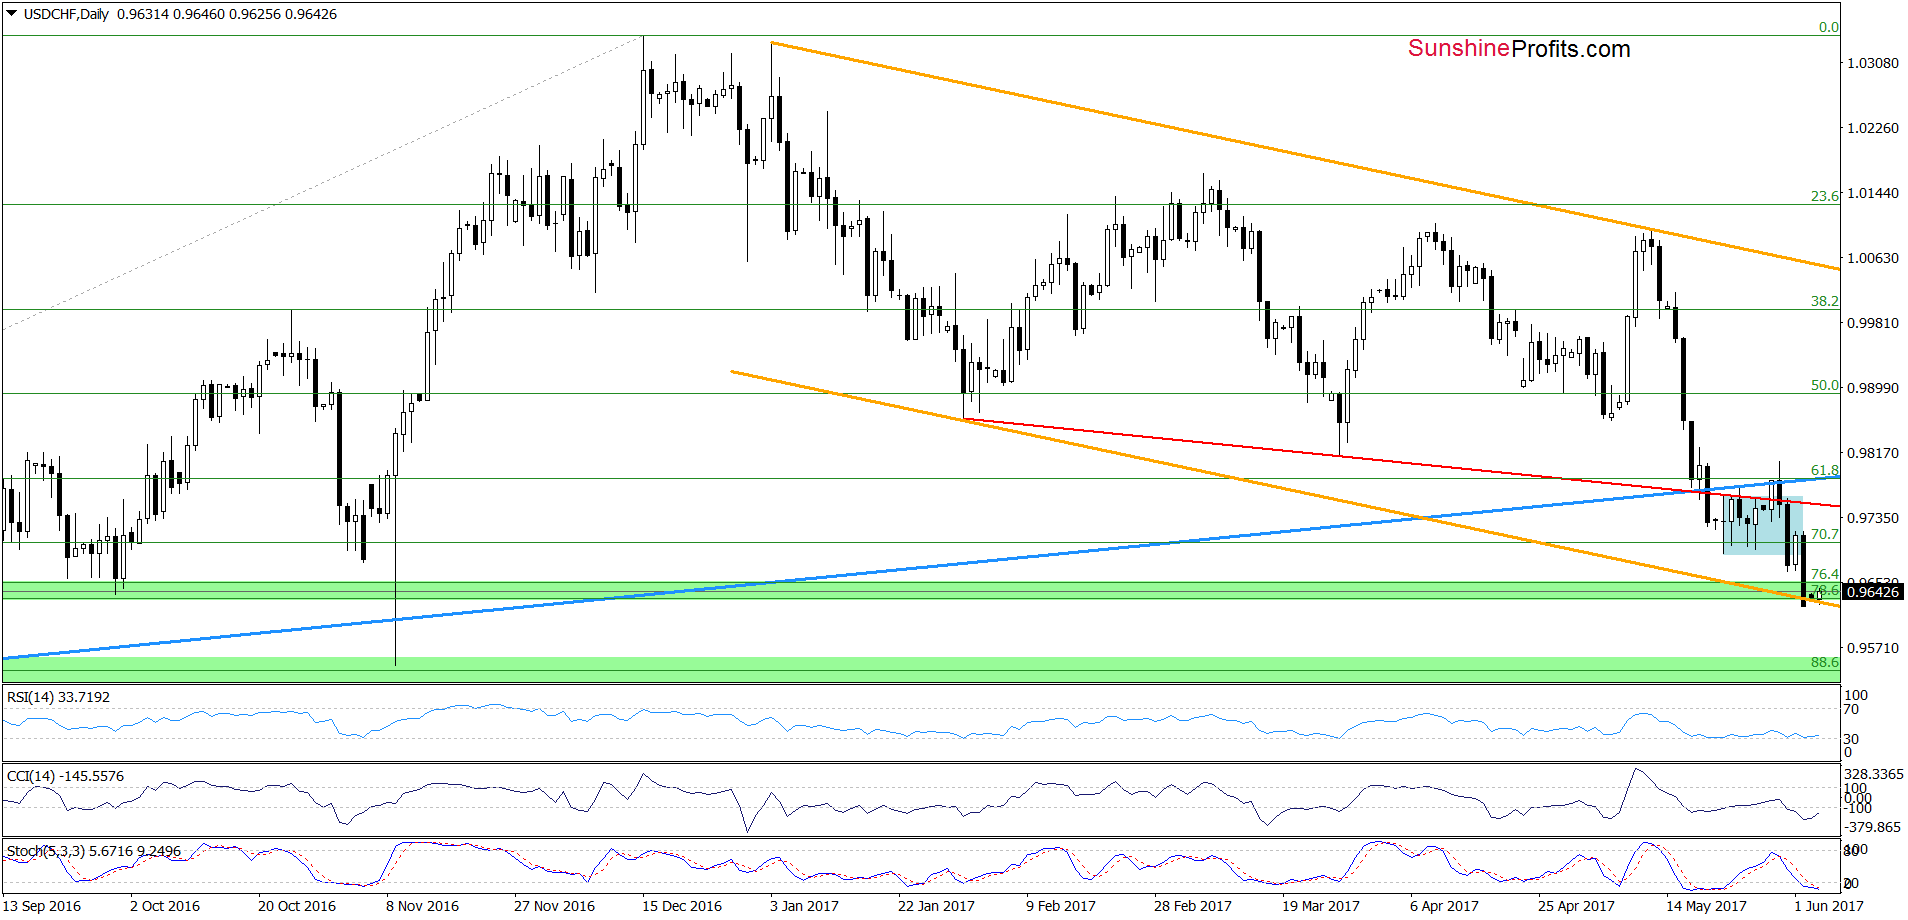
(…) a drop under the long-term red declining support line (…) triggered a decline under the lower border of the blue consolidation (marked on the daily chart) and the 70.7% Fibonacci retracement, which increases the probability of a test of the green support zone created by the 76.4% and 78.6% Fibonacci retracements in the coming day(s). This scenario is also reinforced by the current position of the daily indicators (the sell signals remain in cards), which suggests that today’s upswing may be just a verification of yesterday’s breakdown.
From today’s point of view, we see that the situation developed in line with the above scenario and USD/CHF extended losses, slipping slightly below the green support zone created by the 76.4% and 78.6% Fibonacci retracements. Despite this drop, currency bulls pushed the exchange rate a bit higher earlier today, which resulted in a comeback above the lower border of the orange declining trend channel. In this way, the exchange rate invalidated the earlier tint breakdown, which is a positive development and suggests further improvement in te followig days. Nevertheless, such price action will be more likely if we see a daily closurea above the previously-broken retracements and buy signals generated by the indicators. Until this time, one more downswing and a test of the 38.2% Fibonacci retracement marked on the weekly chart can’t be ruled out.
Very short-term outlook: mixed
Short-term outlook: mixed with bullish bias
MT outlook: mixed
LT outlook: mixed
Trading position (short-term; our opinion): No positions are justified from the risk/reward perspective. We will keep you informed should anything change, or should we see a confirmation/invalidation of the above.
AUD/USD
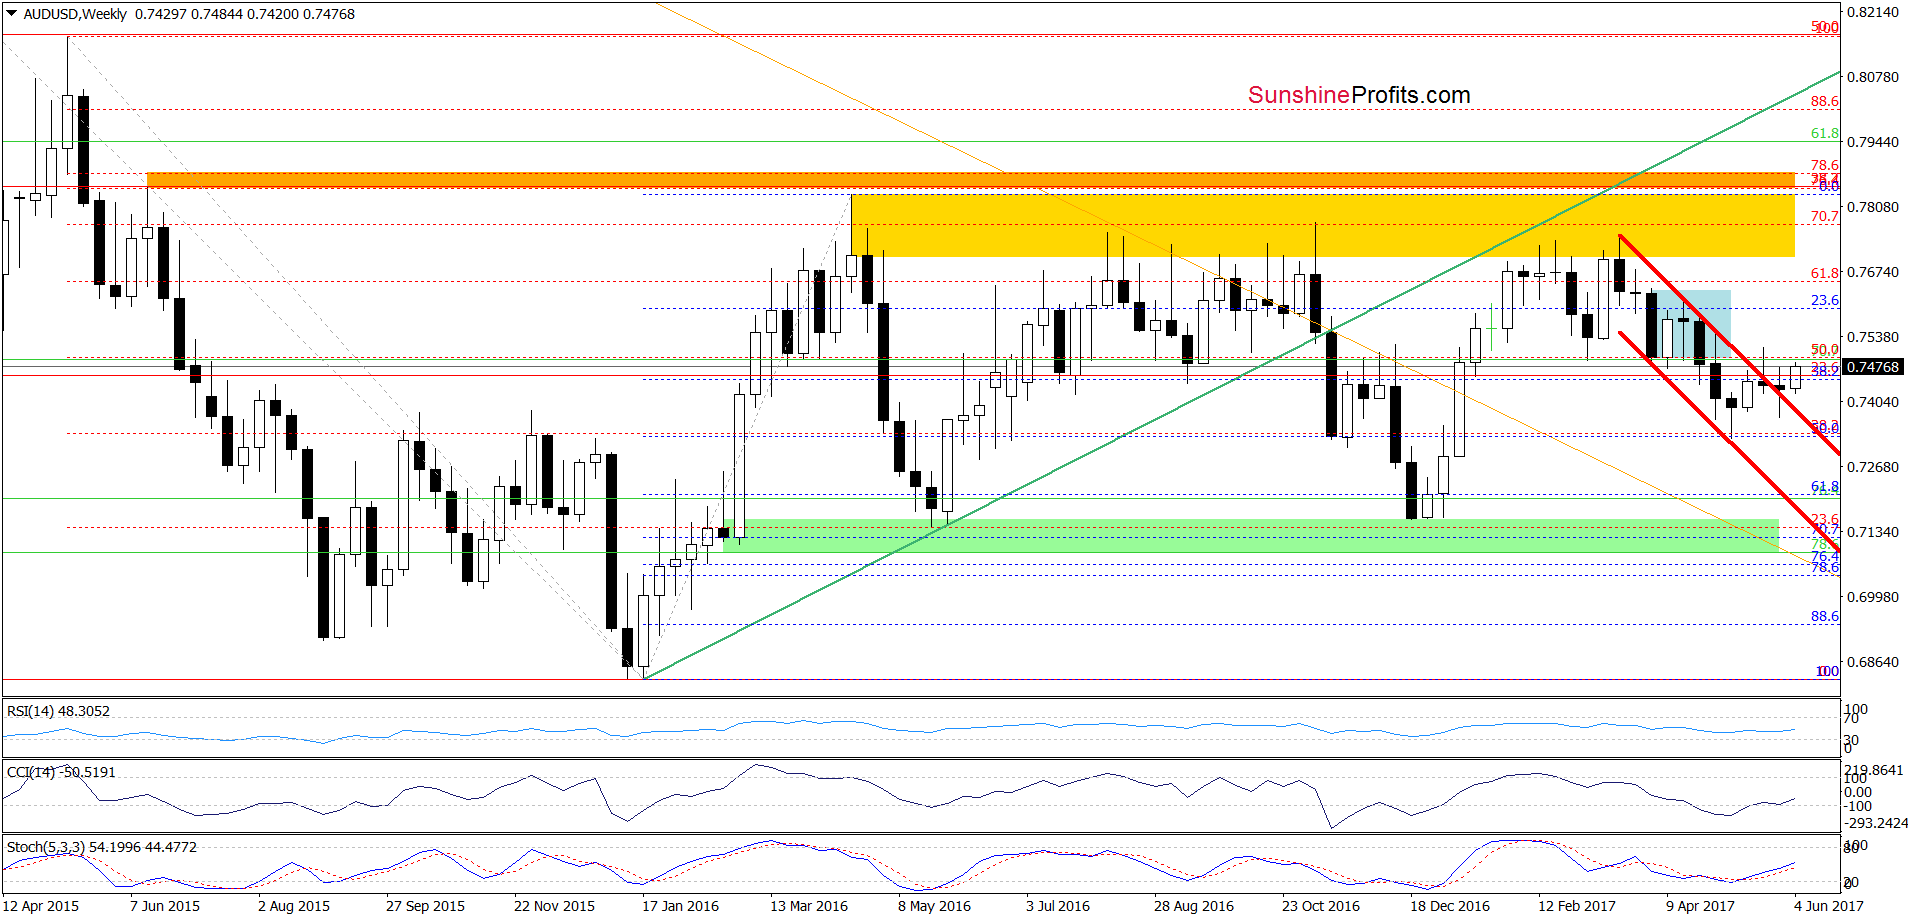
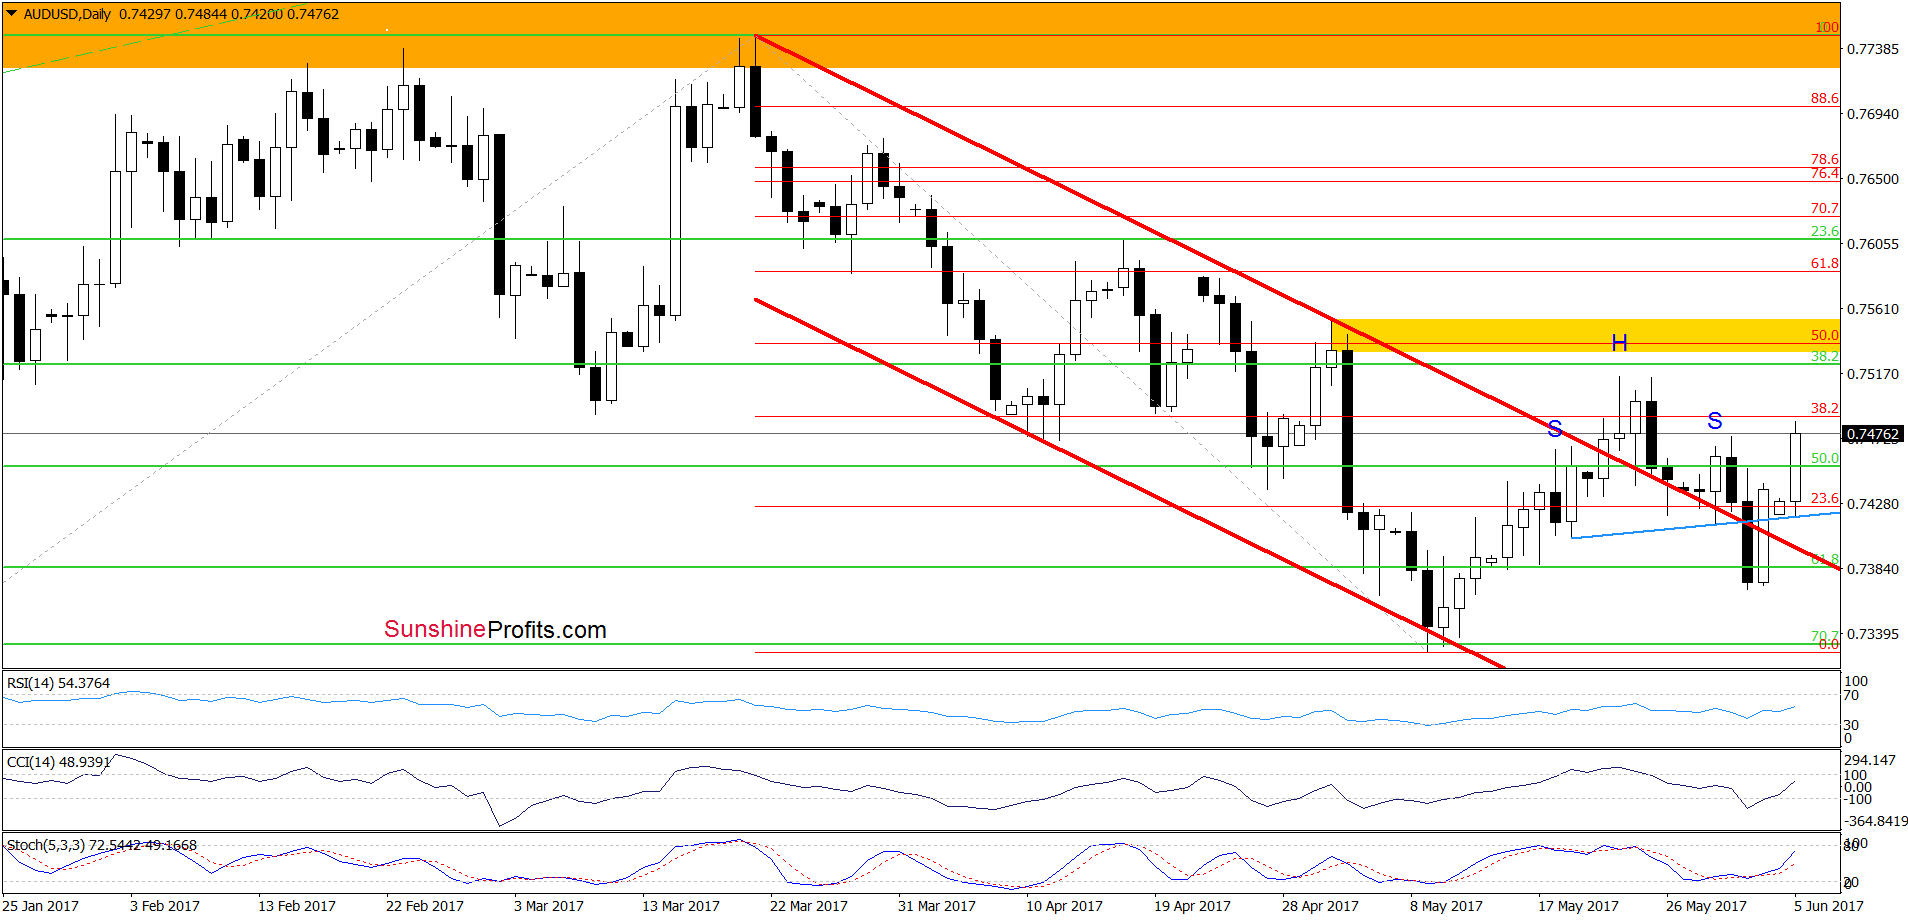
The first thing that catches the eye on the daily chart is an invalidation of the breakdown under the blue support line (a potential neck line of the bearish head and shoulders formation). Thanks to Friday’s rebound, the exchange rate also came back above the upper border of the red declining trend channel, which triggered further improvement earlier today. Taking these facts into account and the buy signals generated by the indicators, we think that AUD/USD will move higher and test the recent highs and the yellow resistance zone in the coming days.
Very short-term outlook: bullish
Short-term outlook: mixed
MT outlook: mixed
LT outlook: mixed
Trading position (short-term; our opinion): No positions are justified from the risk/reward perspective. We will keep you informed should anything change, or should we see a confirmation/invalidation of the above.
Thank you.
Nadia Simmons
Forex & Oil Trading Strategist
Przemyslaw Radomski, CFA
Founder, Editor-in-chief, Gold & Silver Fund Manager
Gold & Silver Trading Alerts
Forex Trading Alerts
Oil Investment Updates
Oil Trading Alerts

