

In the previous week, GBP/USD hit a fresh May peak, but then the pair stuck in the consolidation. Is this a show of weakness or pause before another uswing?
In our opinion the following forex trading positions are justified - summary:
- EUR/USD: none
- GBP/USD: none
- USD/JPY: long (a stop-loss order at 107.62; the initial upside target at 111.16)
- USD/CAD: none
- USD/CHF: none
- AUD/USD: none
EUR/USD
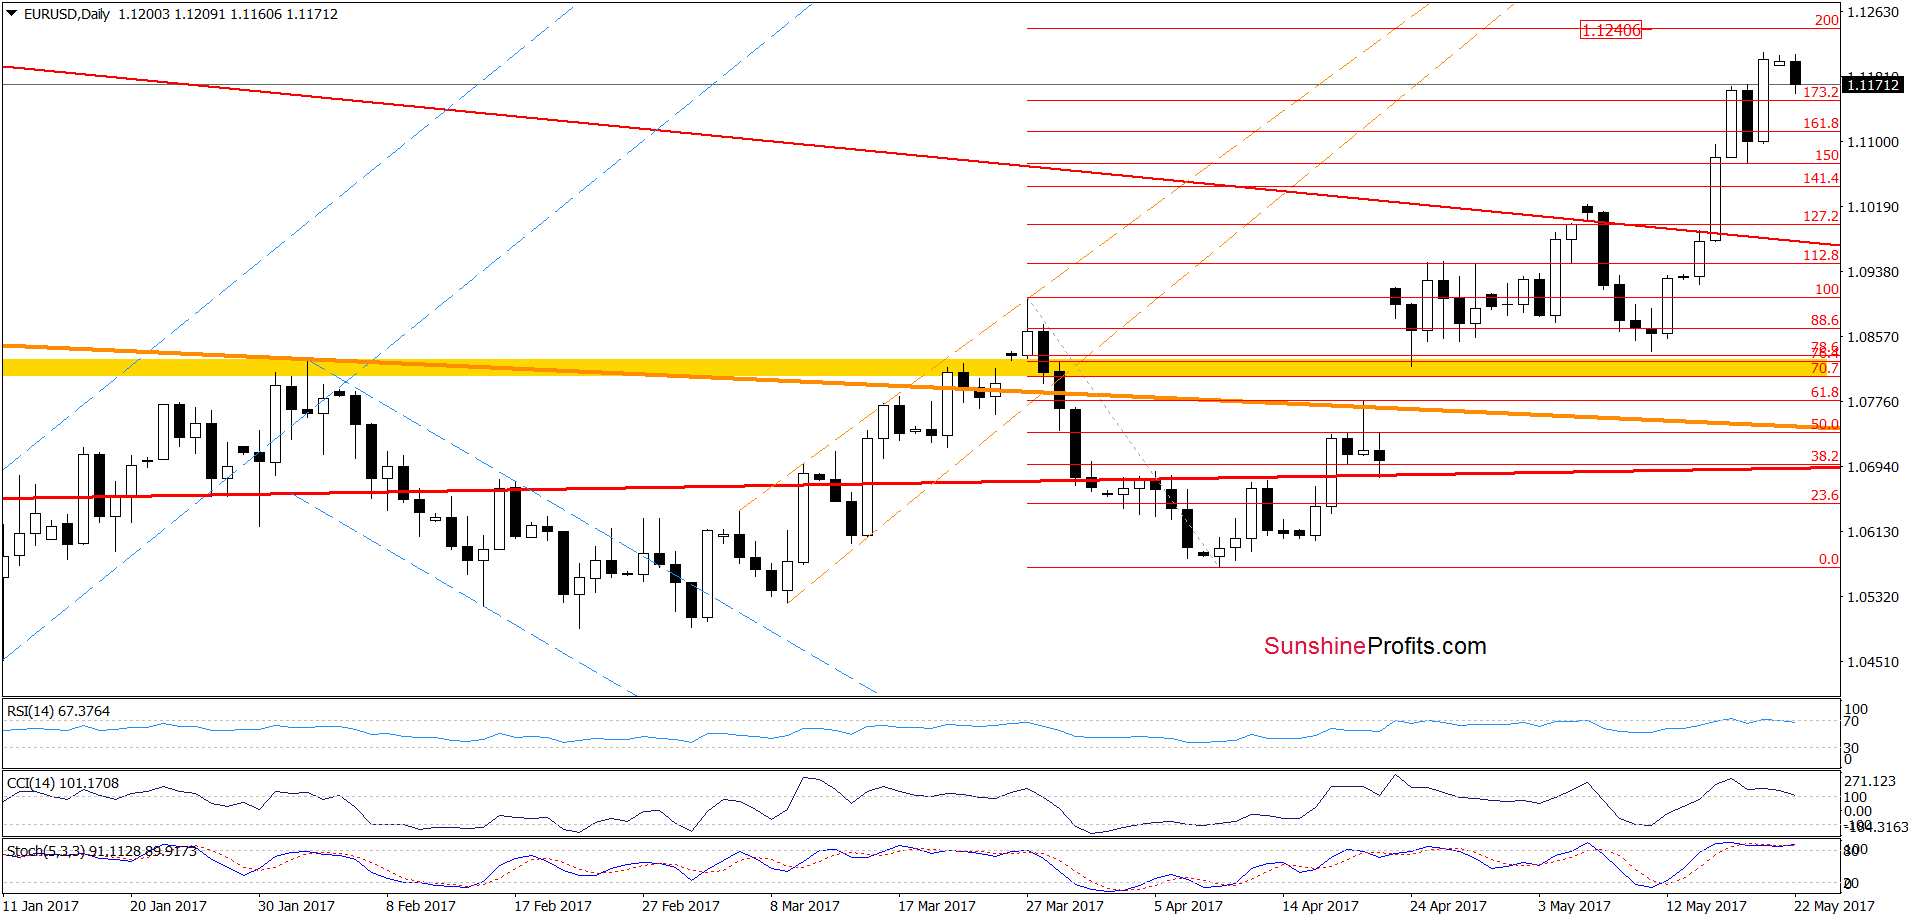
From today’s point of view, we see that EUR/USD moved higher once again on Friday, which resulted in a climb to a fresh May peak. Although currency bears pushed the exchange rate lower earlier today, it still remains above the earlier highs (Wednesday’s and Thursday’s peaks) and the 173.2% Fibonacci extension. Additionally, there are no sell signals generated by the daily indicators at the moment of writing these words, which suggests that another upswing and a test of the 200% Fibonacci extension and the 70.7% Fibonacci retracement based on the entire May-January downward move (around 1.1242) is likely.
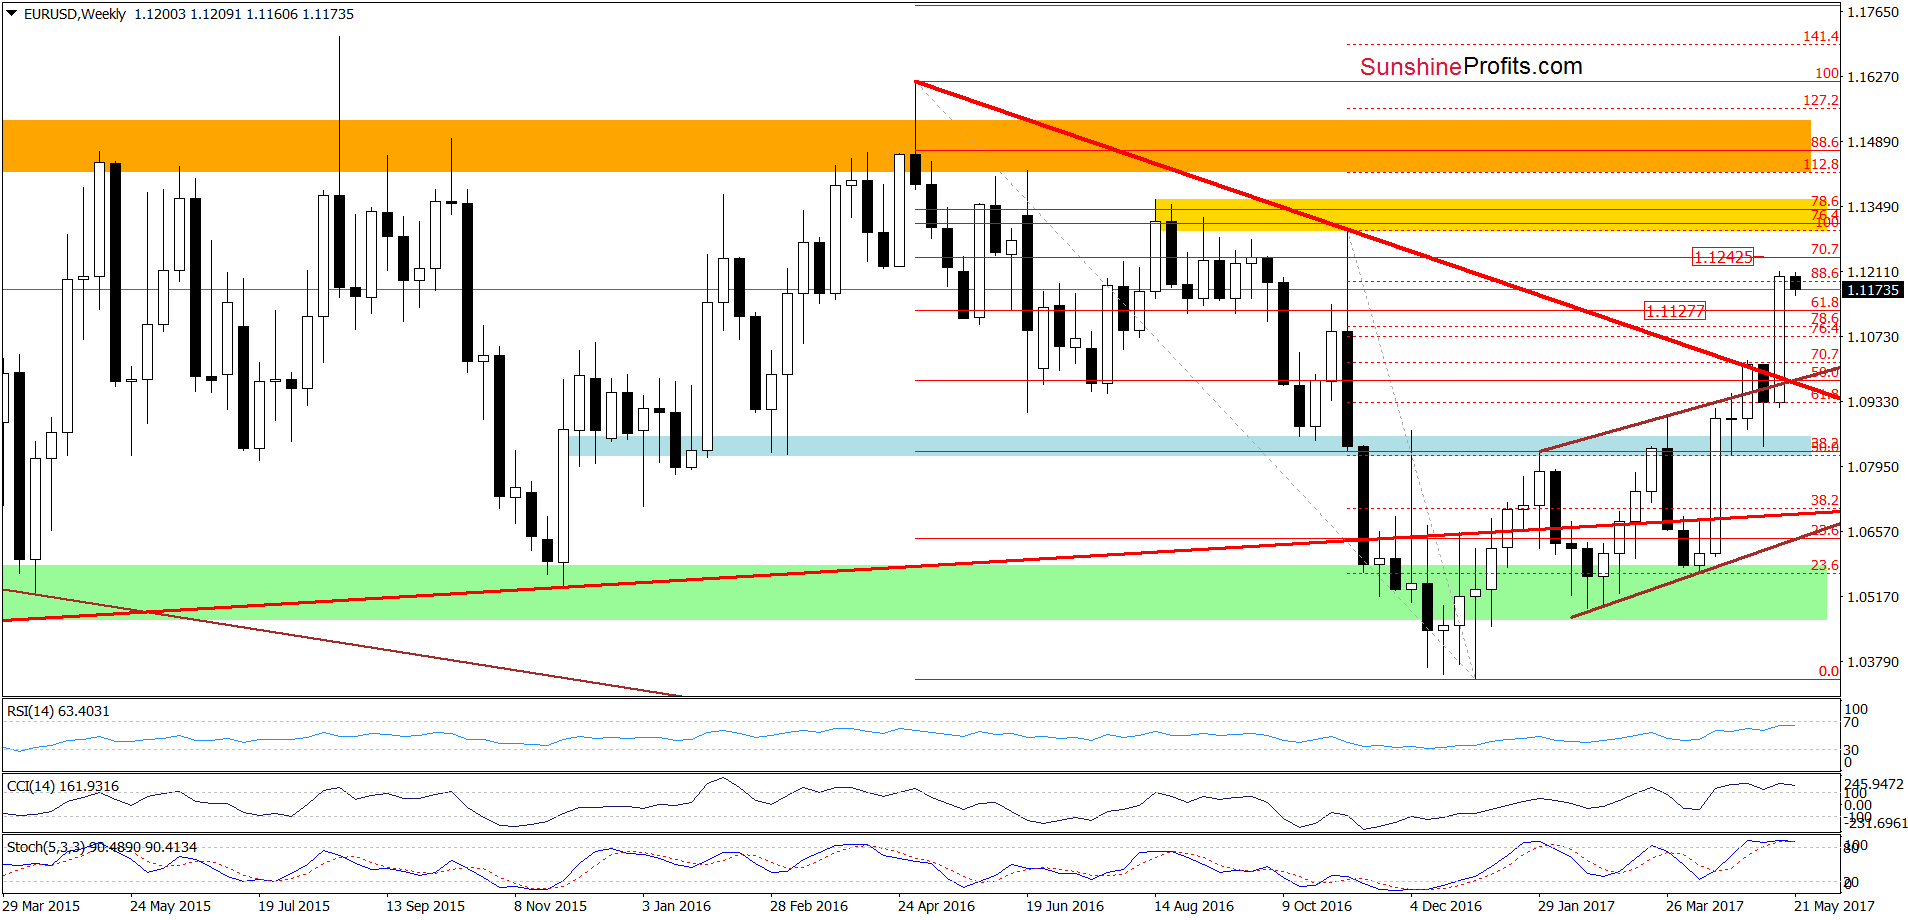
Nevertheless, we should keep in mind that daily and weekly indicators are overbought and very close to generating sell signal, which increases the probability that reversal and lower values of EUR/USD in the coming week.
Very short-term outlook: mixed
Short-term outlook: mixed with bearish bias
MT outlook: mixed
LT outlook: mixed
Trading position (short-term; our opinion): No positions are justified from the risk/reward perspective. We will keep you informed should anything change, or should we see a confirmation/invalidation of the above.
GBP/USD
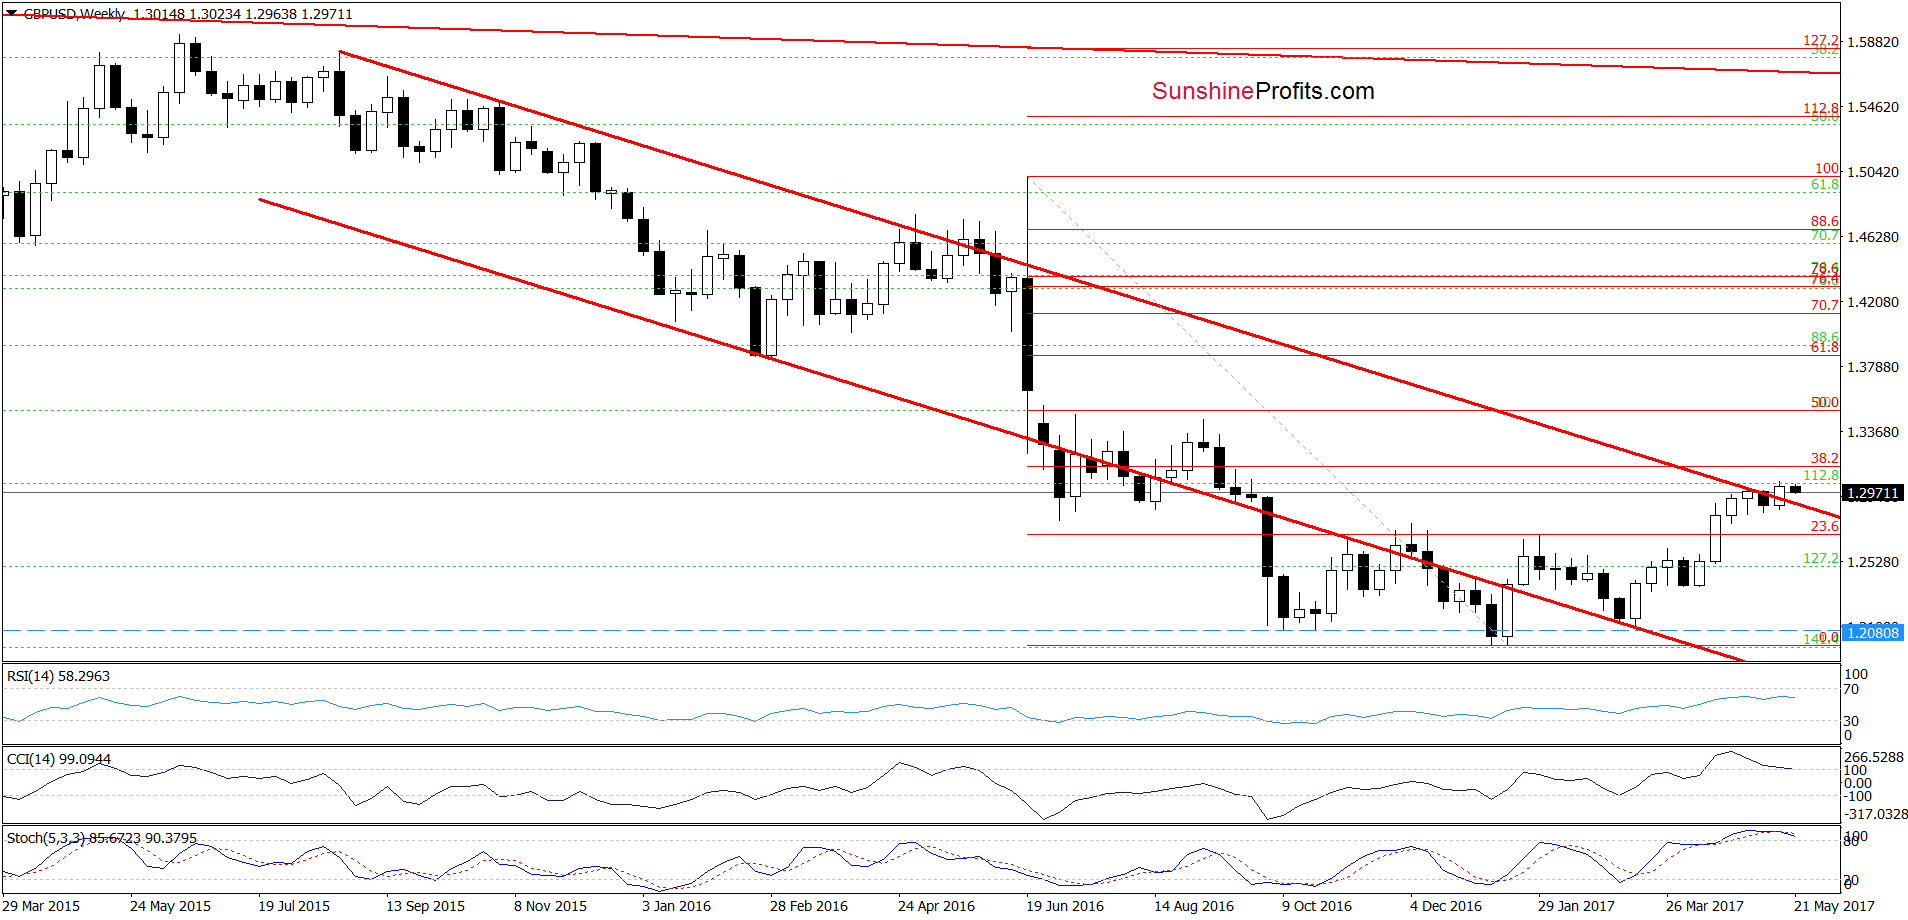
The first thing that catches the eye on the weekly chart is the breakout above the upper line of the red declining trend channel. Although this is a bullish event, the proximity to the 38.2% Fibonacci retracement based on the June-January downward move and the current position of the weekly indicators suggest that reversal in the coming week should not surprise us.
Will the very short-term chart give us more bearish signals? Let’s check.
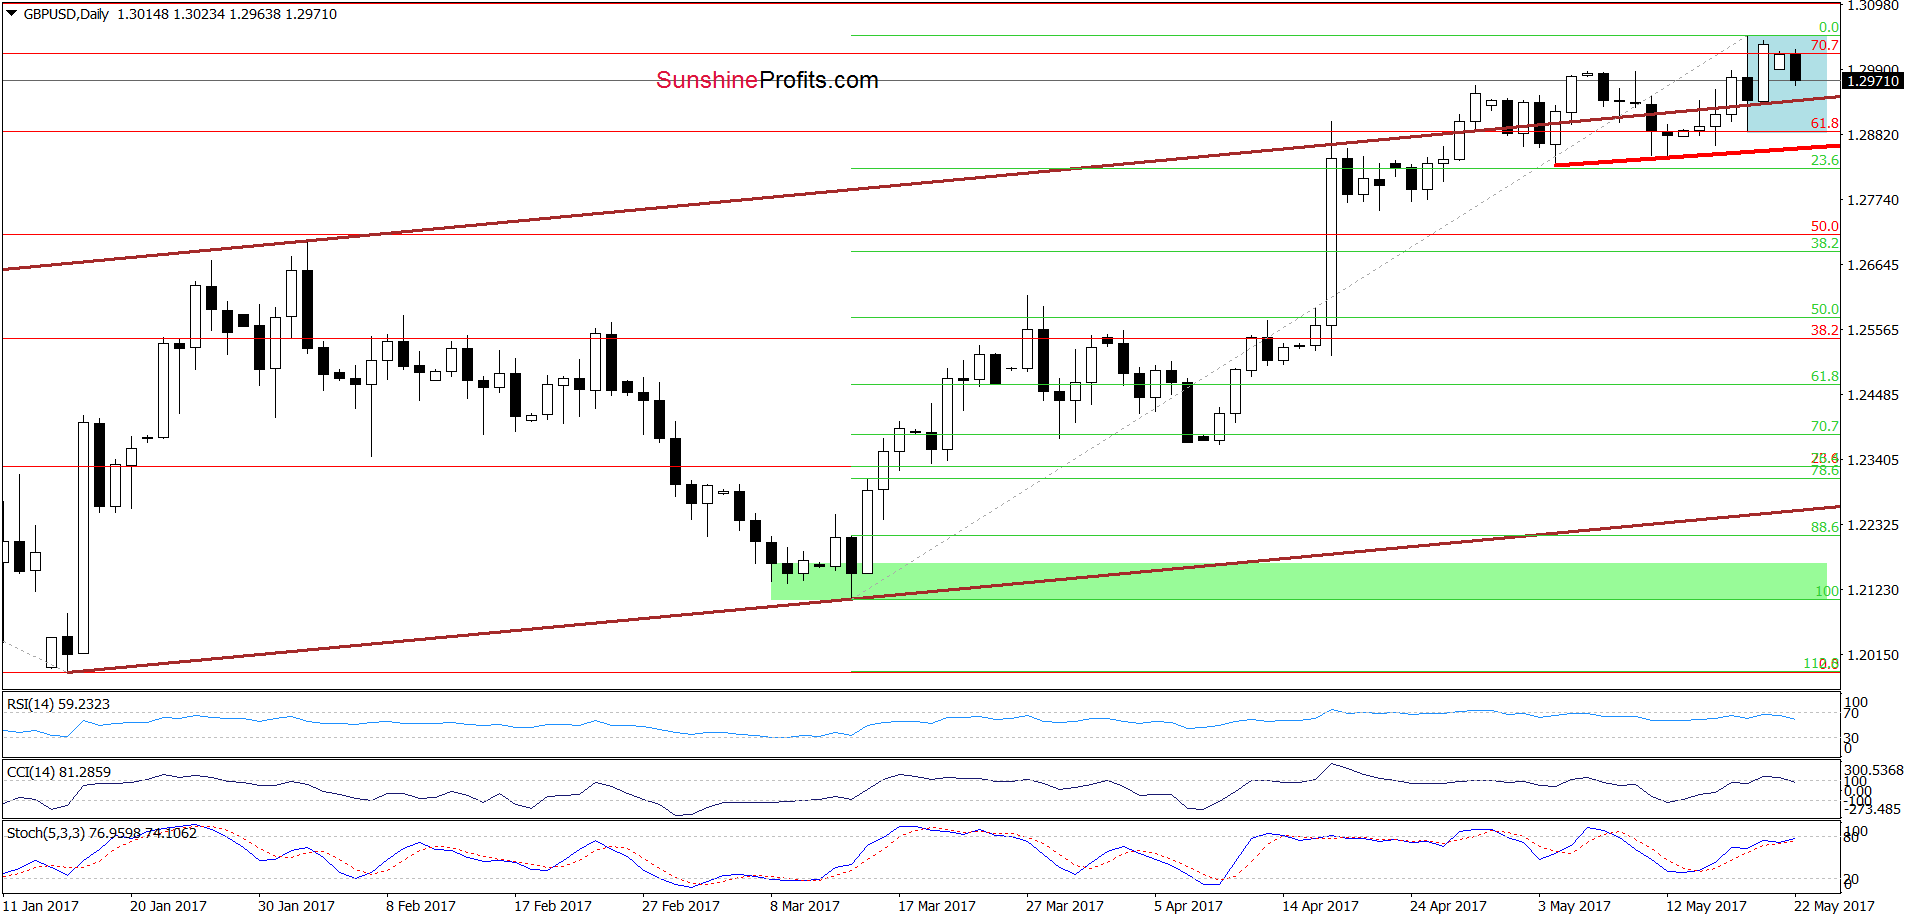
From the daily perspective, we see that although GBP/USD moved higher and increased above the previous highs, the exchange rate stuck in the blue consolidation, which together with the current position of the daily indicators suggests that the space for gains is limited and reversal may be just around the corner. Therefore, if he pair drops under the lower border of the consolidation, the upper line of the brown rising trend channel and the red support line based on the previous lows, we’ll see further deterioration. In this case, we’ll likely open short positions.
Very short-term outlook: mixed with bearish bias
Short-term outlook: mixed with bearish bias
MT outlook: mixed
LT outlook: mixed
Trading position (short-term; our opinion): No positions are justified from the risk/reward perspective. We will keep you informed should anything change, or should we see a confirmation/invalidation of the above.
USD/CAD
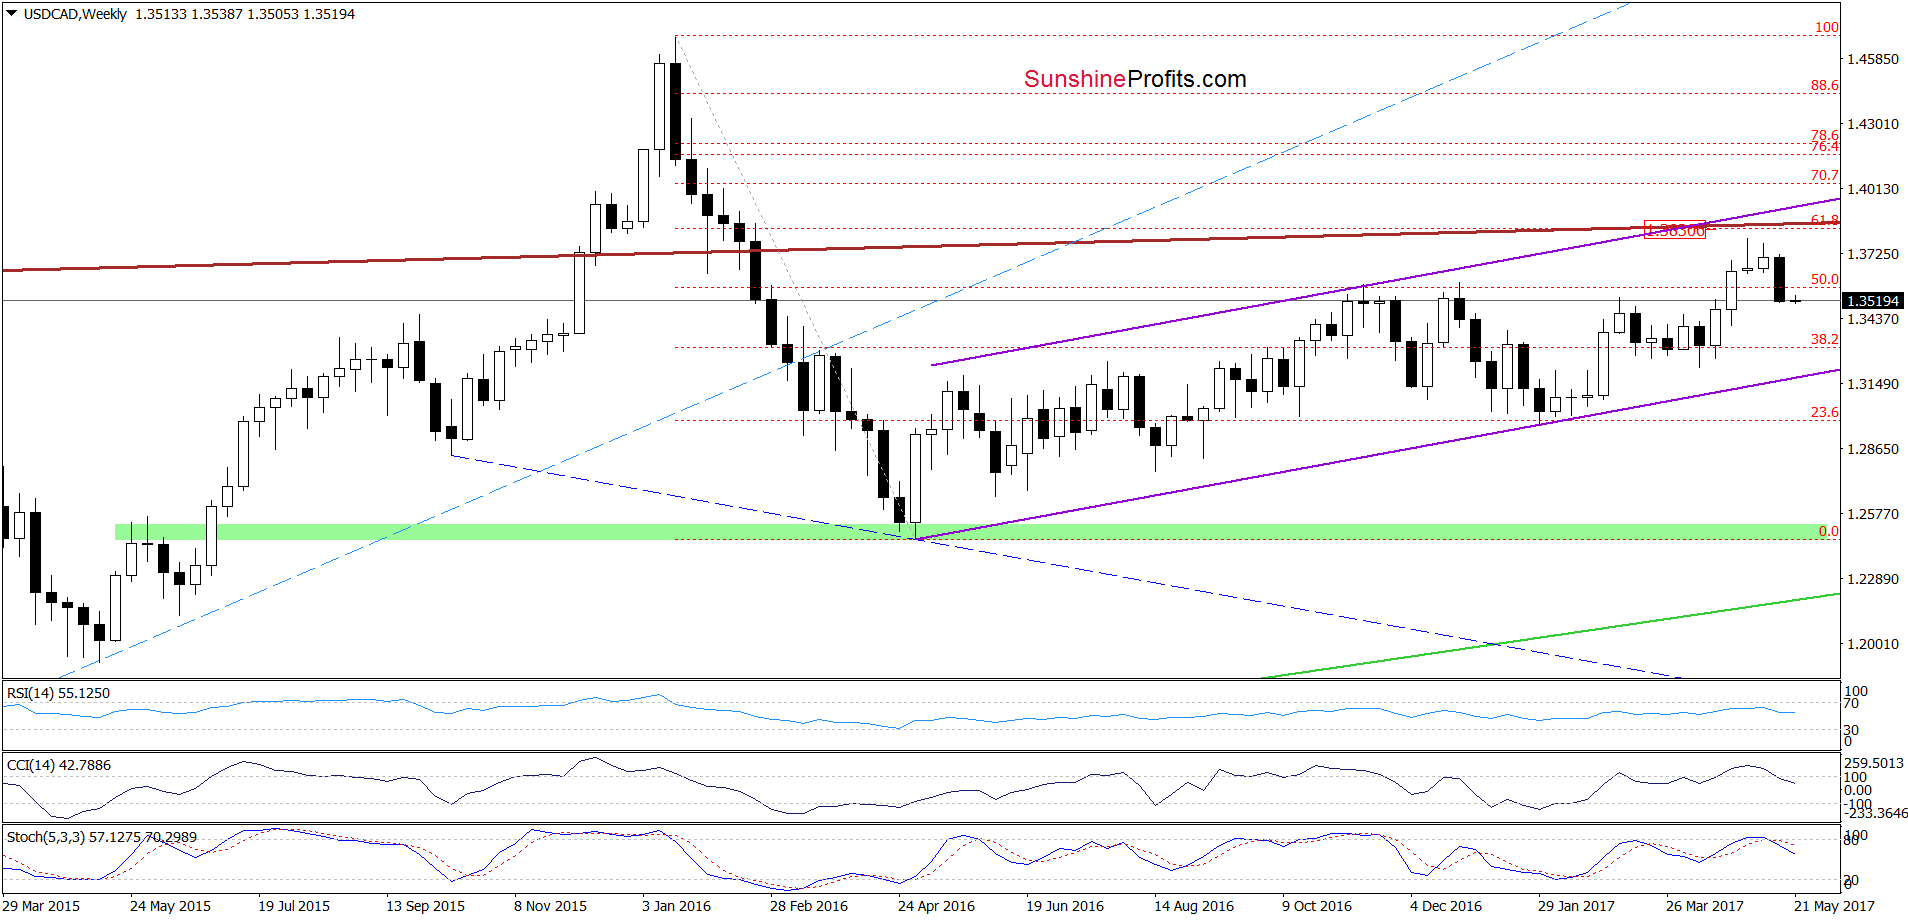
On the weekly chart, we see that USD/CAD moved sharply lower in the previous week, which together with the sell signals generated by the indicators suggest lower values of the exchange rate in the coming week.
How low could the pair go? Let’s examine the daily chart and find out.
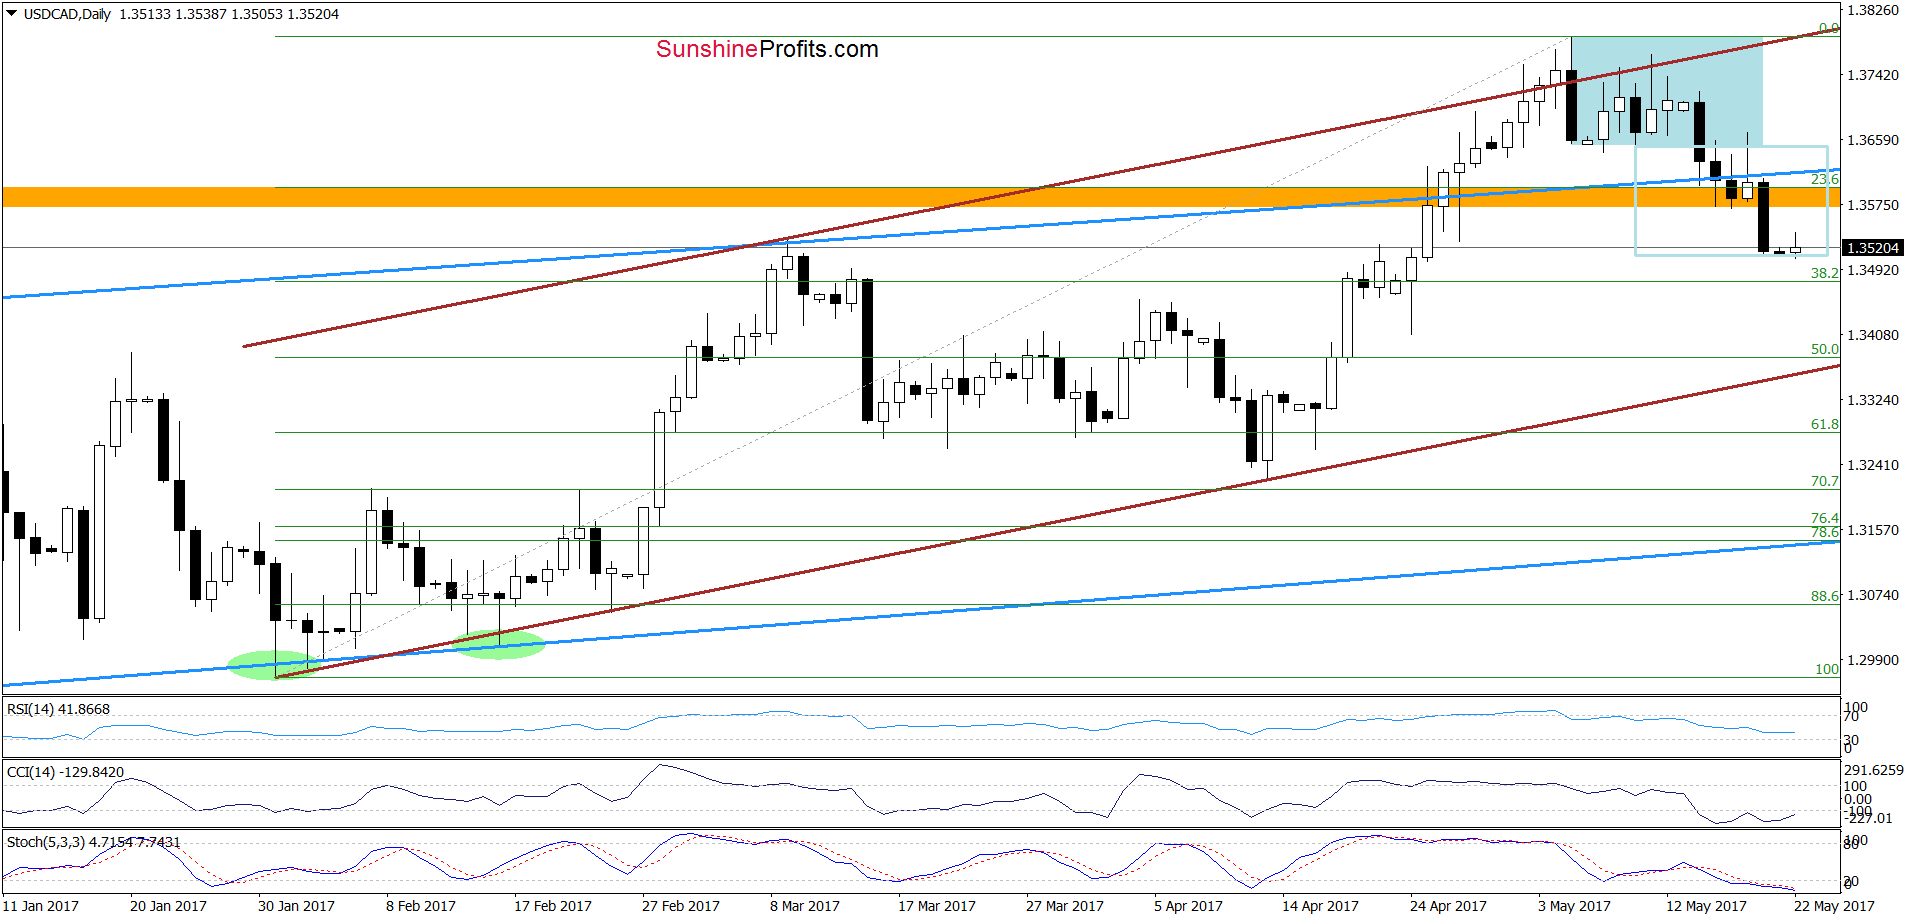
Looking at the daily chart, we see that USD/CAD verified the breakdown under the lower line of the blue consolidation, which resulted in a drop below the upper border of the blue rising trend channel and the orange support zone created by the November and December highs. As a result, the exchange rate slipped to 1.3508, where the size of the downward move corresponded to the height of the blue consolidation. Although such situation could reduce the selling pressure, it seems to us that the par will extend losses and test the 38.2% Fibonacci retracement based on the entire January-May upward move. If this support is broken, we’ll see a decline to the next Fibonacci retracement and the lower border of the brown rising trend channel. However, the current position of the daily indictors indicates that reversal in the coming week should not surprise us.
Very short-term outlook: mixed with bearish bias
Short-term outlook: mixed
MT outlook: mixed
LT outlook: mixed
Trading position (short-term; our opinion): No positions are justified from the risk/reward perspective. We will keep you informed should anything change, or should we see a confirmation/invalidation of the above.
Thank you.
Nadia Simmons
Forex & Oil Trading Strategist
Przemyslaw Radomski, CFA
Founder, Editor-in-chief, Gold & Silver Fund Manager
Gold & Silver Trading Alerts
Forex Trading Alerts
Oil Investment Updates
Oil Trading Alerts

