

Earlier today, EUR/USD verified the earlier breakdown under the previously-broken long-term red resistance line based on the March and November 2015 lows once again. What does it mean for the exchange rate?
In our opinion the following forex trading positions are justified - summary:
- EUR/USD: short (a stop-loss order at 1.0967; the initial downside target at 1.0521)
- GBP/USD: short (a stop-loss order at 1.2738; the downside target at 1.2157)
- USD/JPY: none
- USD/CAD: none
- USD/CHF: none
- AUD/USD: none
EUR/USD
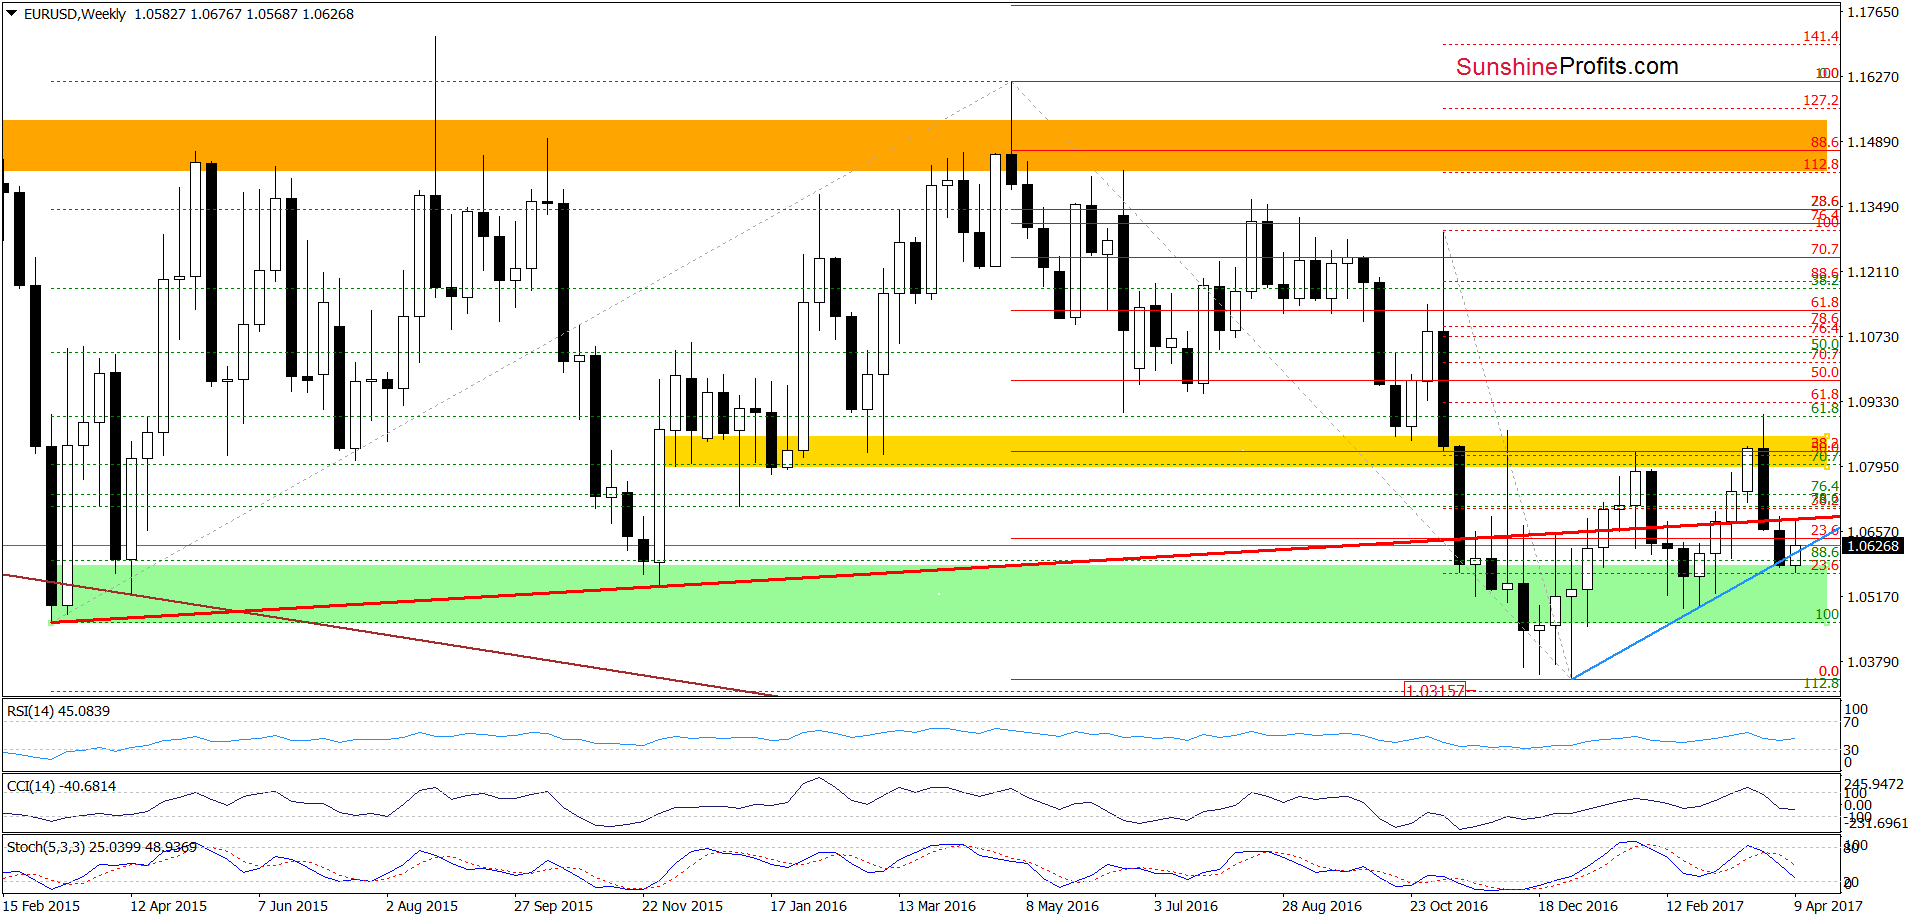
From the medium-term perspective, we see that EUR/USD moved higher and climbed to the previously-broken long-term red resistance line based on the March and November 2015 lows and then reversed. Such price action looks like another verification of the earlier breakdown and suggests further deterioration in the coming week(s) – especially when we factor in the sell signals generated by the weekly indicators.
How did this move affect the very short-term picture? Let’s examine the very short-term chart and find out.
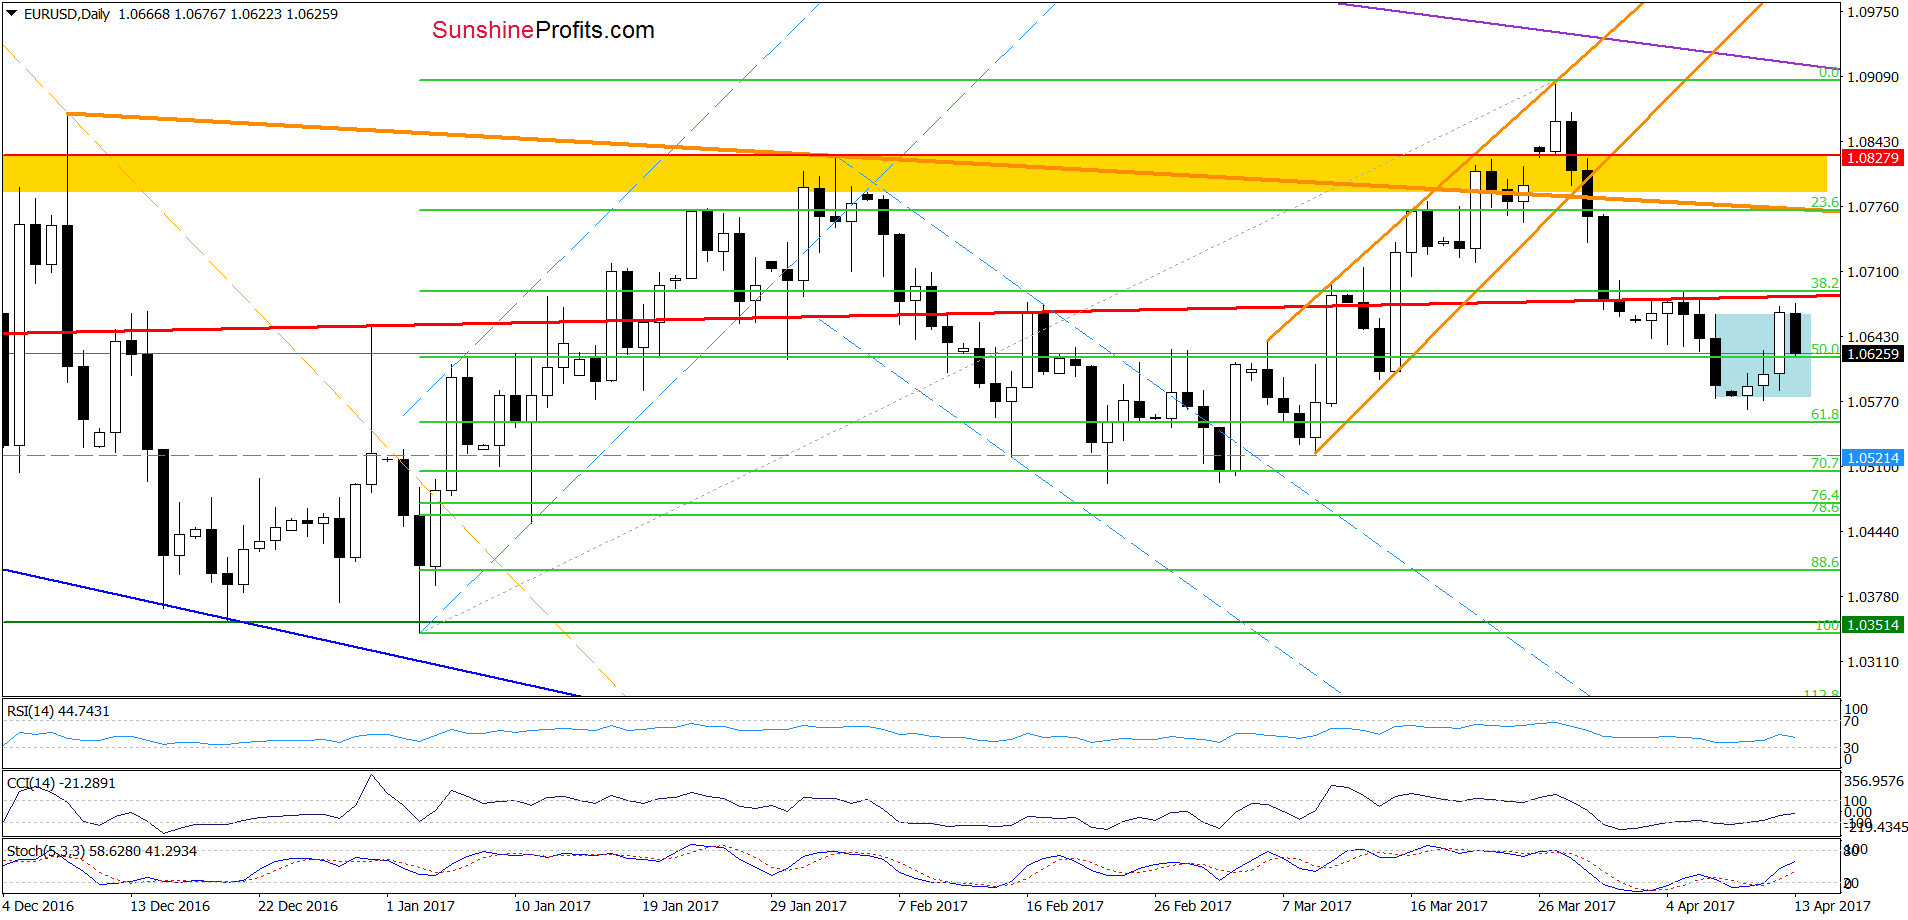
On the daily chart, we see that although EUR/USD climbed slightly above the upper border of the blue consolidation earlier today, currency bulls didn’t manage to hold this level, which resulted in a pullback and invalidation of the earlier breakout. This negative event triggered a quite sharp decline, which suggests lower values of the exchange rate and a test of the recent lows in the coming days.
Very short-term outlook: bearish
Short-term outlook: mixed with bearish bias
MT outlook: mixed
LT outlook: mixed
Trading position (short-term; our opinion): Short positions (with a stop-loss order at 1.0967 and the initial downside target at 1.0521) are justified from the risk/reward perspective. We will keep you informed should anything change, or should we see a confirmation/invalidation of the above.
USD/JPY
Quoting our last commentary on this currency pair:
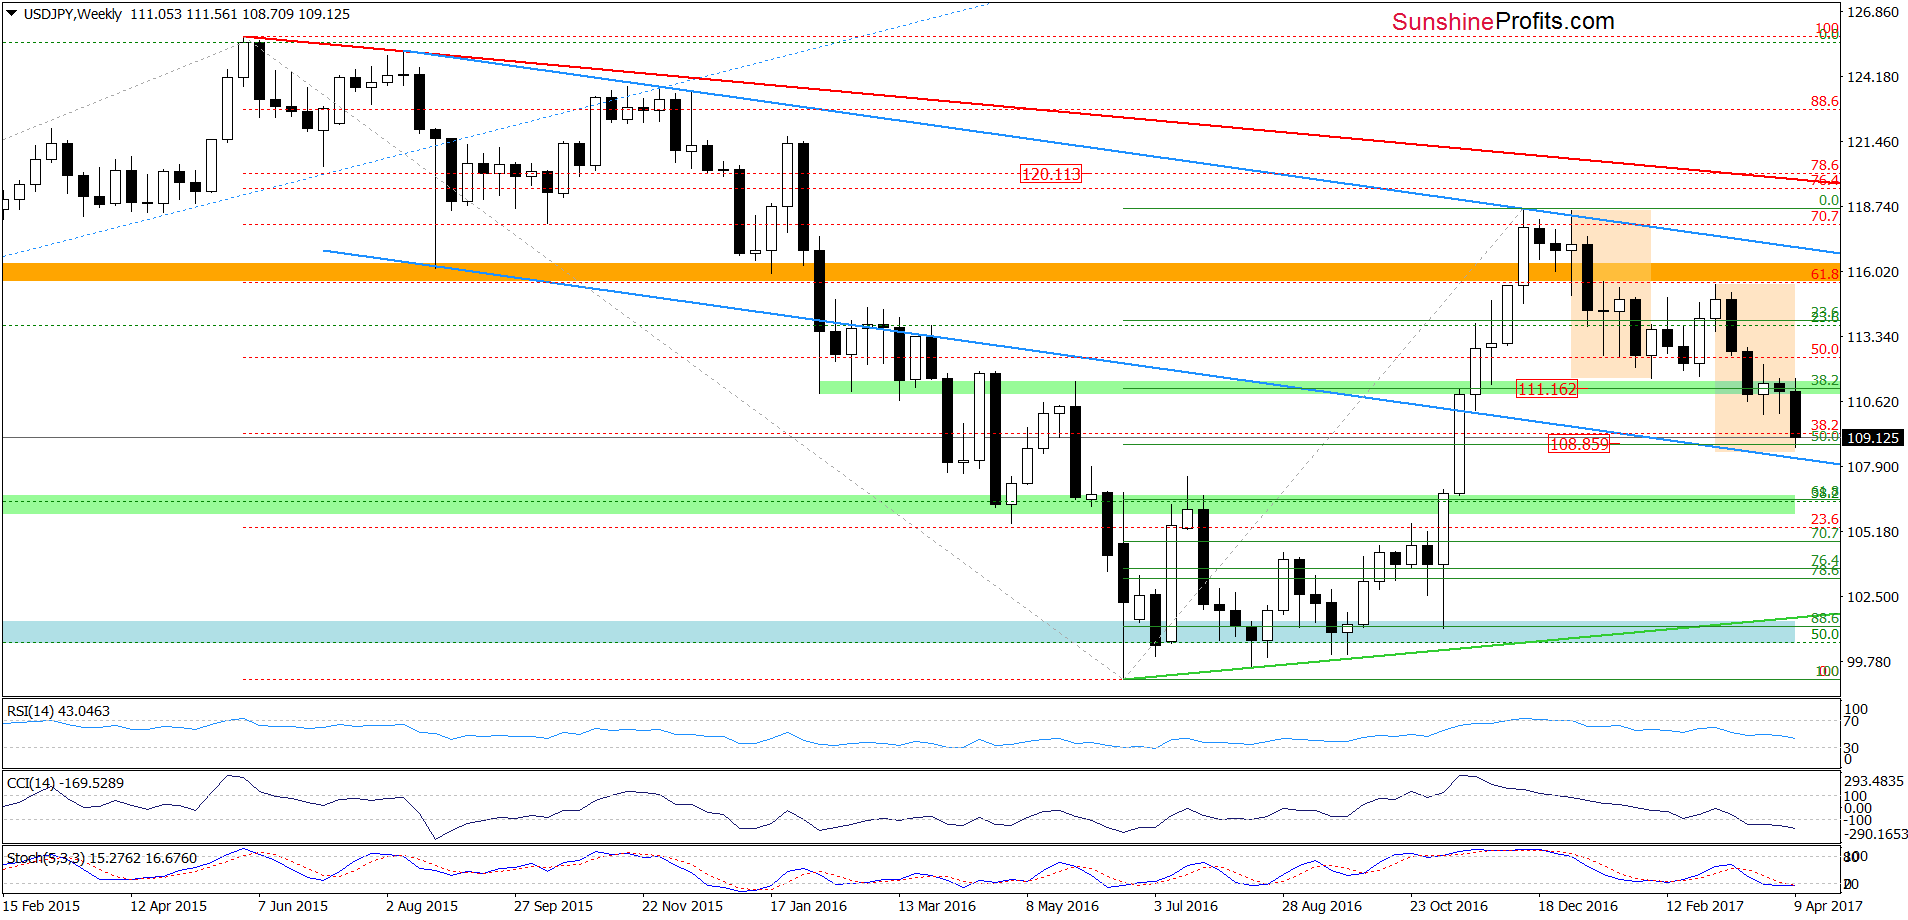
(…) What’s next? (…) taking into account the sell signal generated by the Stochastic Oscillator it seems to us that the pair will re-test the recent lows in the coming days. (…) But what could happen if this support area is broken?
(…) if USD/JPY breaks below the recent lows, we may see a decline even to around 108.86, where the 50% Fibonacci retracement based on the entire June-November upward move is. At this point, it is also worth noting that in this area the size of the current decline will correspond to the downward move, which we saw between January and early February.
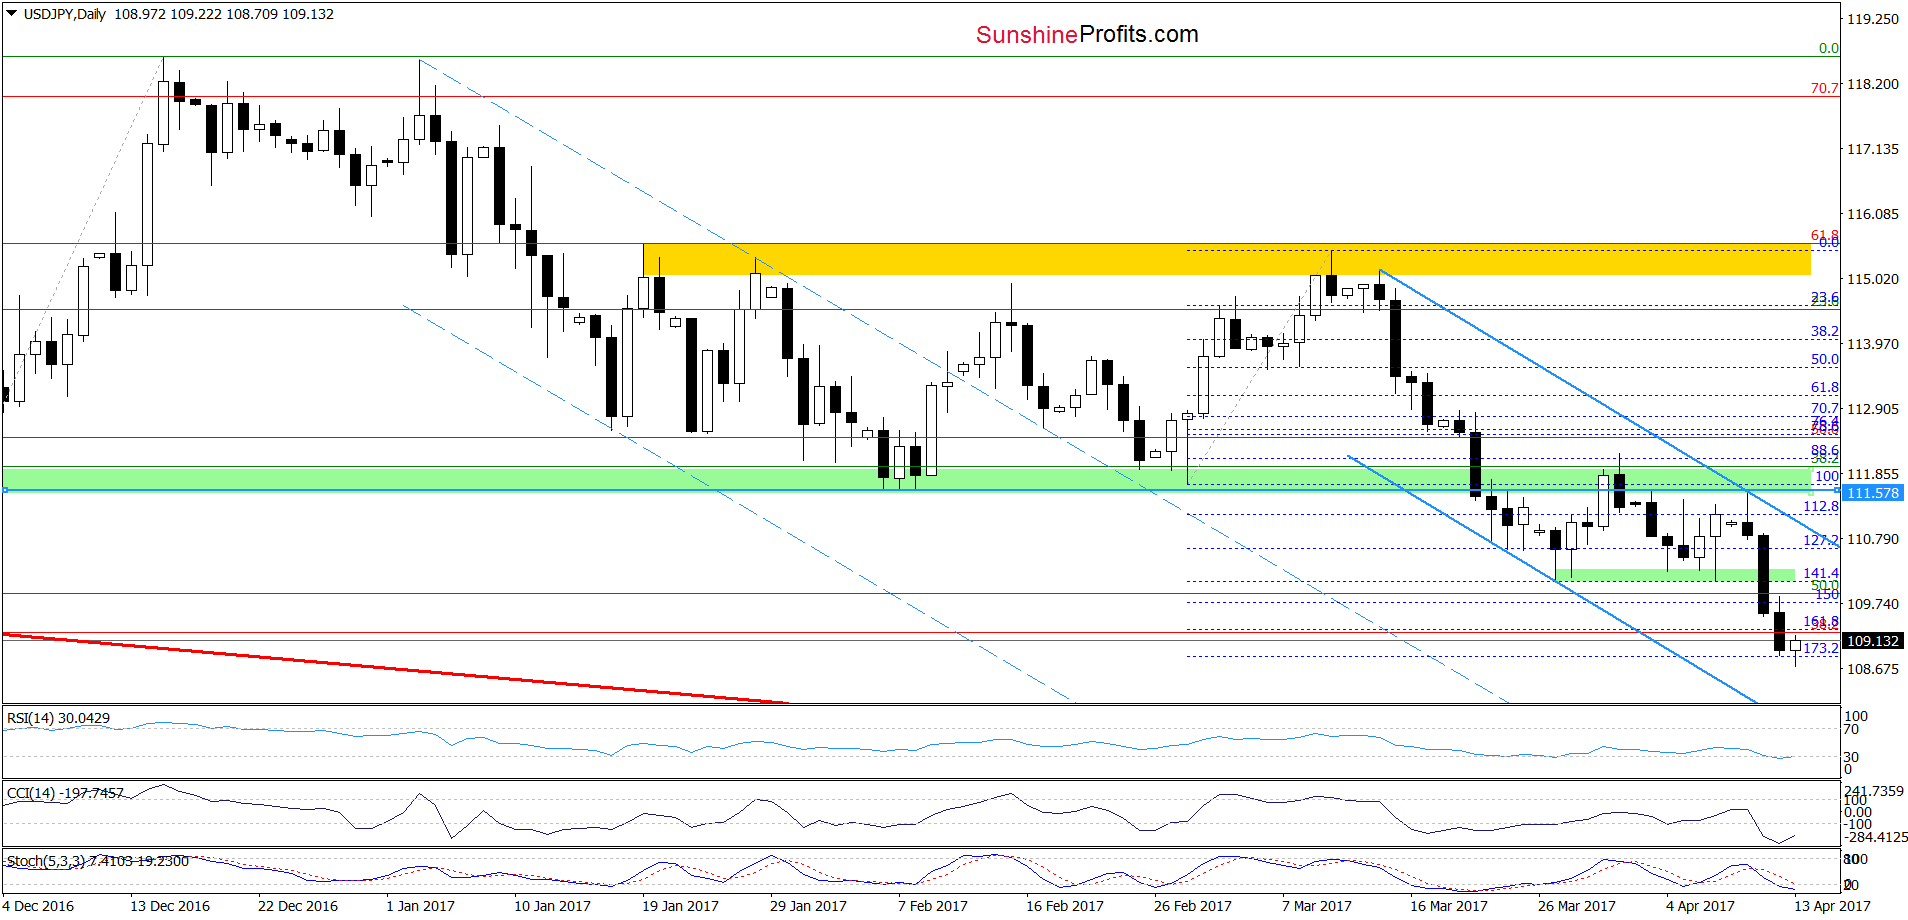
From today’s point of view, we see that the situation developed in tune with the above scenario and USD/JPY declined to our downside target earlier today. This support level triggered a small rebound in the following hours, however, in our opinion as long as the exchange rate remains in the blue declining trend channel and there are no buy signals another downswing can’t be ruled out. Nevertheless, even if we see such price action, the space for declines seems limited – especially when we take into account the fact that the weekly and daily indicators are oversold and very close to generating buy signals.
Very short-term outlook: mixed
Short-term outlook: mixed
MT outlook: mixed
LT outlook: mixed
Trading position (short-term; our opinion): No positions are justified from the risk/reward perspective. We will keep you informed should anything change, or should we see a confirmation/invalidation of the above.
USD/CAD
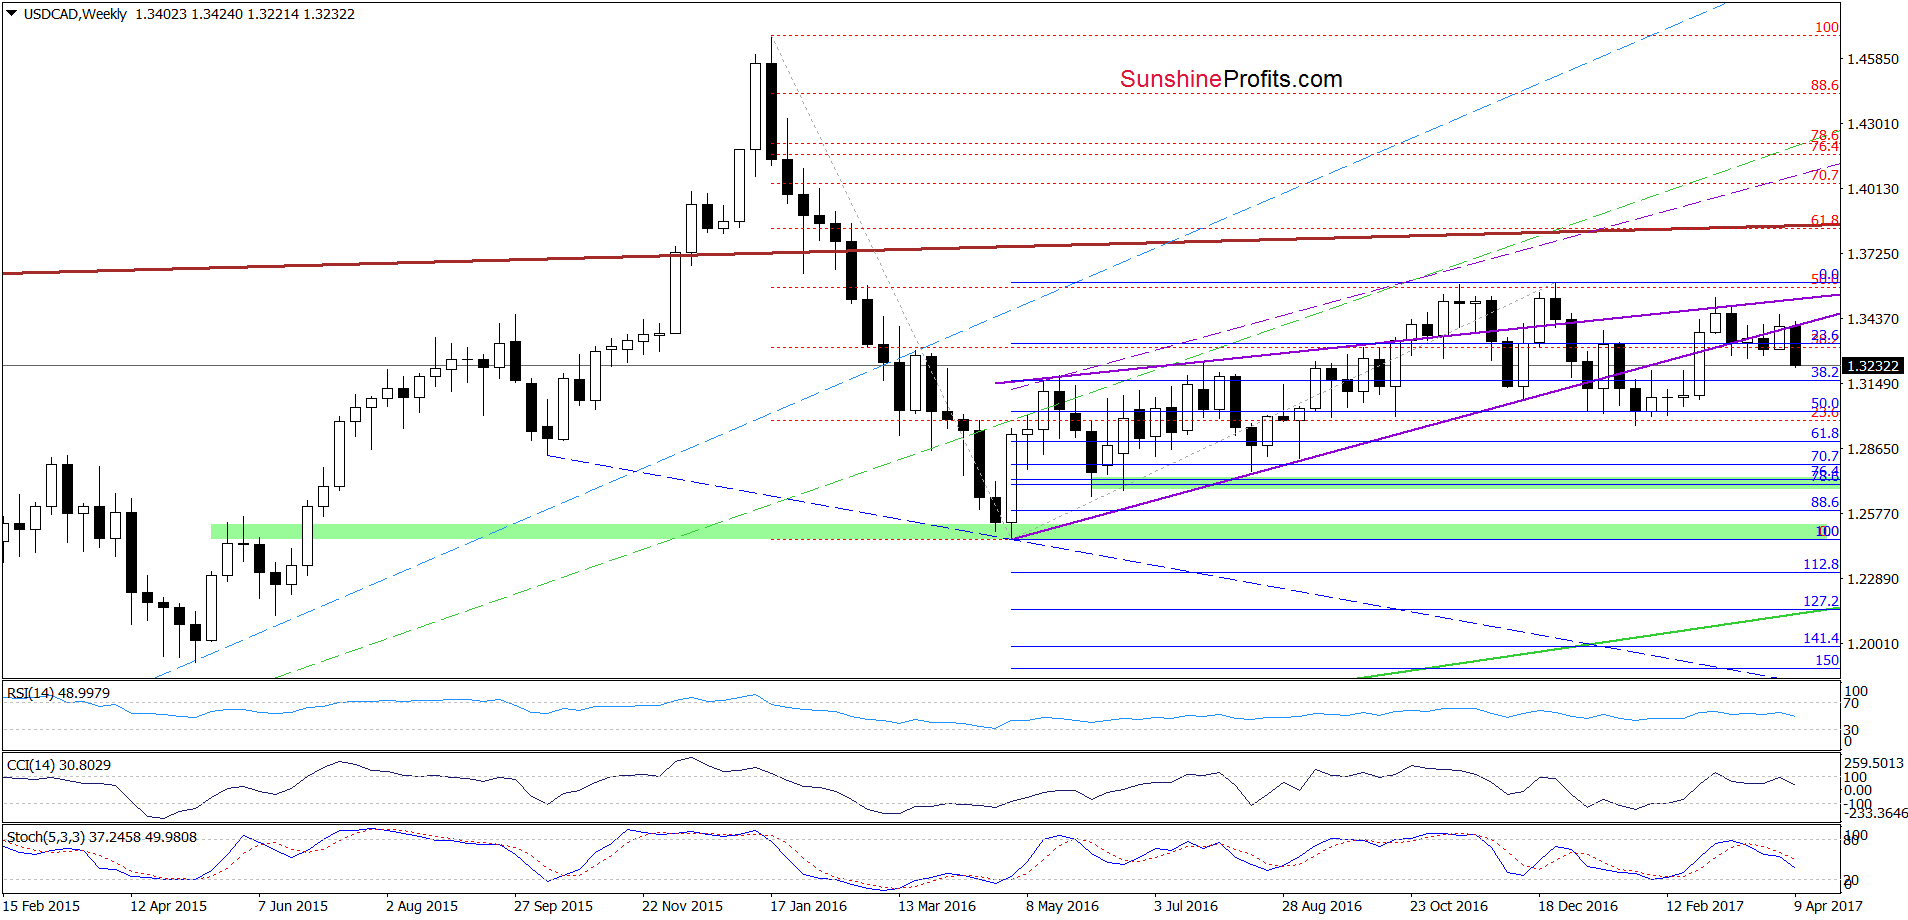
On Tuesday, we wrote:
(…) USD/CAD moved lower and slipped under the previously-broken lower border of the purple rising wedge, which is a negative development. Additionally, the sell signals generated by the CCI and the Stochastic Oscillator remain in place, suggesting another downswing
On the weekly chart, we see that currency bears pushed USD/CAD lower as we had expected. As a result, the exchange rate extended losses below the previously-broken lower border of the purple rising wedge. What impact did this downswing have on the daily chart? Let’s check.
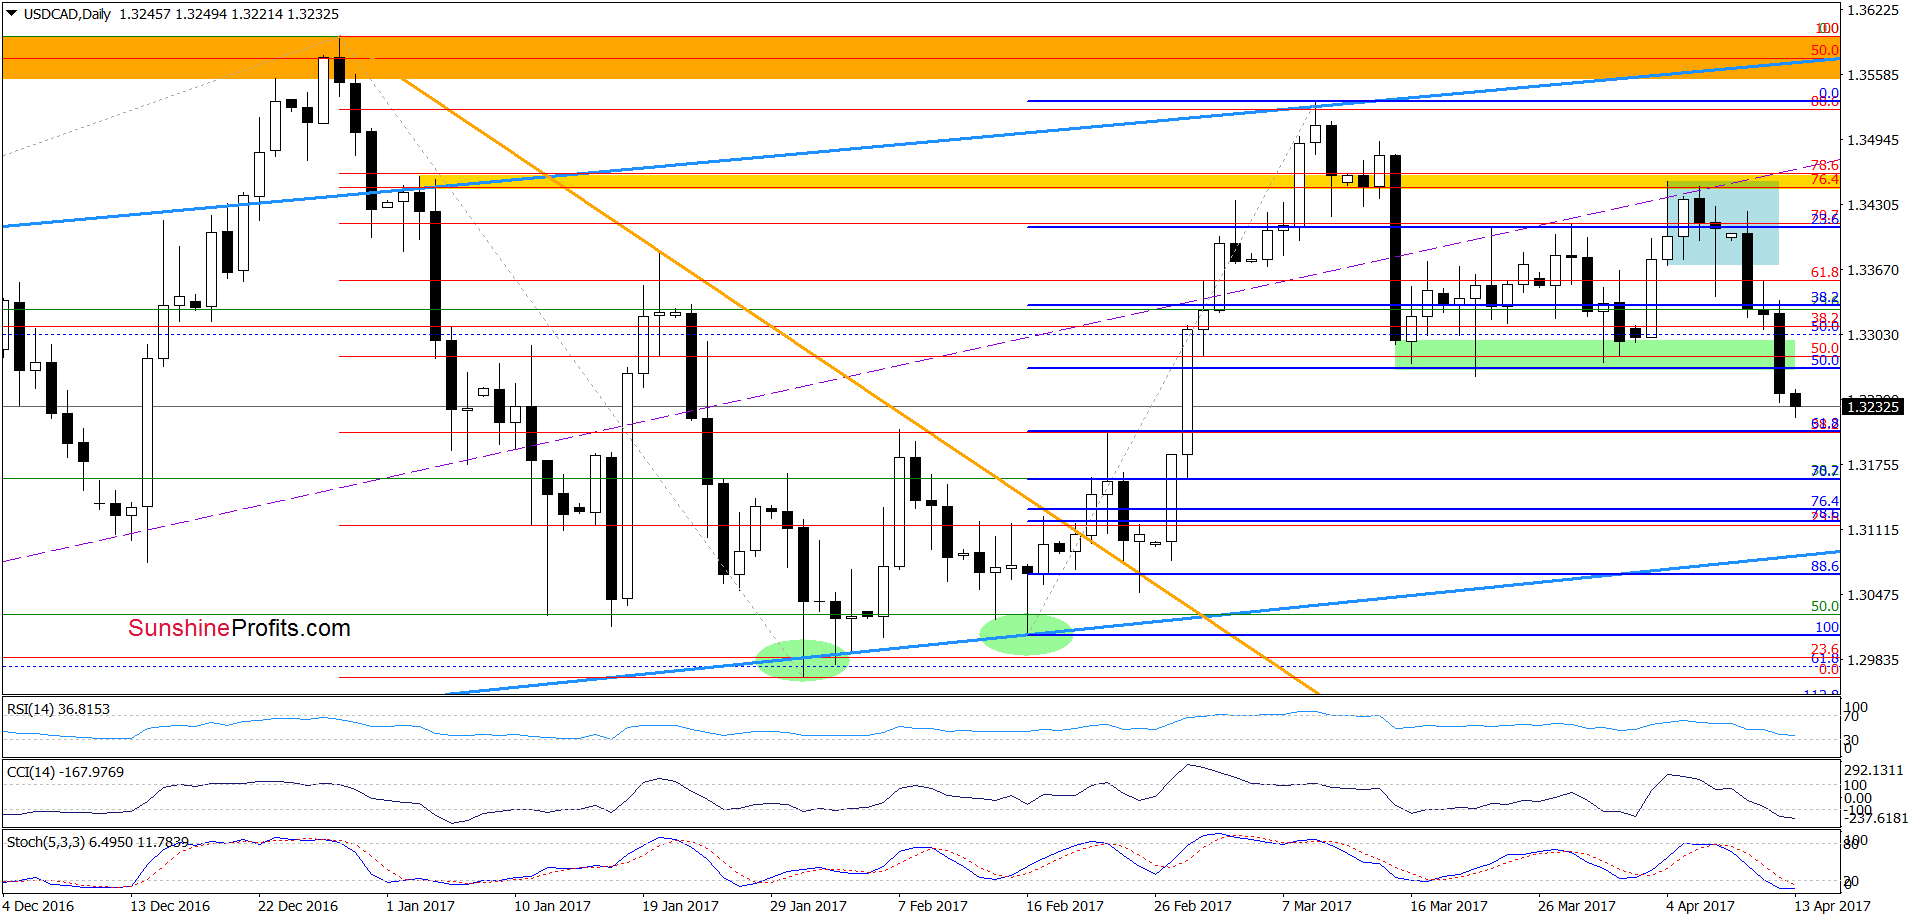
Quoting our Tuesday’s alert:
(…) USD/CAD broke below the lower line of the blue consolidation, which together with the sell signals generated by the CCI and the Stochastic Oscillator suggests further deterioration in the coming days. How low could the exchange rate go? In our opinion, the initial downside target will be the 50% Fibonacci retracement (based on the February – March upward move) and the recent lows. If currency bears manage to break below this support, we may see a decline even to the 61.8% retracement and the February 7 and February 22 highs in the following days.
From today’s point of view, we see that the situation developed in line with our assumptions and USD/CAD broke below the recent lows, which suggests that we’ll see a test of the next target in the coming day(s).
Very short-term outlook: bearish
Short-term outlook: mixed with bullish bias
MT outlook: mixed
LT outlook: mixed
Trading position (short-term; our opinion): No positions are justified from the risk/reward perspective. We will keep you informed should anything change, or should we see a confirmation/invalidation of the above.
Thank you.
Nadia Simmons
Forex & Oil Trading Strategist
Przemyslaw Radomski, CFA
Founder, Editor-in-chief, Gold & Silver Fund Manager
Gold & Silver Trading Alerts
Forex Trading Alerts
Oil Investment Updates
Oil Trading Alerts

