

Although currency bulls climbed to the first resistance zone, they didn’t manage to push USD/JPY above it once again. How did this failure affect the technical picture of the exchange rate?
In our opinion the following forex trading positions are justified - summary:
- EUR/USD: short (a stop-loss order at 1.0967; the initial downside target at 1.0521)
- GBP/USD: short (a stop-loss order at 1.2738; the downside target at 1.2157)
- USD/JPY: none
- USD/CAD: none
- USD/CHF: none
- AUD/USD: none
EUR/USD
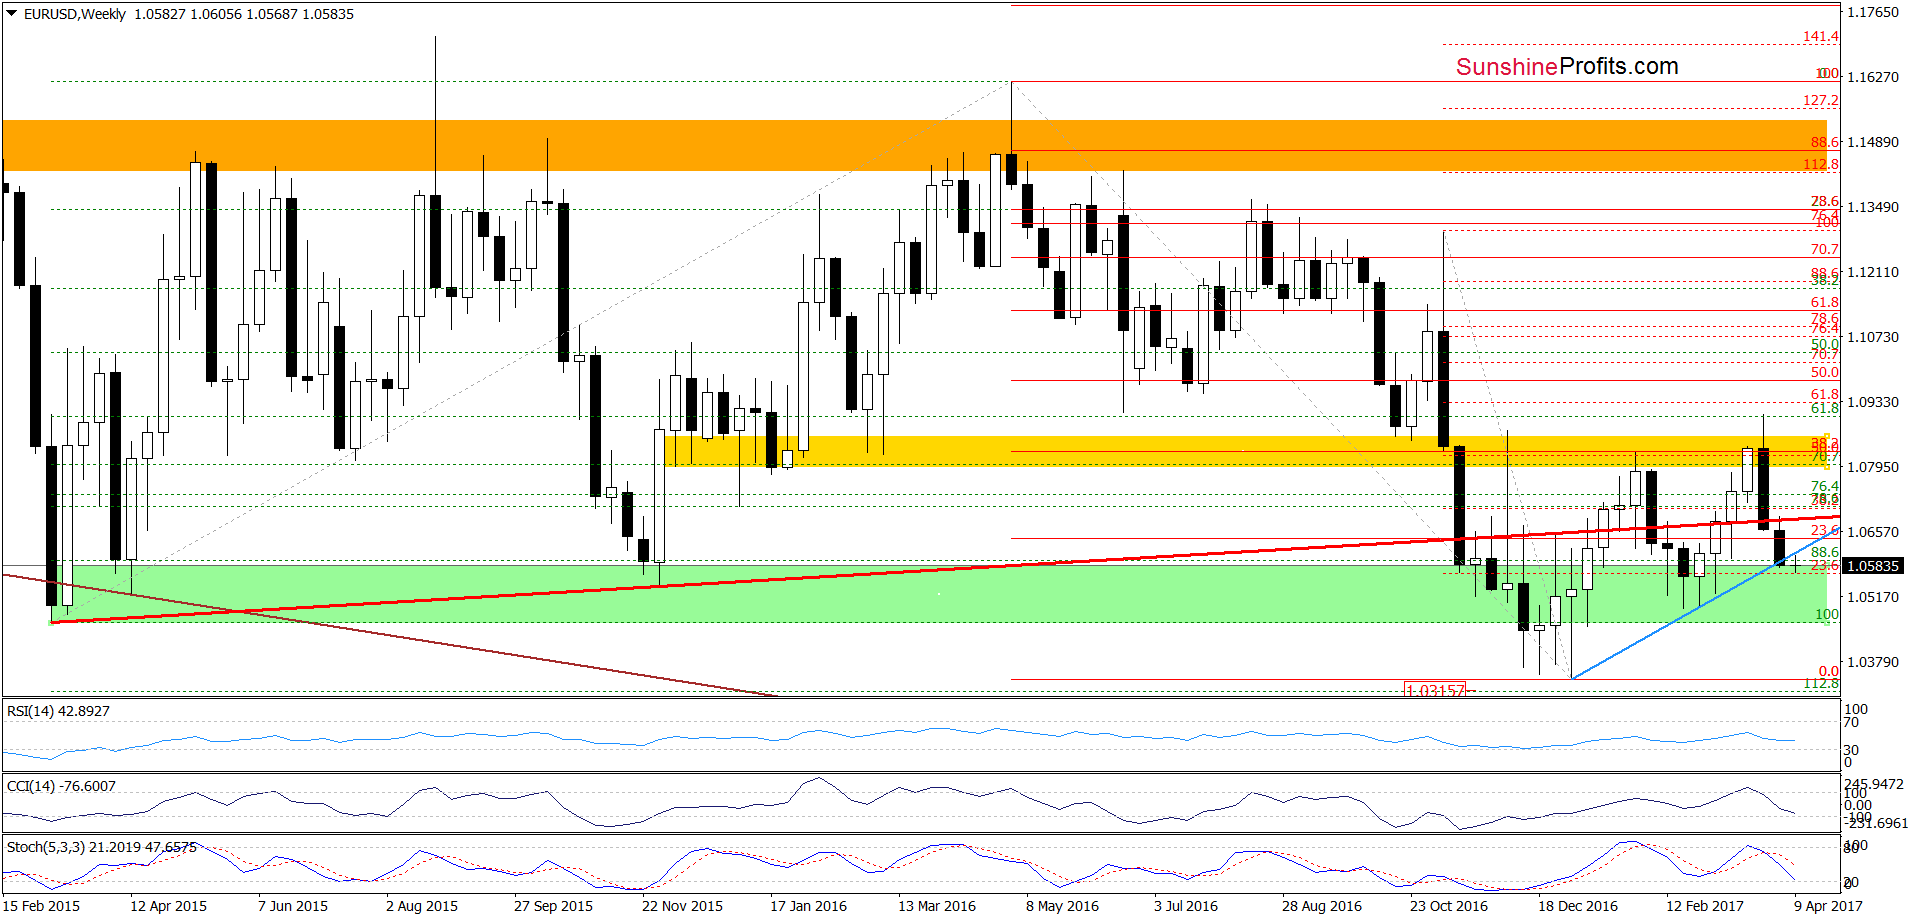
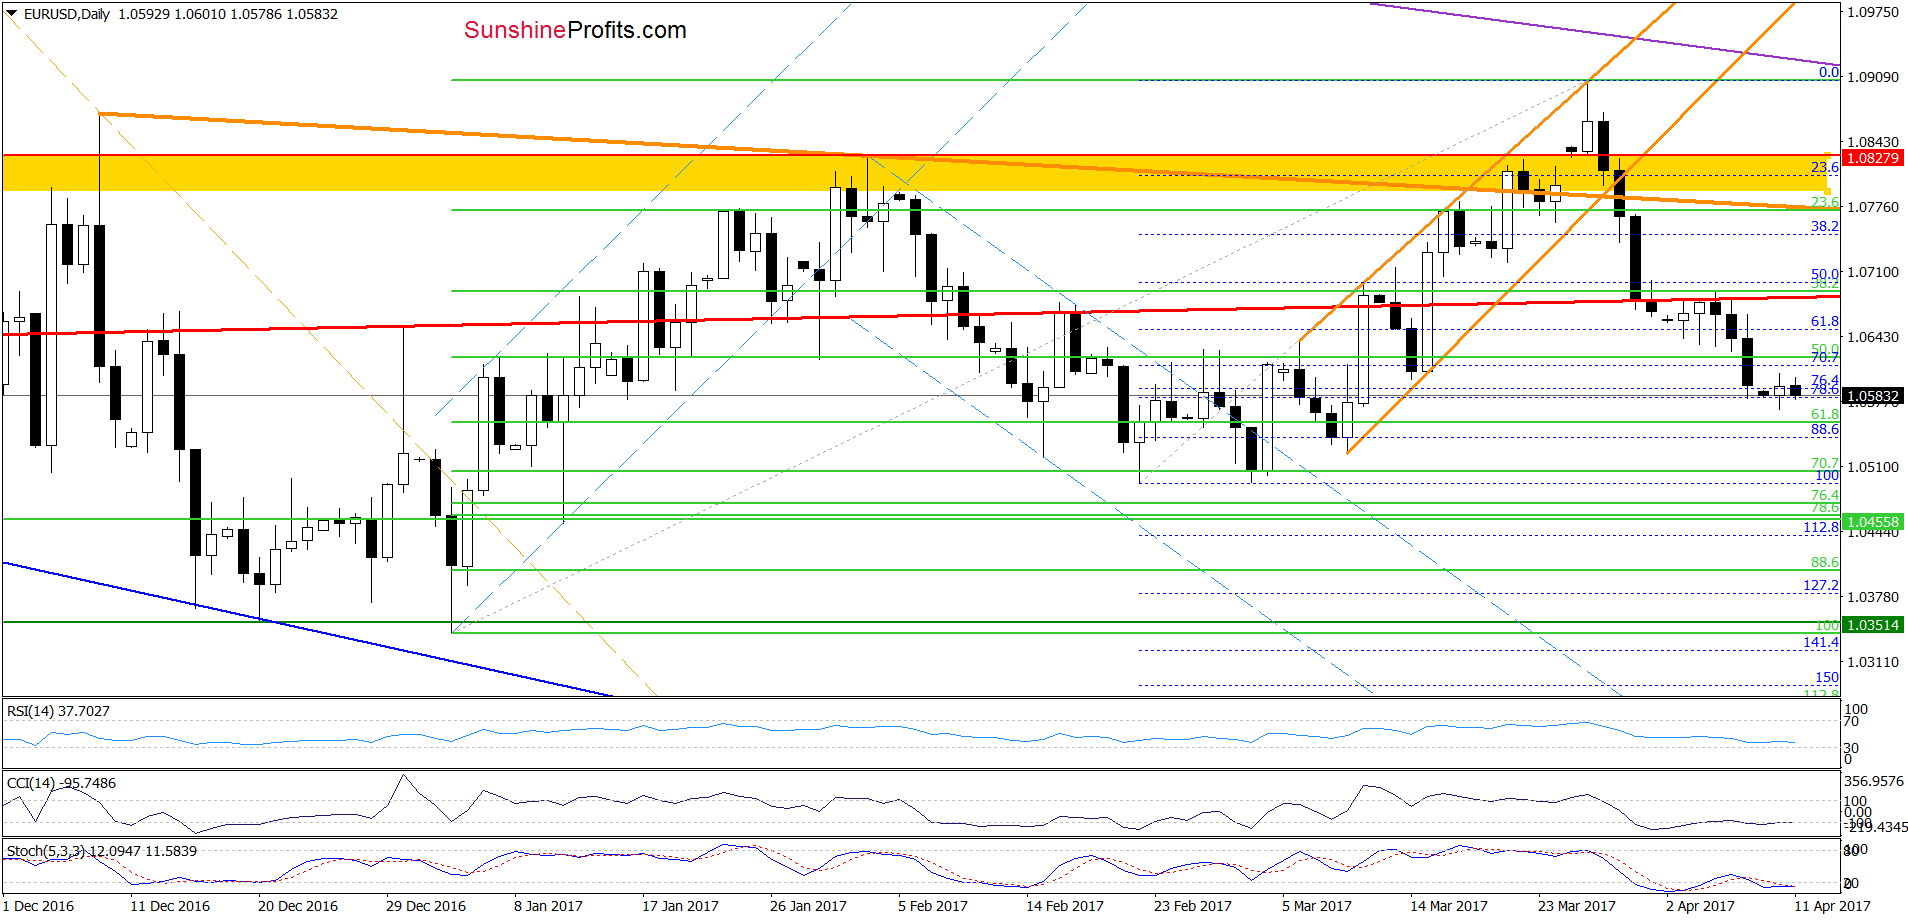
From today’s point of view, we see that although EUR/USD moved a bit higher yesterday, currency bears didn’t give up and pushed the exchange rate lower earlier today, which suggests that further deterioration is still likely. Therefore, we believe that what we wrote a week ago remains up-to-date also today:
(…) we think that lower values of EUR/USD are more likely than not. Therefore, if the pair extends losses, (…) the initial downside target for currency bears will be around 1.0521 (slightly above the late February and March lows).
Very short-term outlook: bearish
Short-term outlook: mixed with bearish bias
MT outlook: mixed
LT outlook: mixed
Trading position (short-term; our opinion): Short positions (with a stop-loss order at 1.0967 and the initial downside target at 1.0521) are justified from the risk/reward perspective. We will keep you informed should anything change, or should we see a confirmation/invalidation of the above.
USD/JPY
On Friday, we wrote the following:
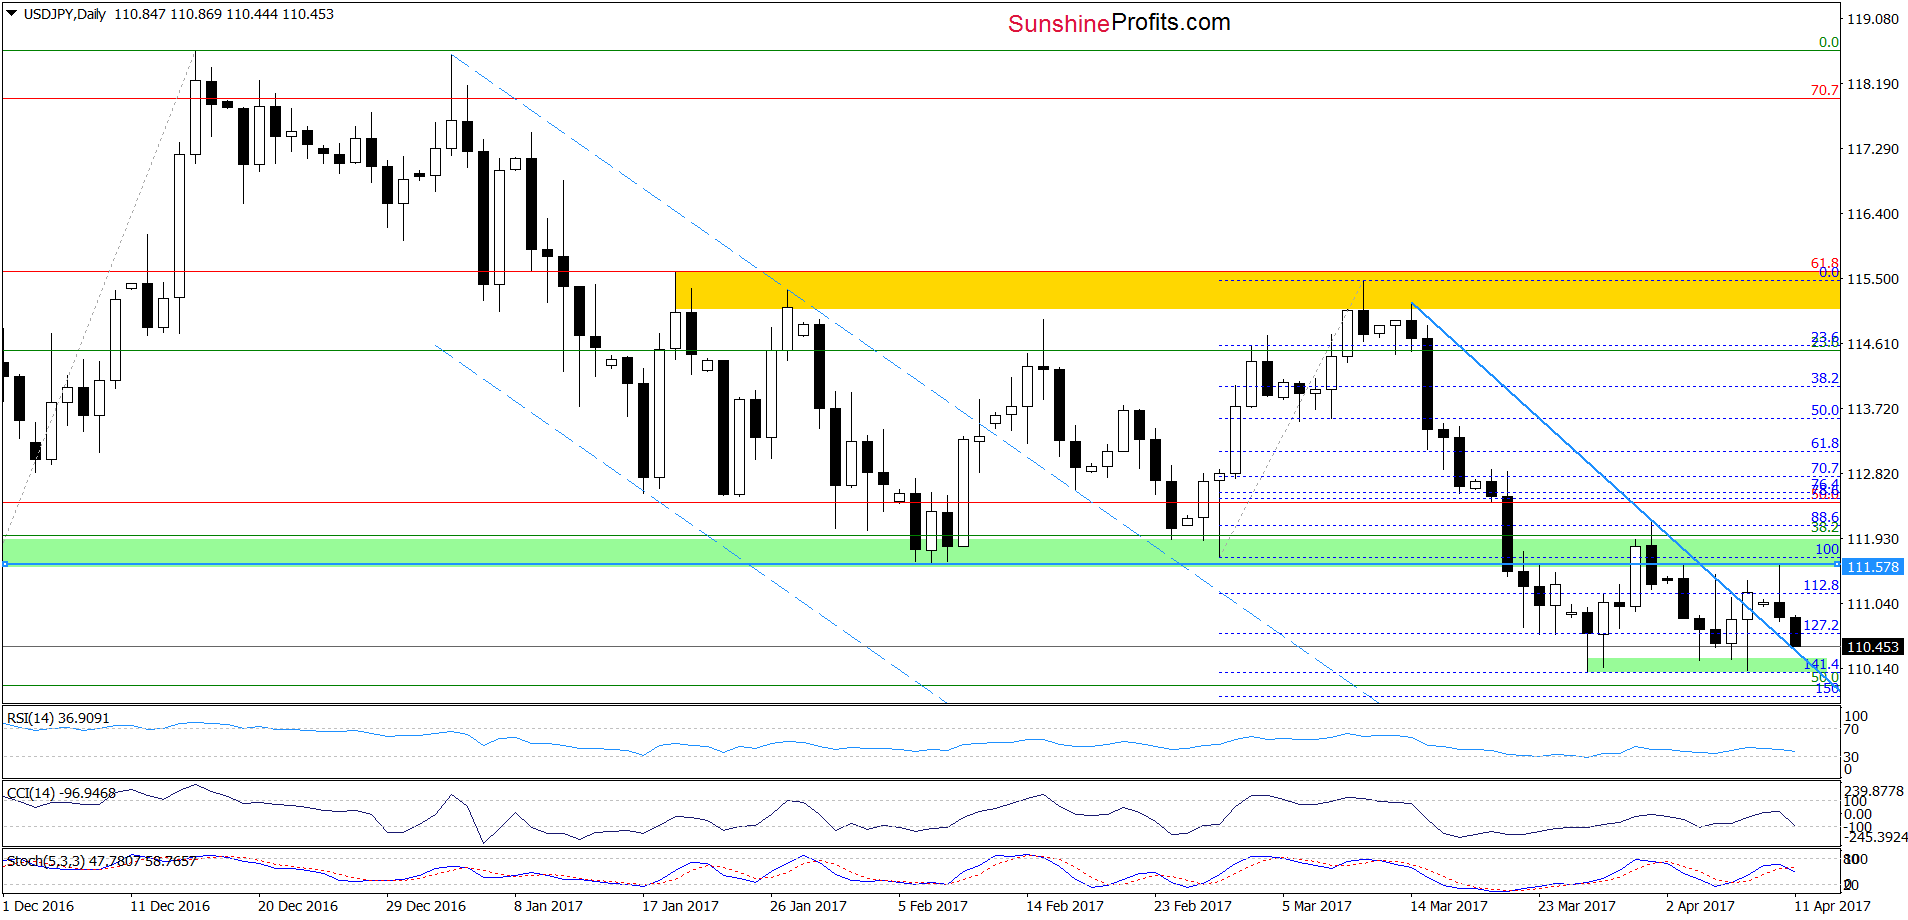
(…) USD/JPY re-tested the late-March low. (…) this support level encouraged currency bulls to act, which resulted in a pullback. Additionally, the Stochastic Oscillator generated the buy signal, which suggests that currency bulls will likely try to push the exchange rate to the green zone once again in the coming week.
Looking at the daily chart, we see that the situation developed in tune with our Friday’s assumptions and USD/JPY re-tested the strength of the green zone, which serves as the nearest important resistance at the moment. Despite this improvement and the breakout above the blue declining resistance line, currency bulls didn’t manage to push the pair higher, which resulted in a reversal and a pullback. This show of bulls’ weakness encouraged their opponents to act, which resulted in further deterioration earlier today. What’s next? USD/JPY reached the previously-broken blue line, which looks like a verification of the breakout at the first sigh. However, taking into account the sell signal generated by the Stochastic Oscillator it seems to us that the pair will re-test the recent lows in the coming days. If they withstand the selling pressure, the exchange rate will rebound to yesterday’s high.
But what could happen if this support area is broken? Let’s take a look at the weekly chart and find out.
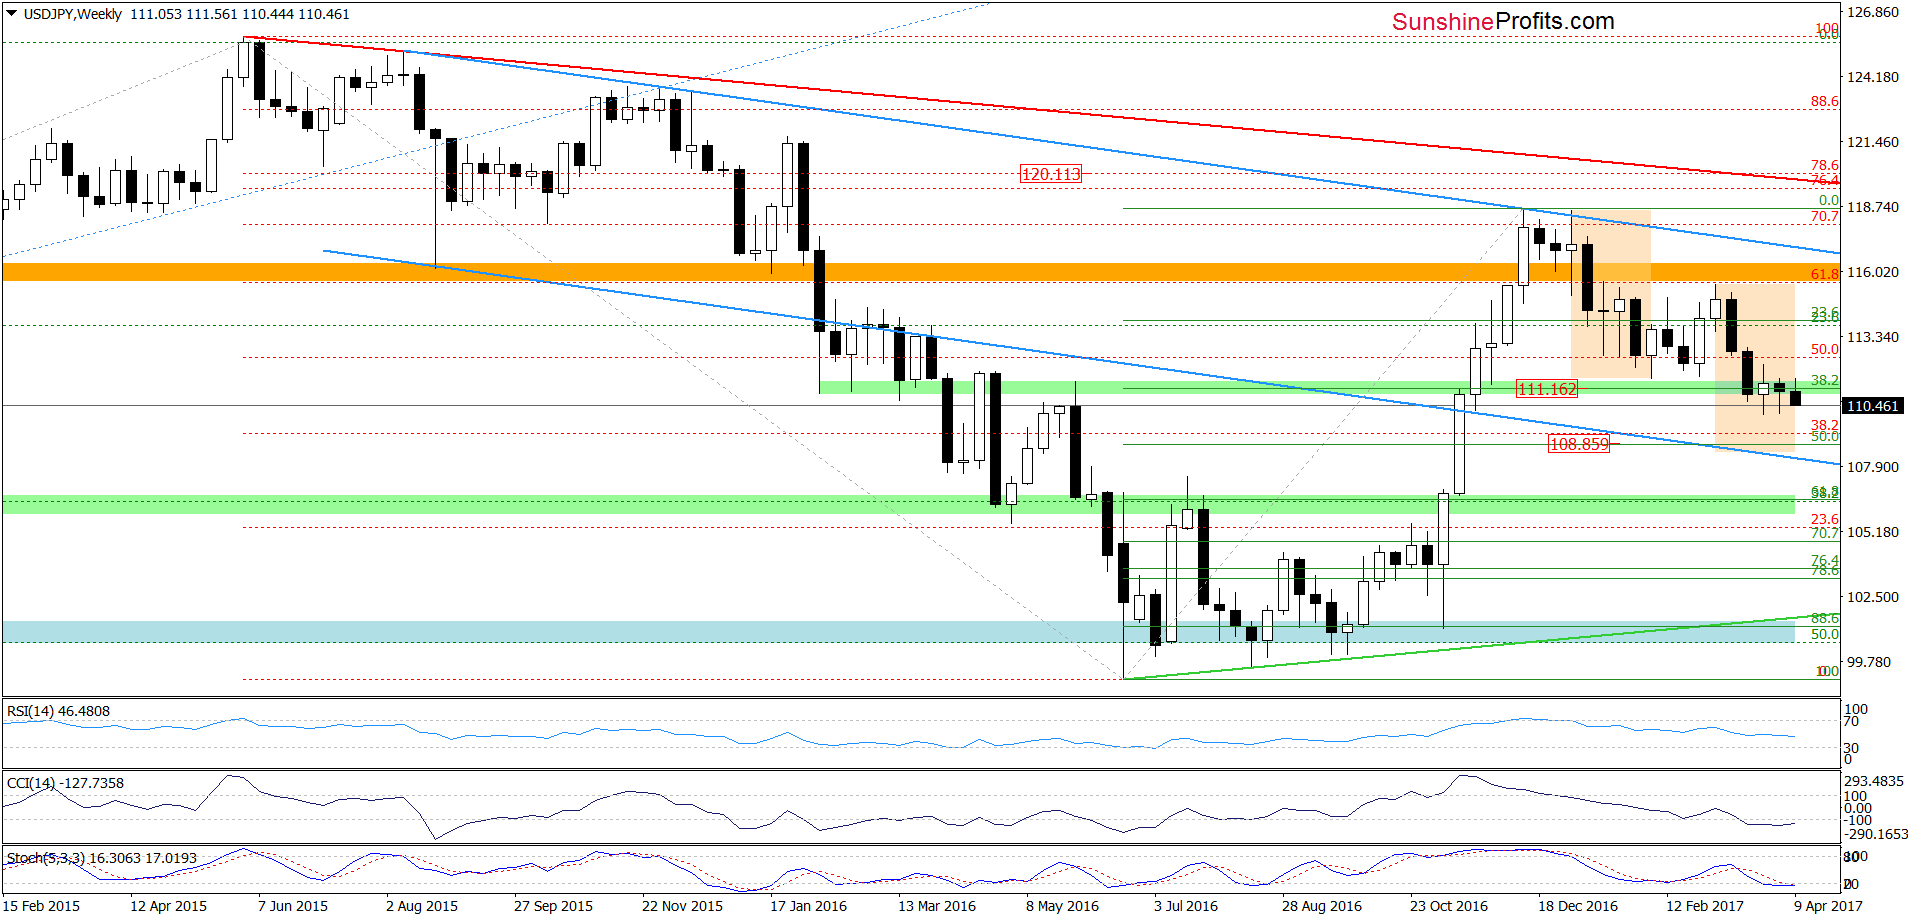
From the medium-term perspective, we see that if USD/JPY breaks below the recent lows, we may see a decline even to around 108.86, where the 50% Fibonacci retracement based on the entire June-November upward move is. At this point, it is also worth noting that in this area the size of the current decline will correspond to the downward move, which we saw between January and early February.
Very short-term outlook: mixed with bearish bias
Short-term outlook: mixed
MT outlook: mixed
LT outlook: mixed
Trading position (short-term; our opinion): No positions are justified from the risk/reward perspective. We will keep you informed should anything change, or should we see a confirmation/invalidation of the above.
USD/CAD
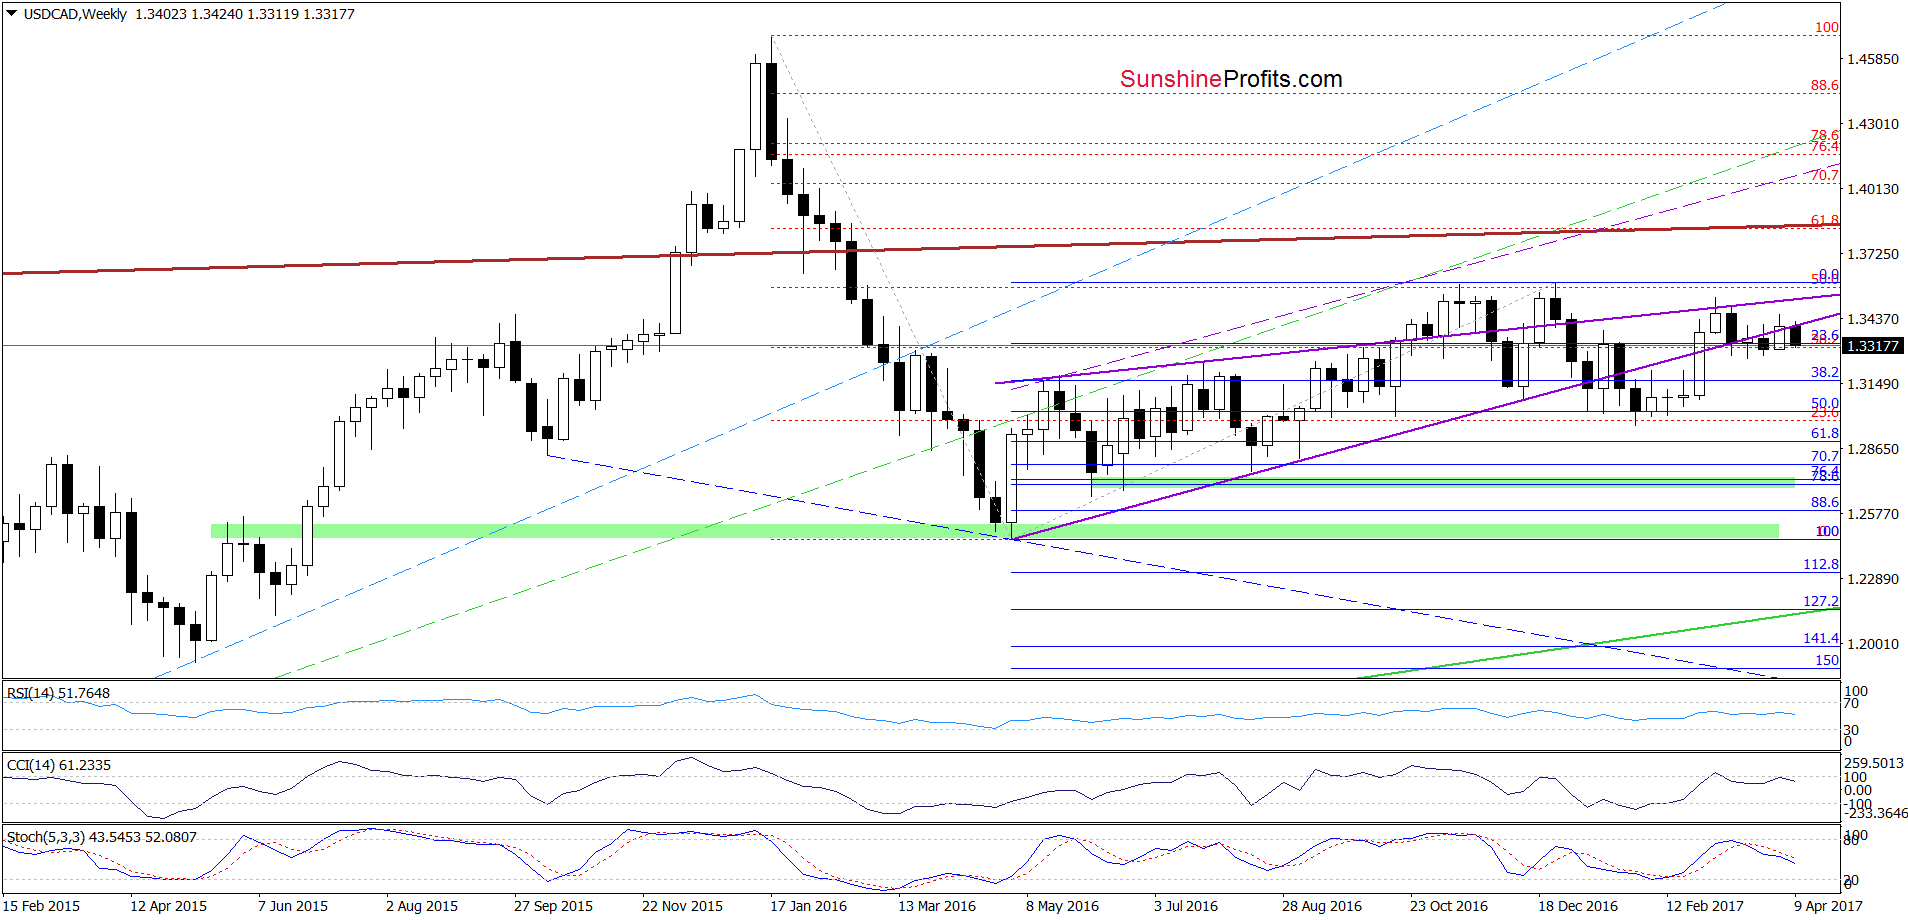
Looking at the weekly chart, we see that USD/CAD moved lower and slipped under the previously-broken lower border of the purple rising wedge, which is a negative development. Additionally, the sell signals generated by the CCI and the Stochastic Oscillator remain in place, suggesting another downswing.
Will the very short-term picture confirm this scenario? Let’s check.
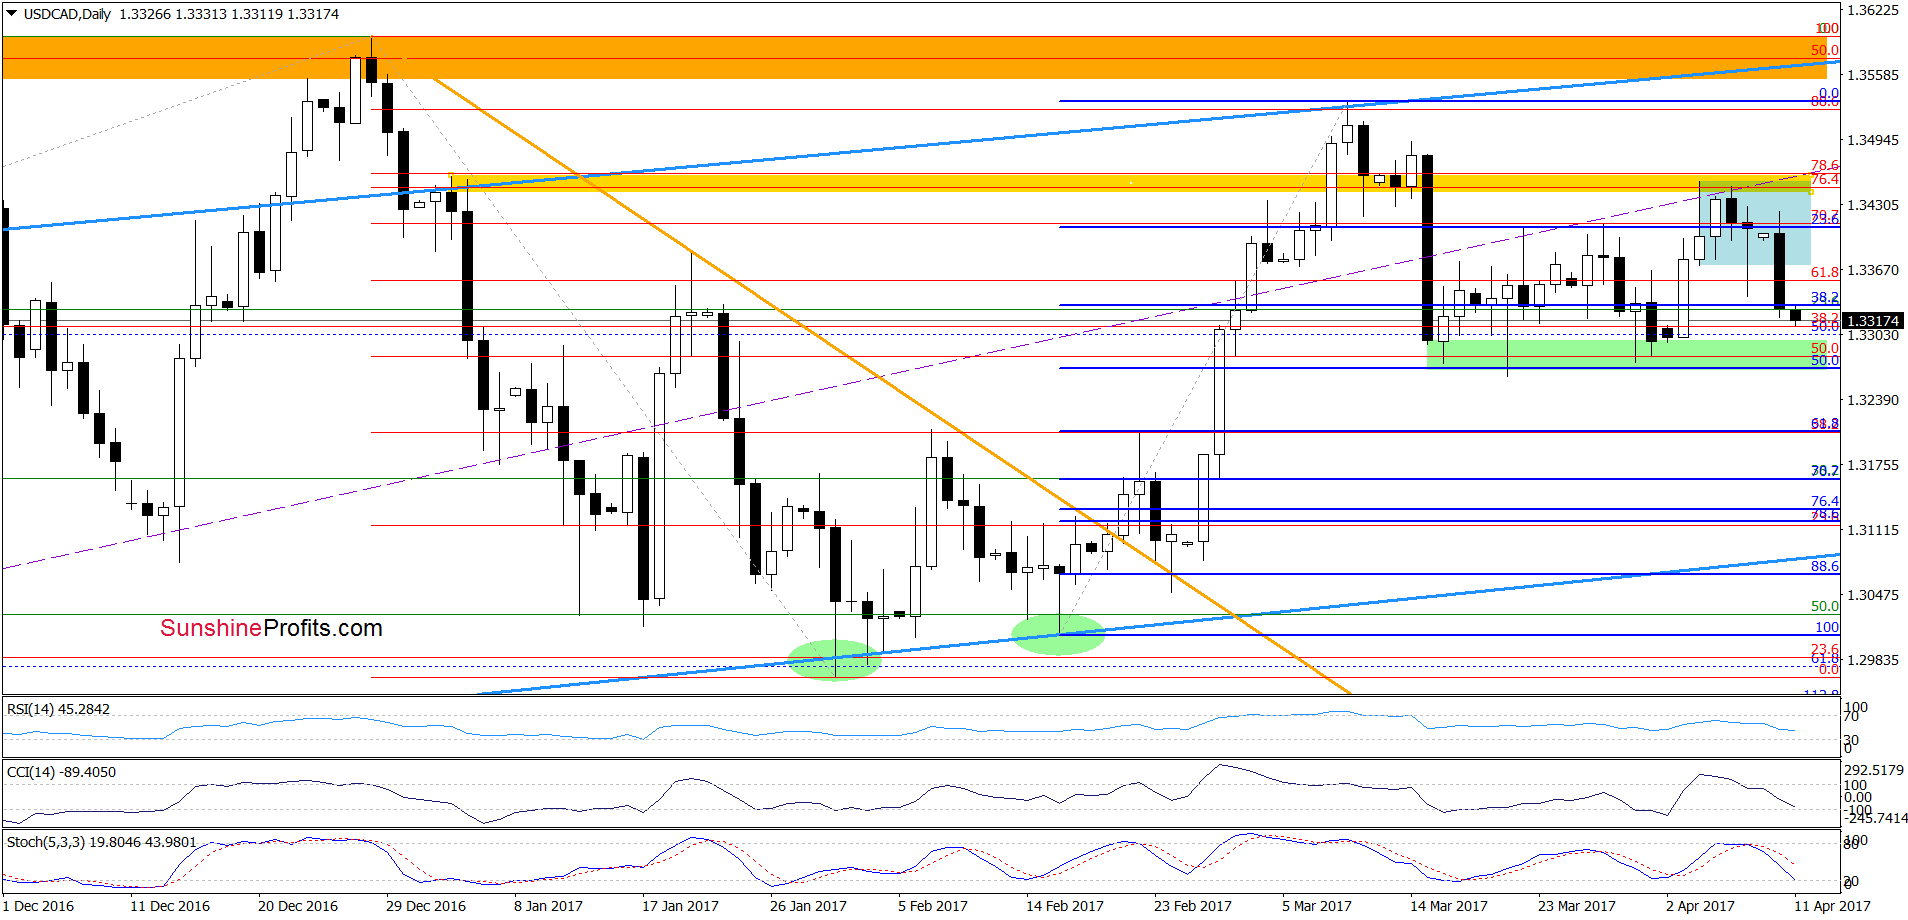
On the daily chart, we see that USD/CAD broke below the lower line of the blue consolidation, which together with the sell signals generated by the CCI and the Stochastic Oscillator suggests further deterioration in the coming days. How low could the exchange rate go? In our opinion, the initial downside target will be the 50% Fibonacci retracement (based on the February – March upward move) and the recent lows. If currency bears manage to break below this support, we may see a decline even to the 61.8% retracement and the February 7 and February 22 highs in the following days.
Very short-term outlook: bearish
Short-term outlook: mixed
MT outlook: mixed
LT outlook: mixed
Trading position (short-term; our opinion): No positions are justified from the risk/reward perspective. We will keep you informed should anything change, or should we see a confirmation/invalidation of the above.
Thank you.
Nadia Simmons
Forex & Oil Trading Strategist
Przemyslaw Radomski, CFA
Founder, Editor-in-chief, Gold & Silver Fund Manager
Gold & Silver Trading Alerts
Forex Trading Alerts
Oil Investment Updates
Oil Trading Alerts

