

Yesterday, the USD Index moved sharply lower and slipped under the level of 99. How did this drop affect the short-term picture of GBP/USD?
In our opinion the following forex trading positions are justified - summary:
- EUR/USD: none
- GBP/USD: none
- USD/JPY: none
- USD/CAD: none
- USD/CHF: none
- AUD/USD: short (a stop-loss order at 0.7873; the initial downside target at 0.7498)
EUR/USD
Yesterday, we wrote the following:
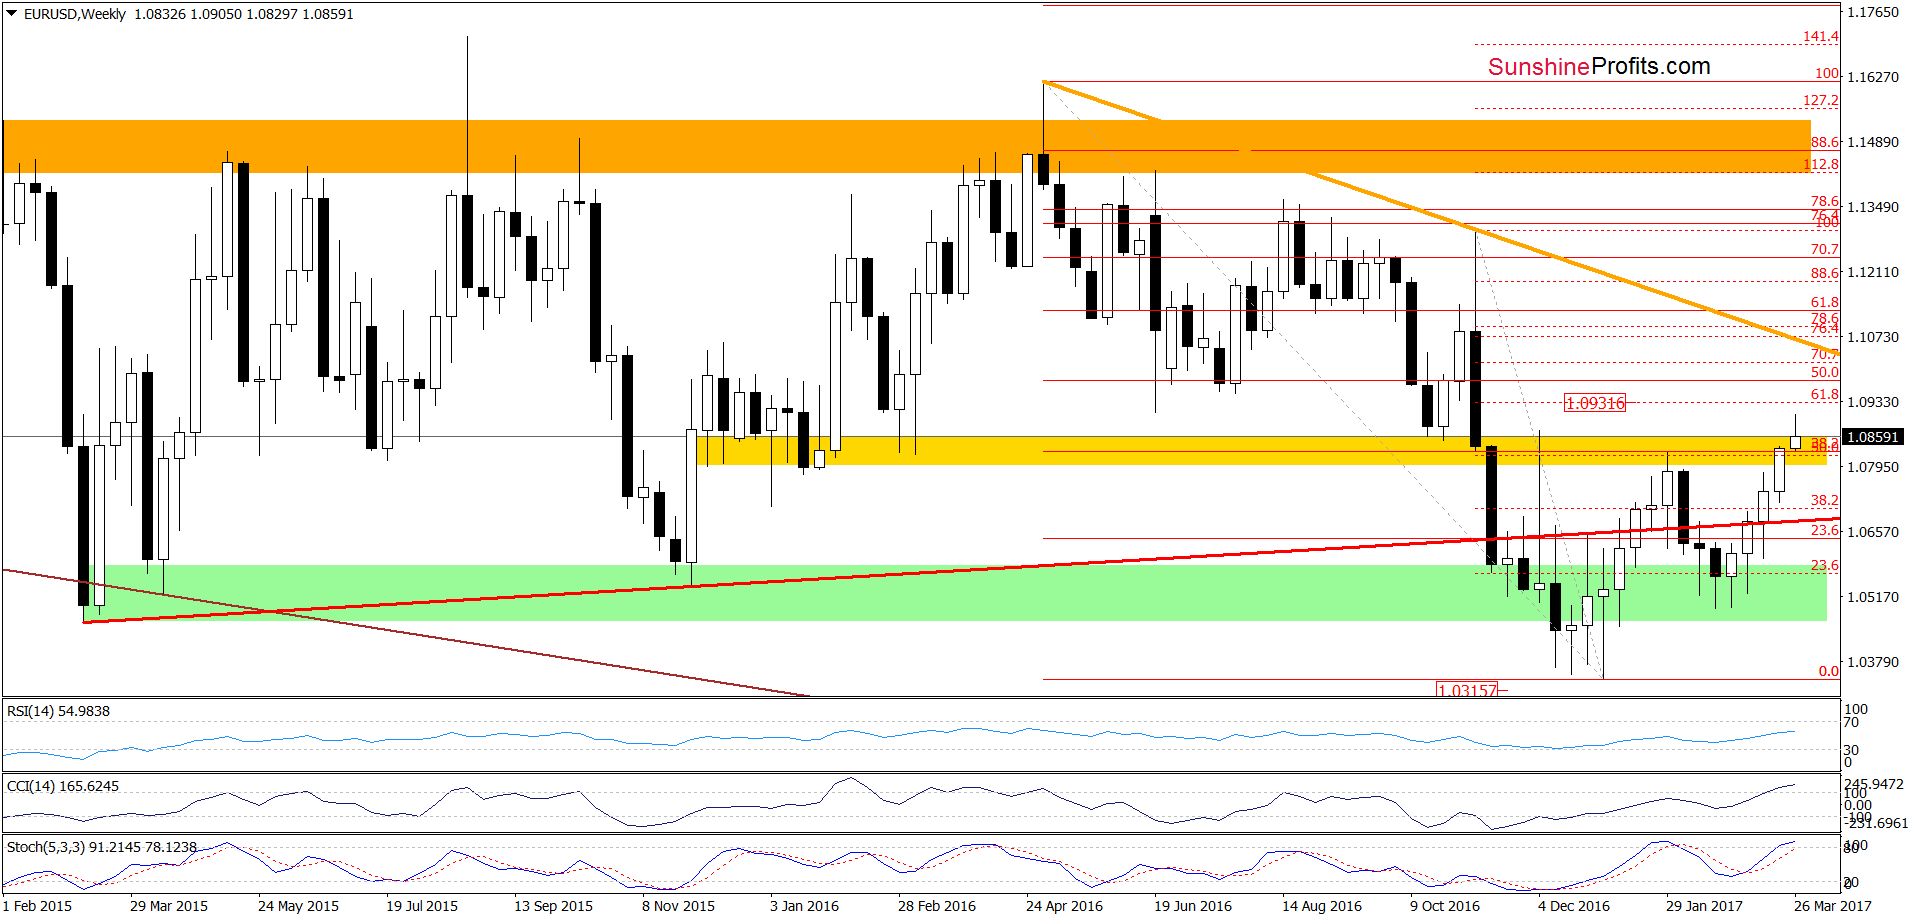
(…) there are no sell signals at the moment (the CCI and the Stochastic Oscillator came back to their overbought areas), which suggests that we may see an increase to the upper border of the orange rising trend channel or the 1.272% Fibonacci extension in the coming days(….)
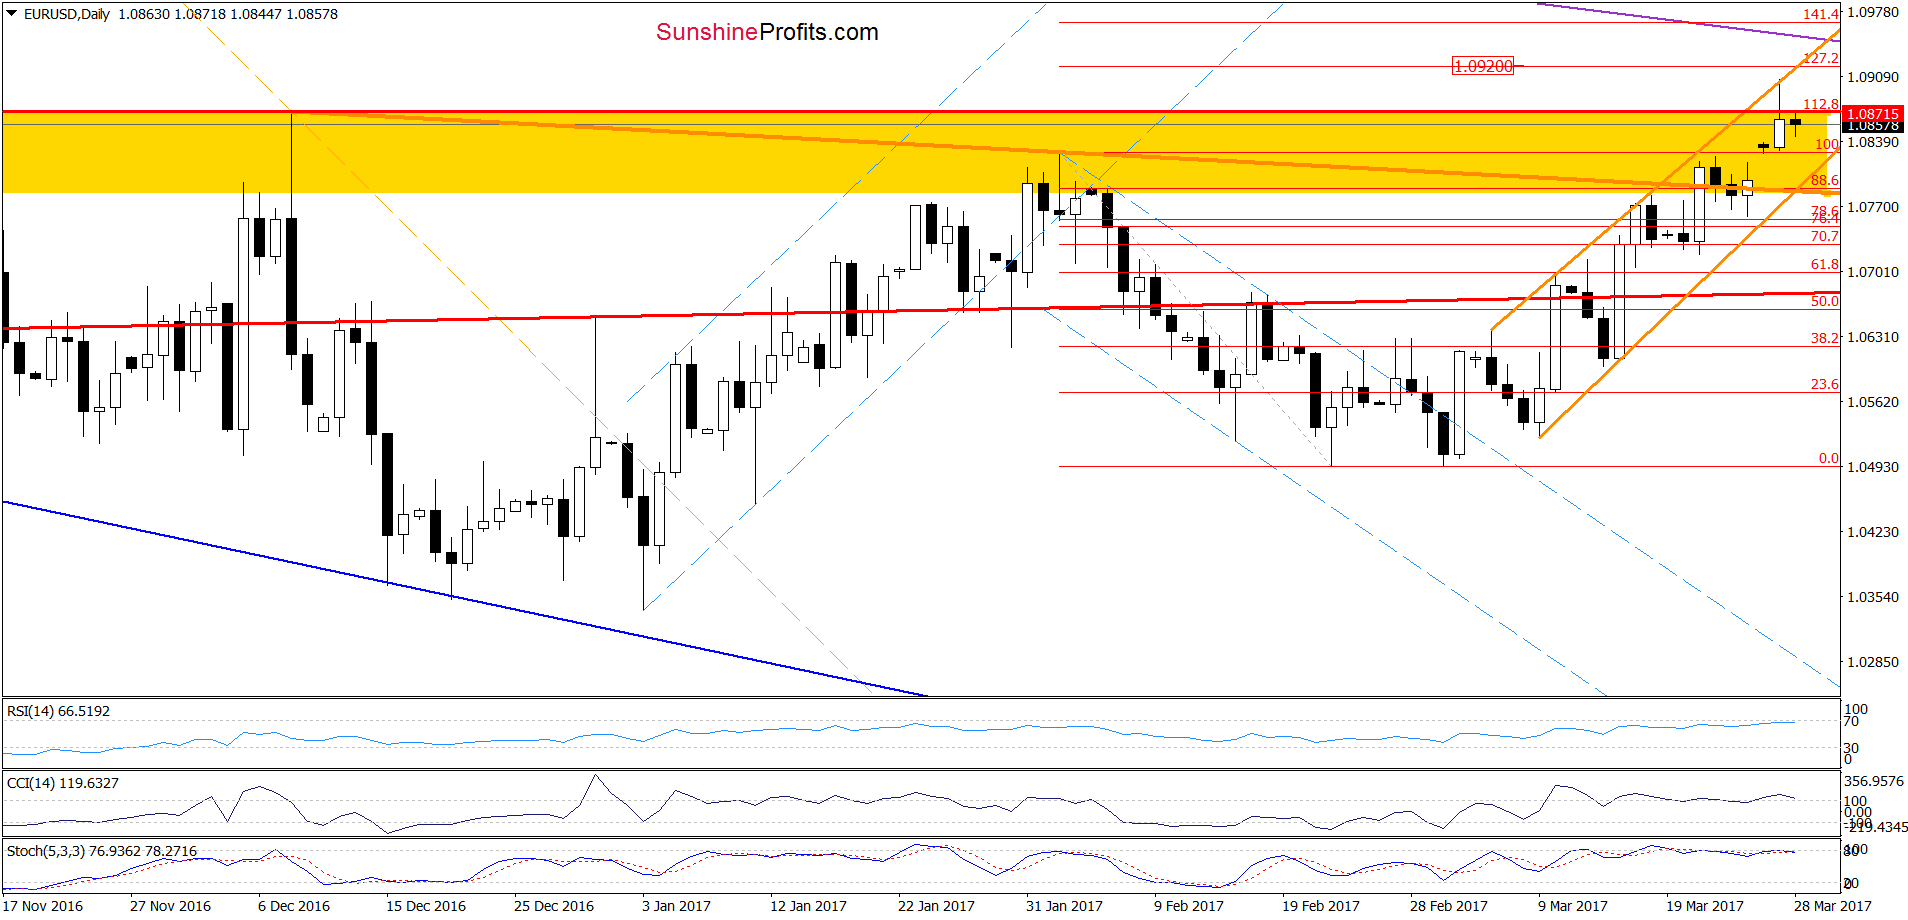
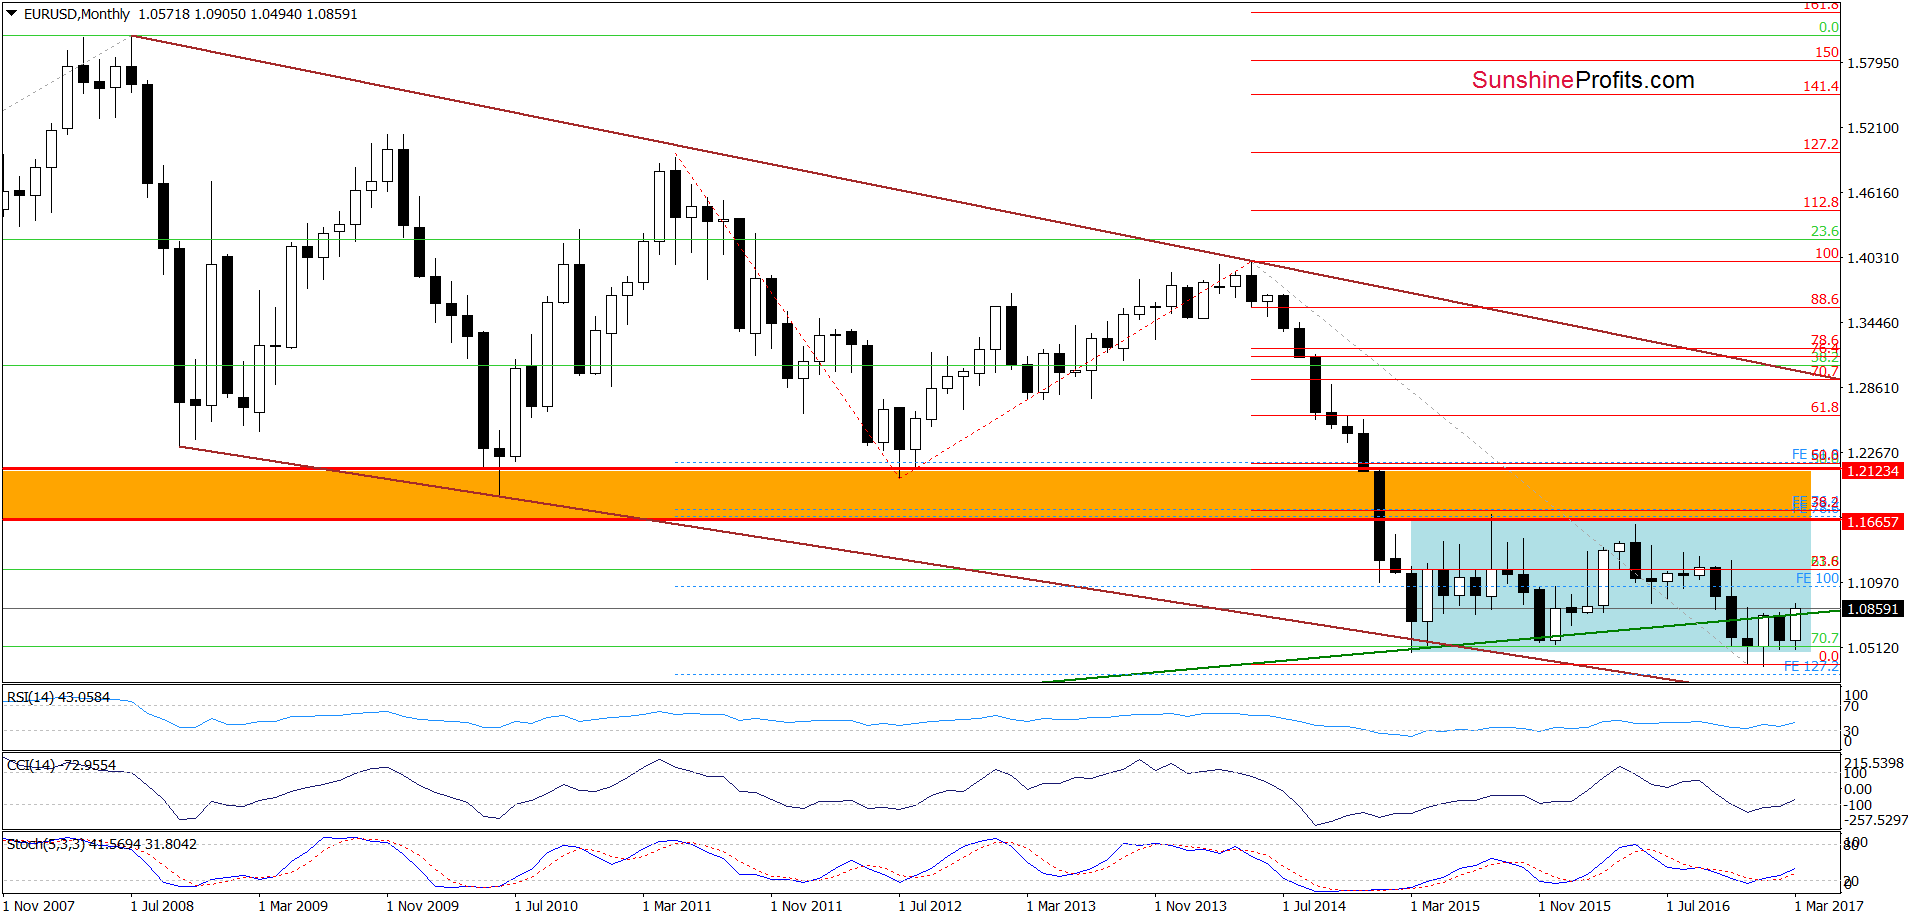
On the daily chart, we see that the situation developed in line with the above scenario and EUR/USD reached to the upper border of the orange rising trend channel yesterday. With this move the pair also broke above the December high, but the above-mentioned resistance line together with the proximity to the 1.272% Fibonacci extension encouraged currency bears to act, which resulted in a pullback. Thanks to this drop the pair invalidated the earlier small breakout, which is a negative signal. Additionally, the current position of the indicators also favors currency bears, suggesting that a bigger move to the downside is just around the corner. Nevertheless, in our opinion, such price action will be more reliable if EUR/USD drops below the lower border of the orange rising trend channel (currently around 1.0783) and the long-term green support line seen on the monthly chart below.
Very short-term outlook: mixed
Short-term outlook: mixed with bearish bias
MT outlook: mixed
LT outlook: mixed
Trading position (short-term; our opinion): No positions are justified from the risk/reward perspective. However, if we see a daily closure under the lower border of the orange rising trend channel, we’ll consider opening short positions. We will keep you informed should anything change, or should we see a confirmation/invalidation of the above.
GBP/USD
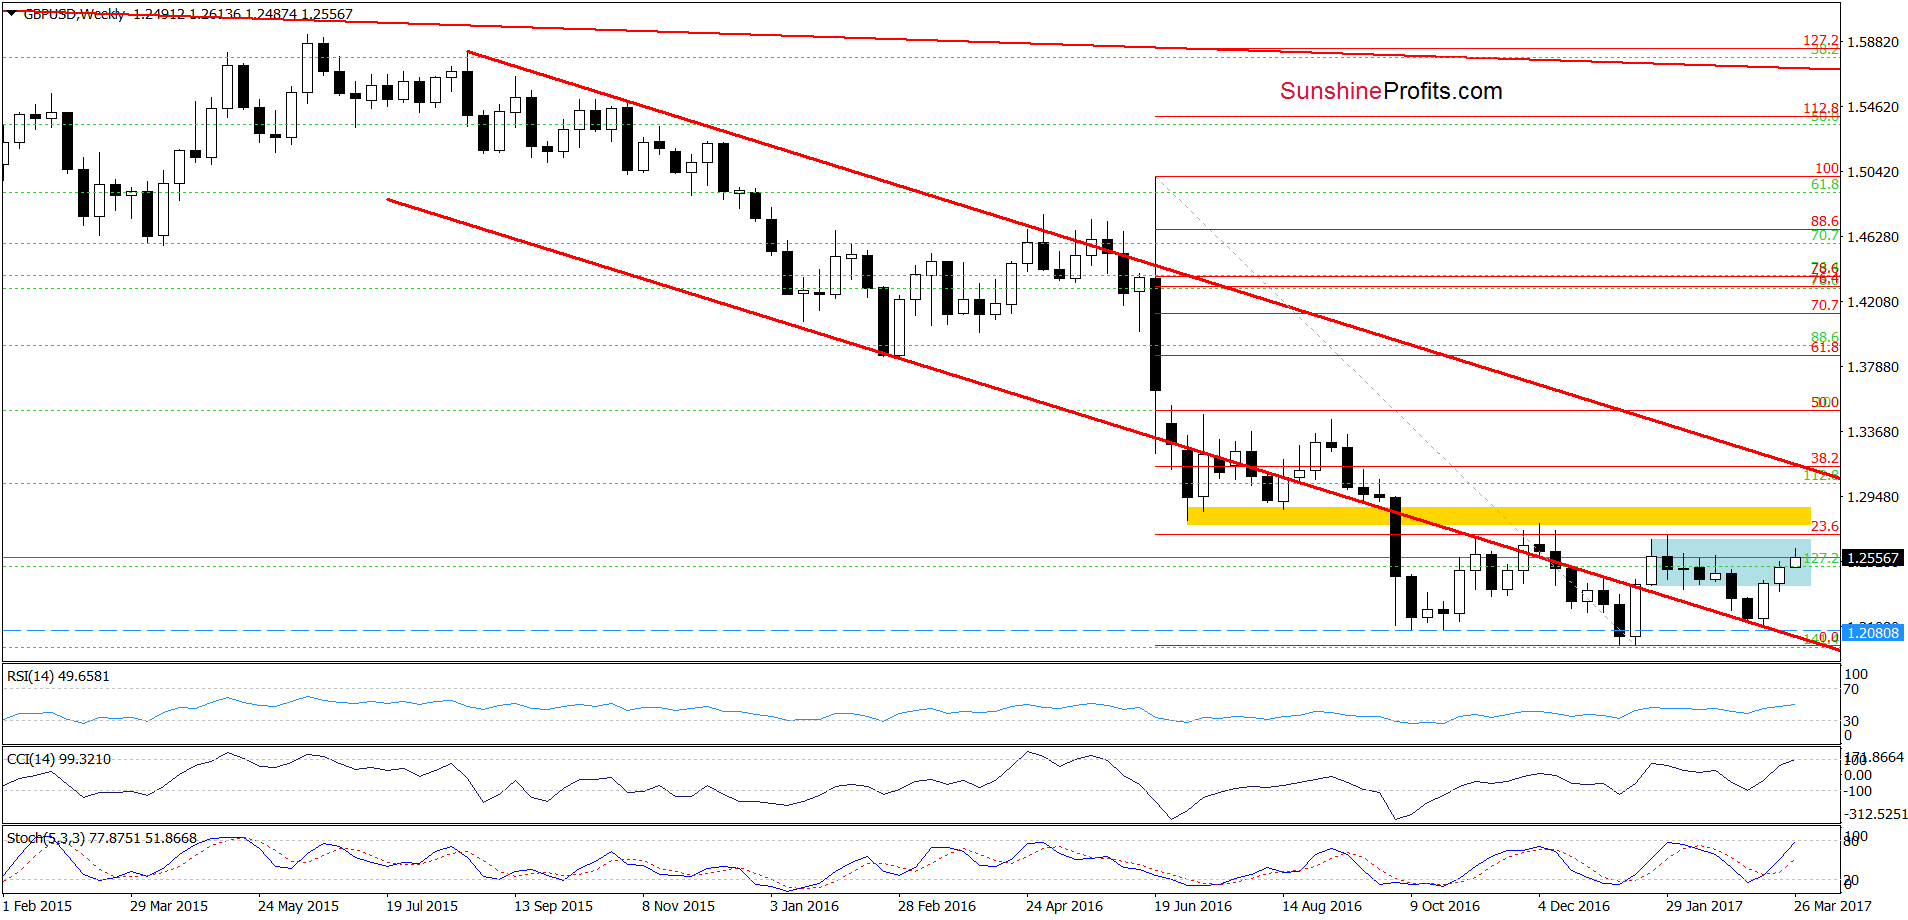
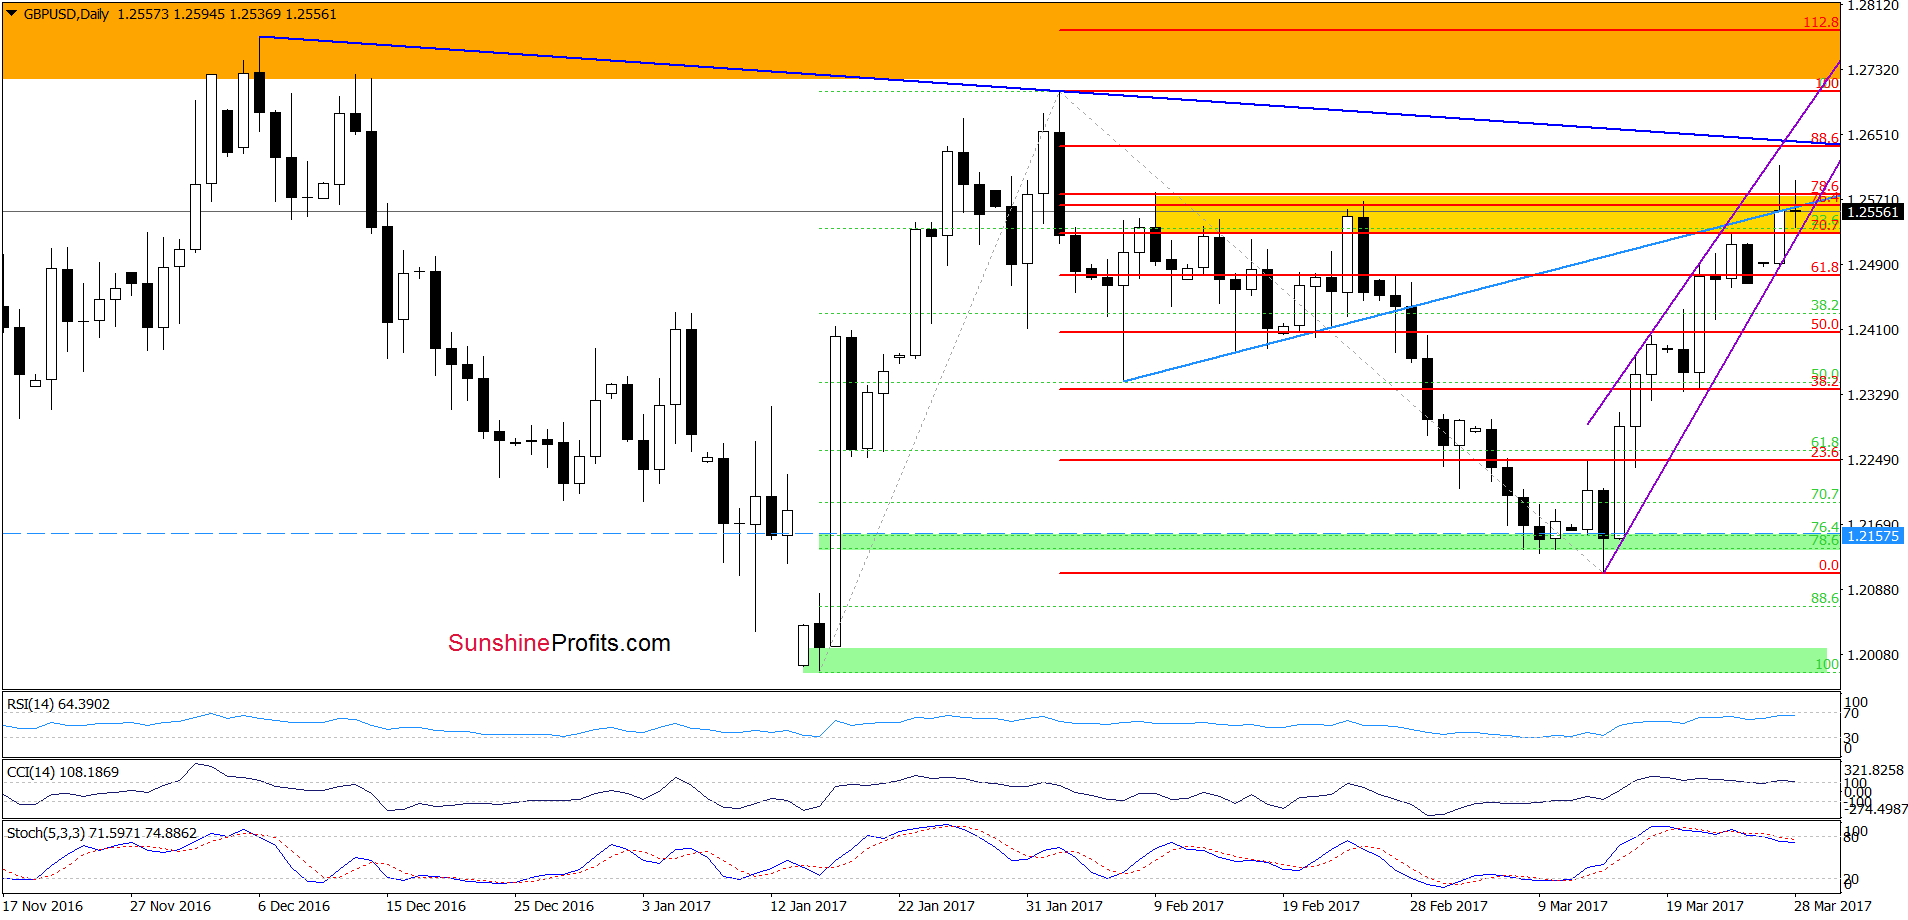
Looking at the daily chart, we see that GBP/USD moved higher once again and broke above the yellow resistance zone yesterday. With this increase the exchange rate approached the blue declining resistance line based on the previous highs, which encouraged currency bears to act. As a result, the pair gave up some gains, but it is still trading in the purple rising trend channel, which suggests that as long as there is no breakdown under the lower line of the formation further deterioration is not likely to be seen. Nevertheless, the current position of the indicators suggests that a bigger downward move is just around the corner. Therefore, if GBP/USD declines and closes today’s or one of the following sessions below the purple rising support line we’ll likely open short positions. How low could the exchange rate go if we see such breakdown? In our opinion, the initial downside target for currency bears will be around 1.2333-1.2338, where last week’s lows are. If this support is broken, we’ll see a decline to the March lows and the green support zone in the coming week(s).
Very short-term outlook: mixed
Short-term outlook: mixed with bearish bias
MT outlook: mixed
LT outlook: mixed
Trading position (short-term; our opinion): No positions are justified from the risk/reward perspective. However, if GBP/USD drops under the lower border of the purple rising trend channel, we’ll consider opening short positions. We will keep you informed should anything change, or should we see a confirmation/invalidation of the above.
AUD/USD
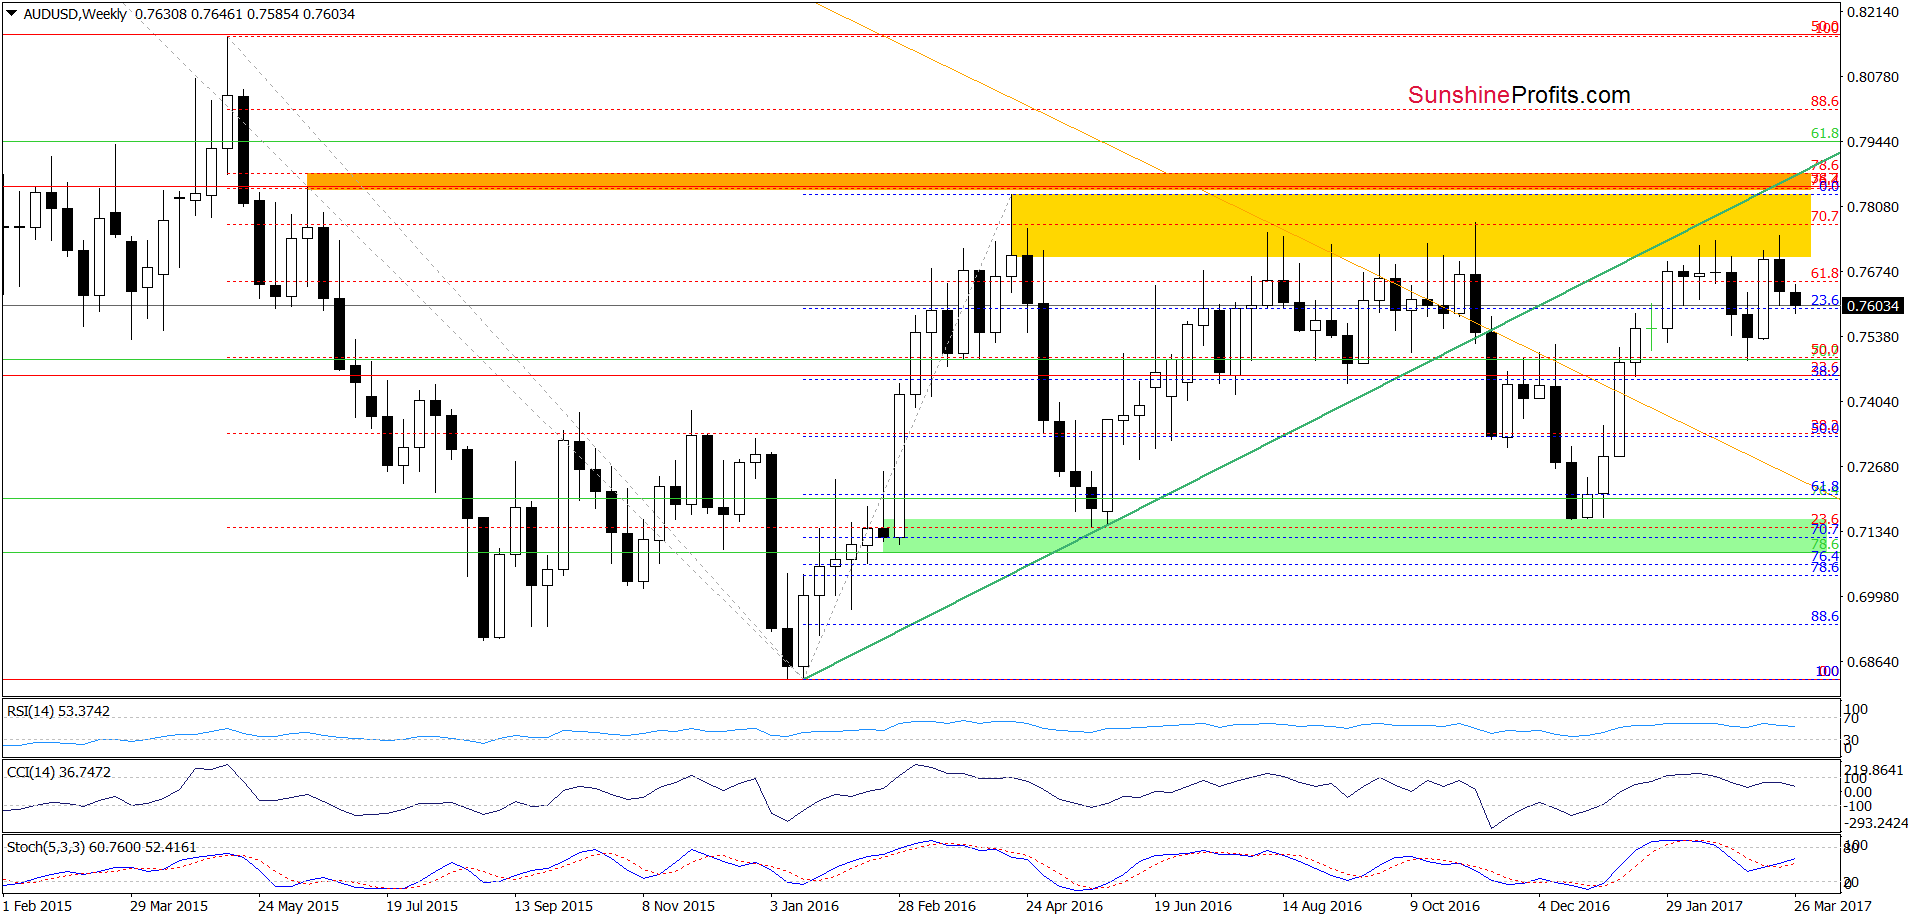
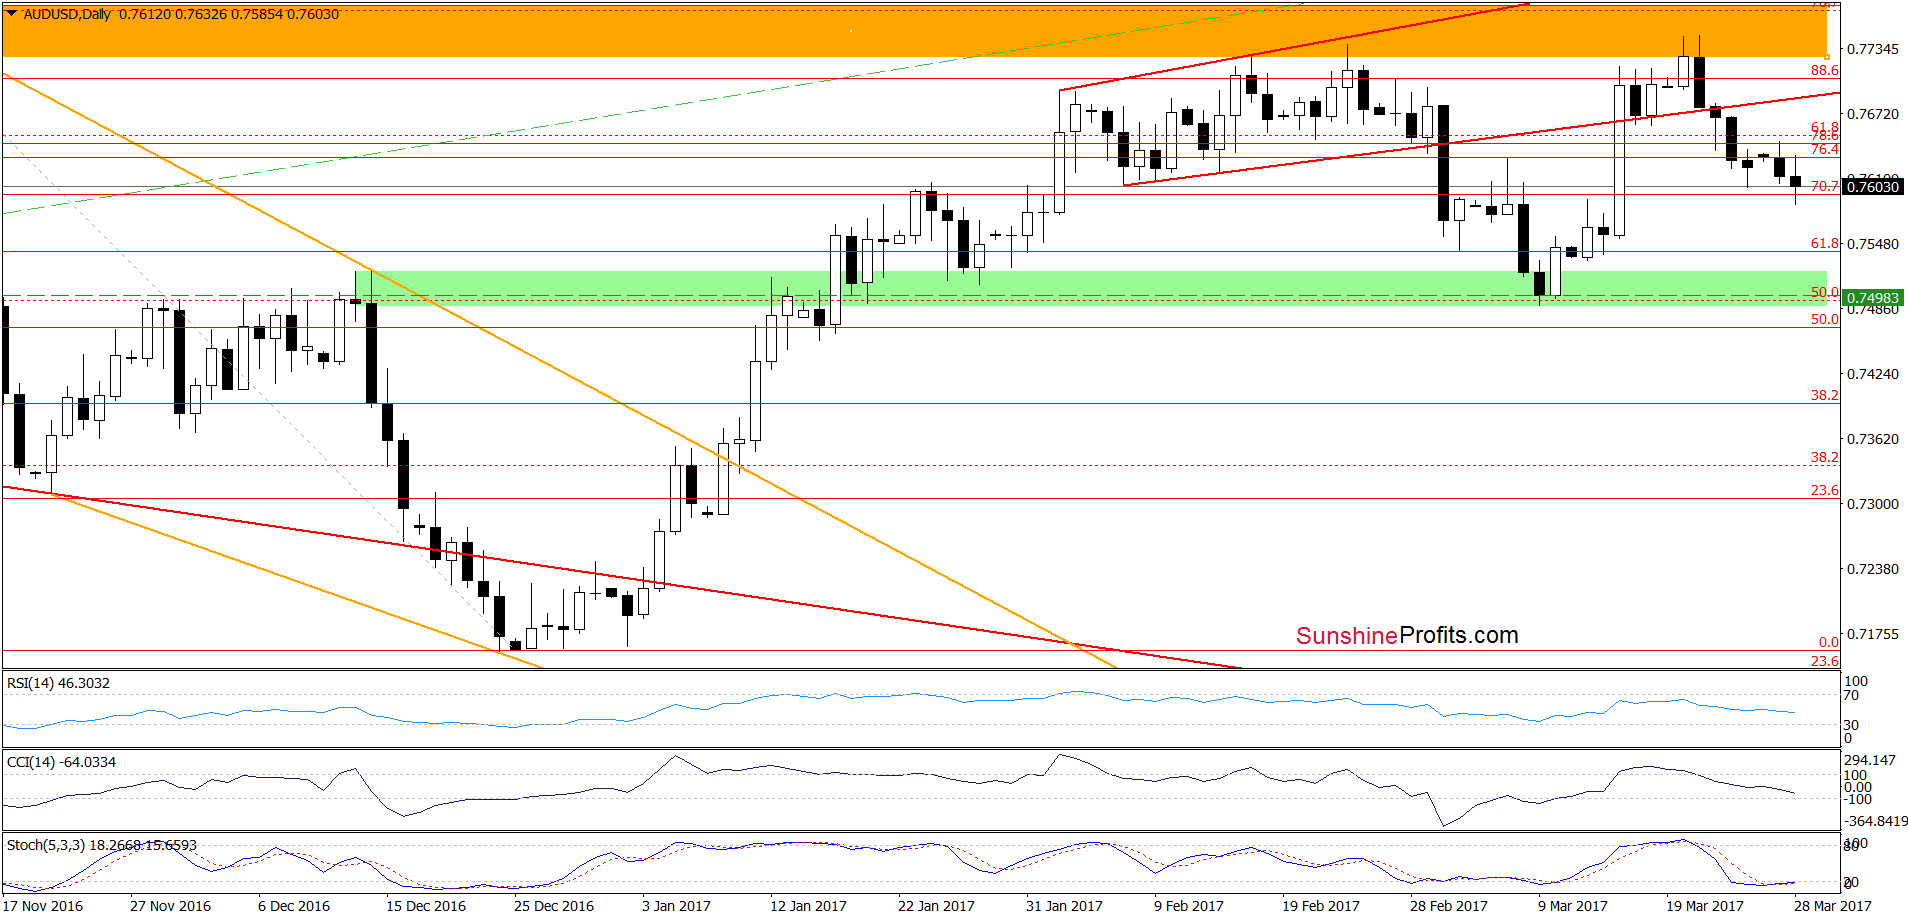
From today’s point of view, we see that AUD/USD extended losses below the lower border of the red rising trend channel, which means that what we wrote on March 22 is up-to-date also today:
(…) the exchange rate dropped under the previously-broken lower border of the red rising trend channel, which is an additional bearish development. Taking all the above and the sell signals generated by the indicators into account, we believe that opening short positions is justified from the risk/reward perspective. How low could the exchange rate go in the coming days? In our opinion, the initial downside target will be the March low and the green support zone.
Very short-term outlook: bearish
Short-term outlook: mixed with bearish bias
MT outlook: mixed
LT outlook: mixed
Trading position (short-term; our opinion): Short positions (with a stop-loss order at 0.7873 and the initial downside target at 0.7498) are justified from the risk/reward perspective. We will keep you informed should anything change, or should we see a confirmation/invalidation of the above.
Thank you.
Nadia Simmons
Forex & Oil Trading Strategist
Przemyslaw Radomski, CFA
Founder, Editor-in-chief, Gold & Silver Fund Manager
Gold & Silver Trading Alerts
Forex Trading Alerts
Oil Investment Updates
Oil Trading Alerts

