

Earlier today, the Bank of England left interest rates at record lows, which pushed the British pound higher against the greenback. As a result, GBP/USD climbed above 1.2300. how high could the exchange rate go in the coming days?
In our opinion the following forex trading positions are justified - summary:
- EUR/USD: short (a stop-loss order at 1.0810; the initial downside target at 1.0388)
- GBP/USD: none
- USD/JPY: none
- USD/CAD: none
- USD/CHF: long (a stop-loss order at 0.9891; the initial upside target at 1.0180)
- AUD/USD: none
EUR/USD
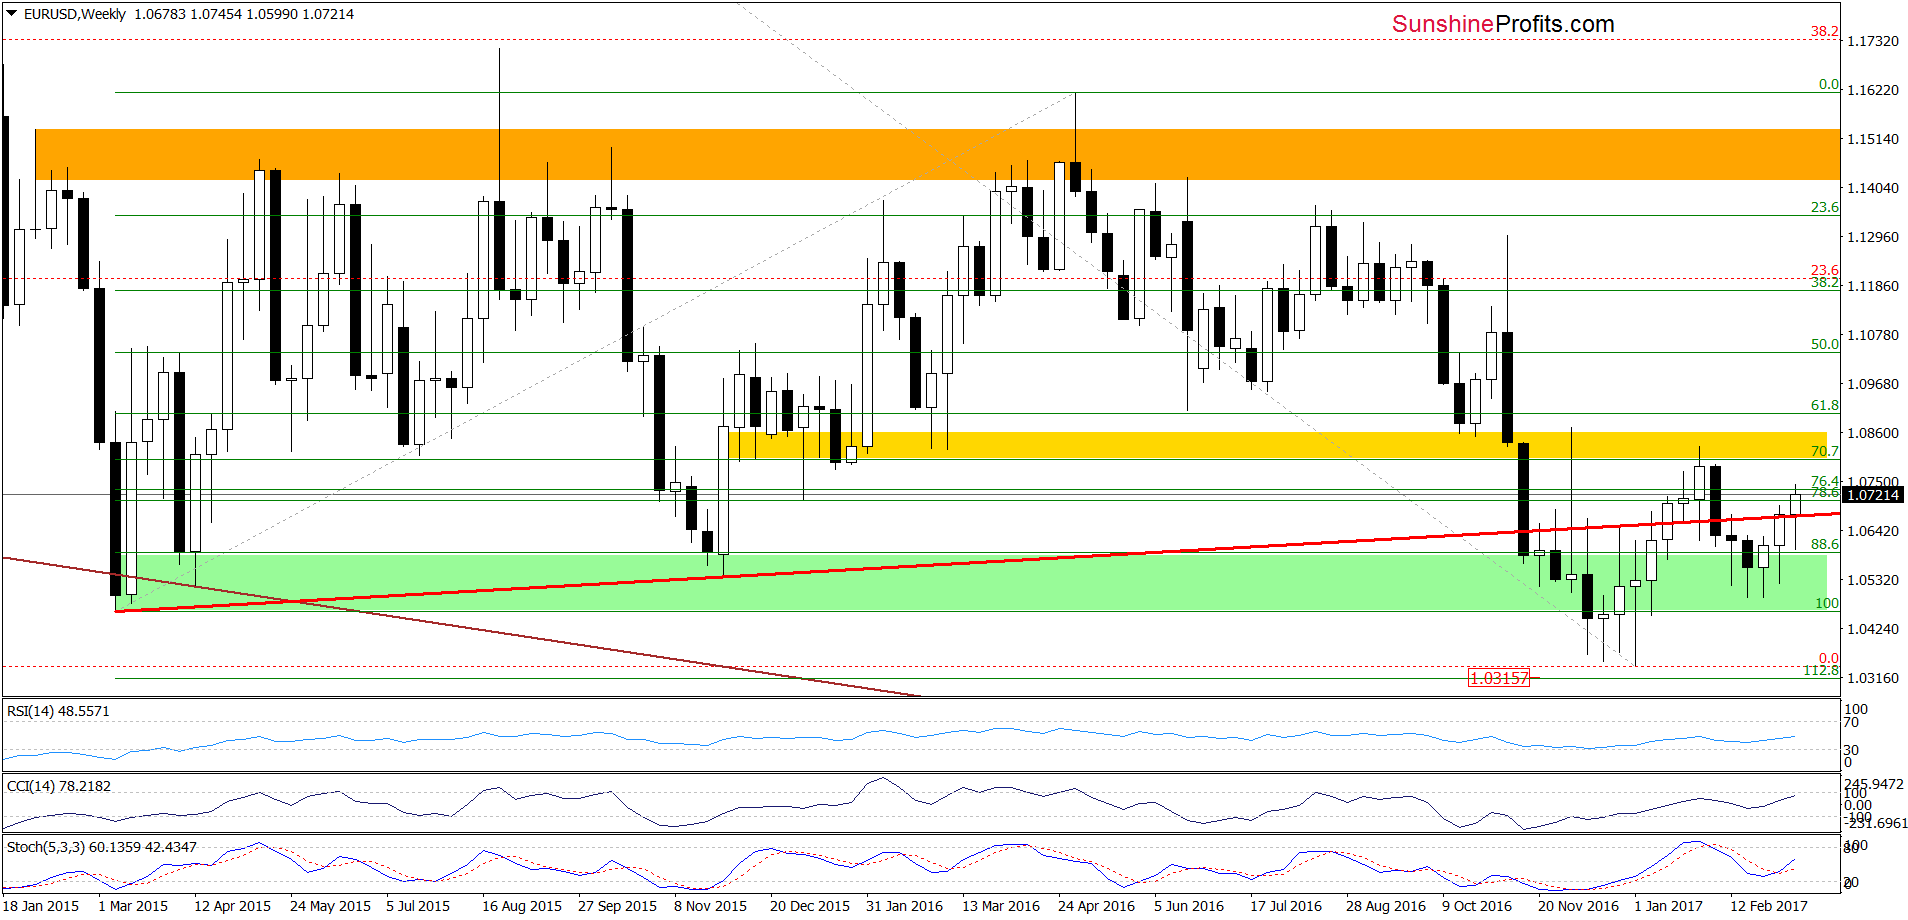
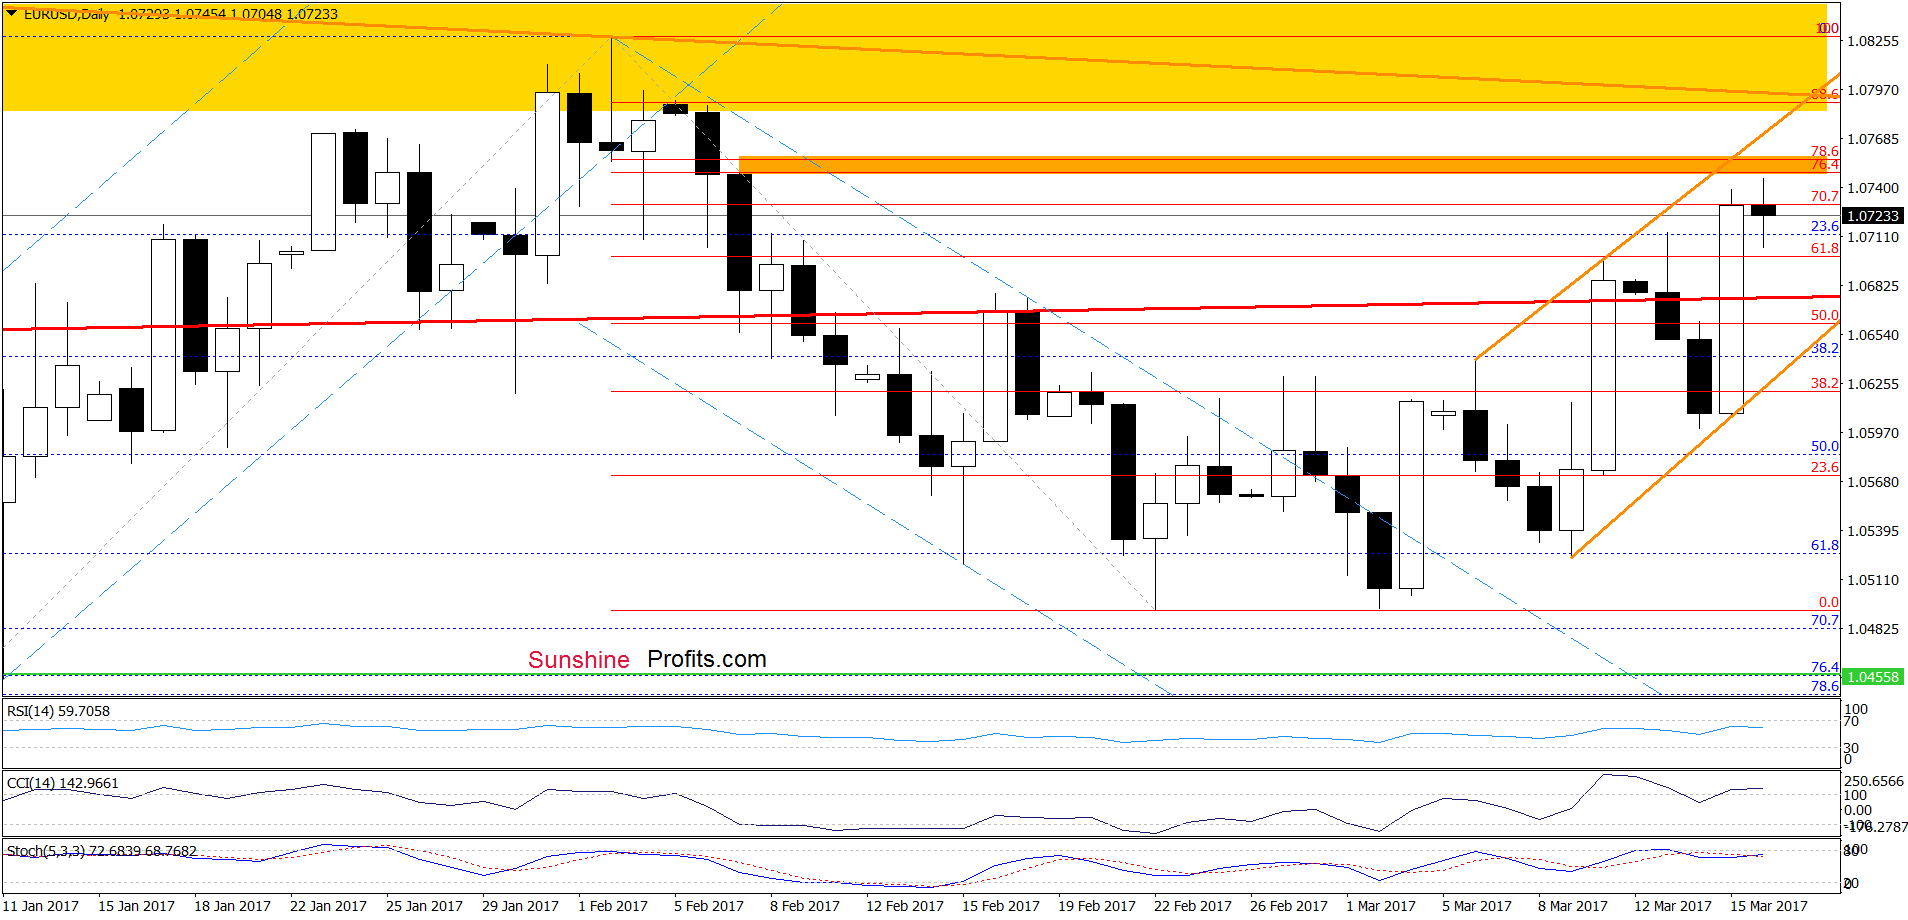
Yesterday, EUR/USD moved sharply higher and broke above the long-term red line, which encouraged currency bulls to act. As a result, the exchange rate climbed above the 61.8% Fibonacci retracement (based on the February downward move) and approached the orange resistance zone earlier today. Taking into account the fact that there are no sell signals generated by the daily indicators, it seems that we may see another upswing and a test of the upper border of the orange resistance zone in the coming day(s). Nevertheless, the space for gains seems limited as the orange resistance line based on the previous highs is not far from current levels.
Very short-term outlook: bearish
Short-term outlook: mixed with bearish bias
MT outlook: mixed
LT outlook: mixed
Trading position (short-term; our opinion): Short positions with a stop-loss order at 1.0810 and the initial downside target at 1.0388 are justified from the risk/reward perspective. We will keep you informed should anything change, or should we see a confirmation/invalidation of the above.
GBP/USD
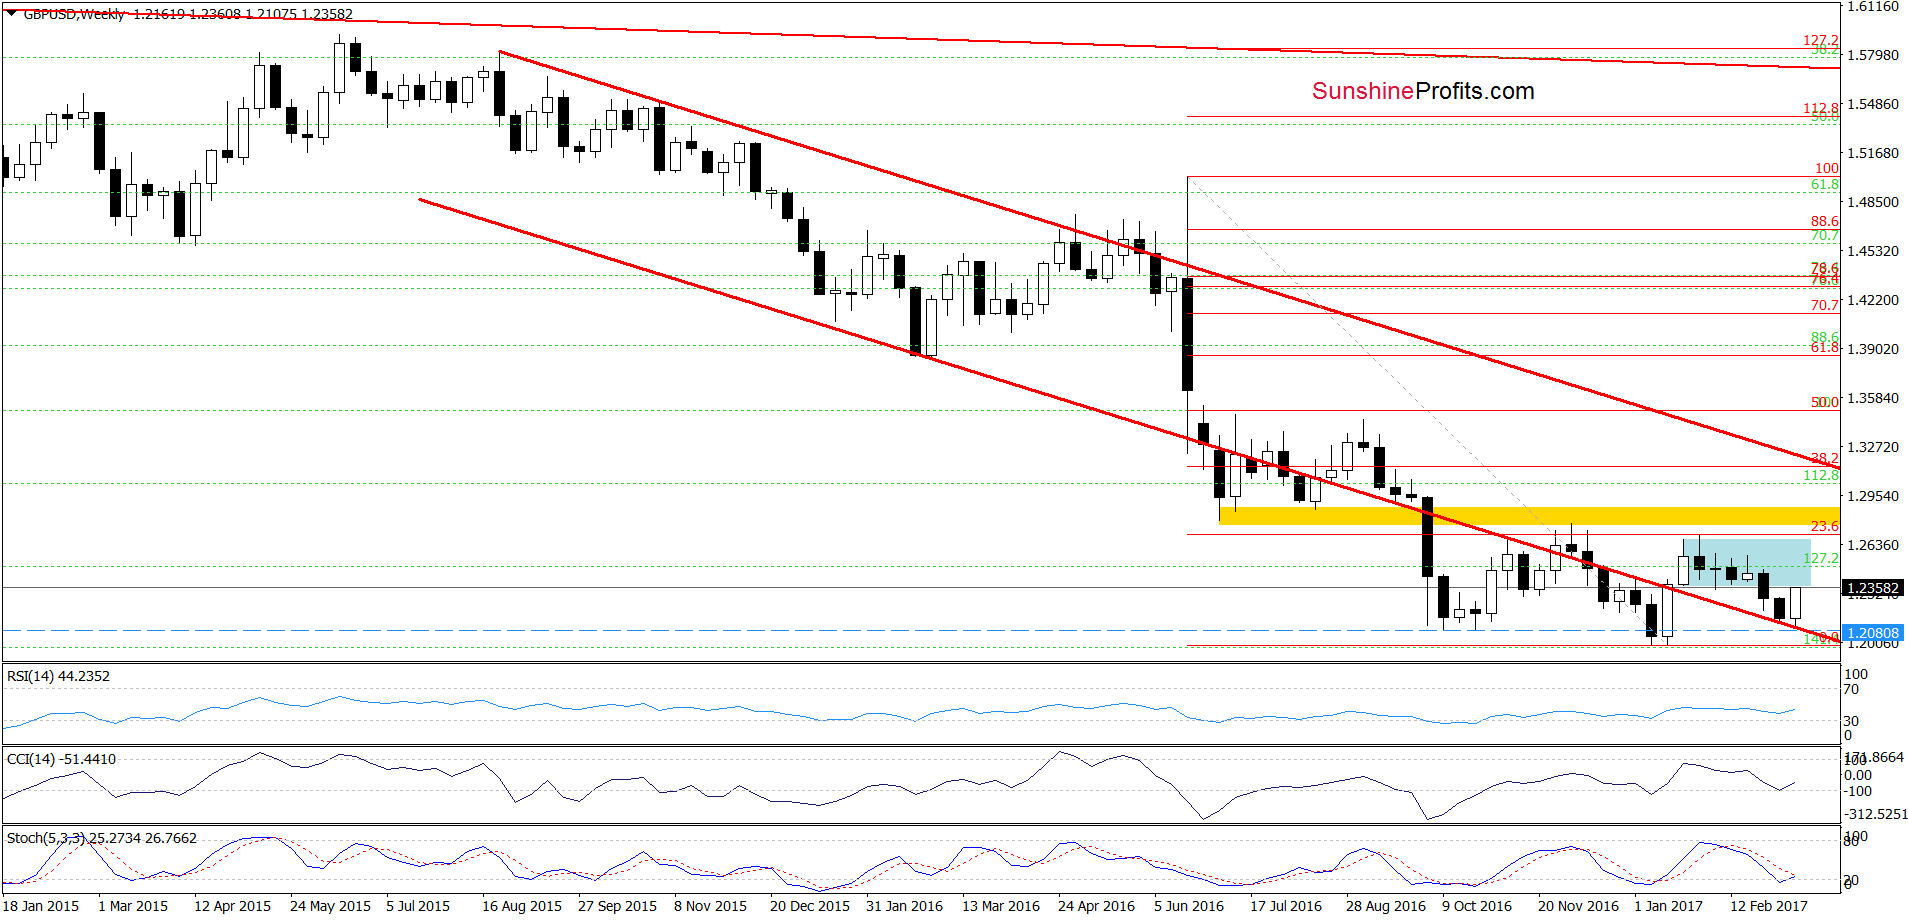
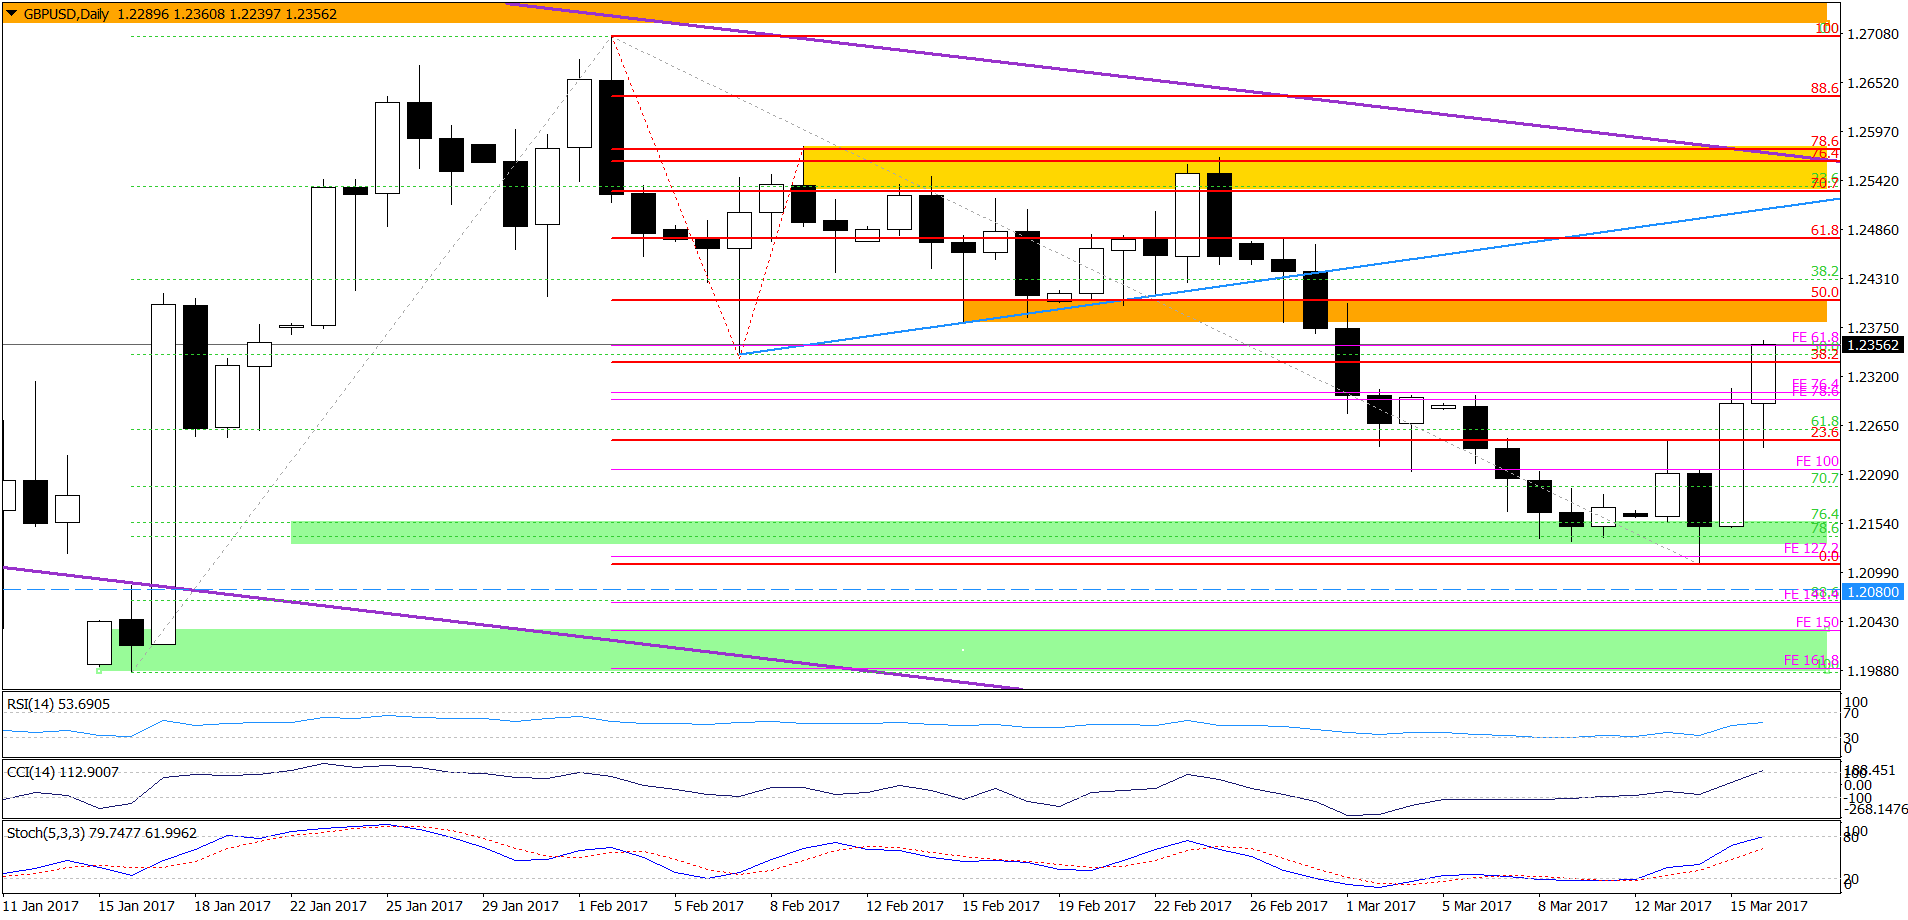
Looking at the weekly chart, we see that the lower border of the red declining trend channel triggered a rebound, which took GBP/USD t the previously-broken lower border of the blue consolidation.
How did this move affect the very short-term picture? Let’s check.
On Monday, we wrote the following:
(...) the green support zone together with the lower border of the red declining trend channel (seen on the weekly chart) encouraged currency bulls to act and GBP/USD extended gains earlier today. Additionally, all indicators generated buy signals, which suggests further improvement and a climb to (...) the 38.2% Fibonacci retracement (...)
From today’s point of view, we see that the situation developed in line with the above scenario and GBP/USD extended gains, climbing slightly above our upside target earlier today. What’s next? Taking into account the fact that the buy signals generated by the indicators are still in play, we think that anther upswing and a test of the strength of the orange resistance zone should not surprise us in the coming day(s).
Very short-term outlook: bullish
Short-term outlook: mixed
MT outlook: mixed
LT outlook: mixed
Trading position (short-term; our opinion): No positions are justified from the risk/reward perspective. We will keep you informed should anything change, or should we see a confirmation/invalidation of the above.
USD/JPY
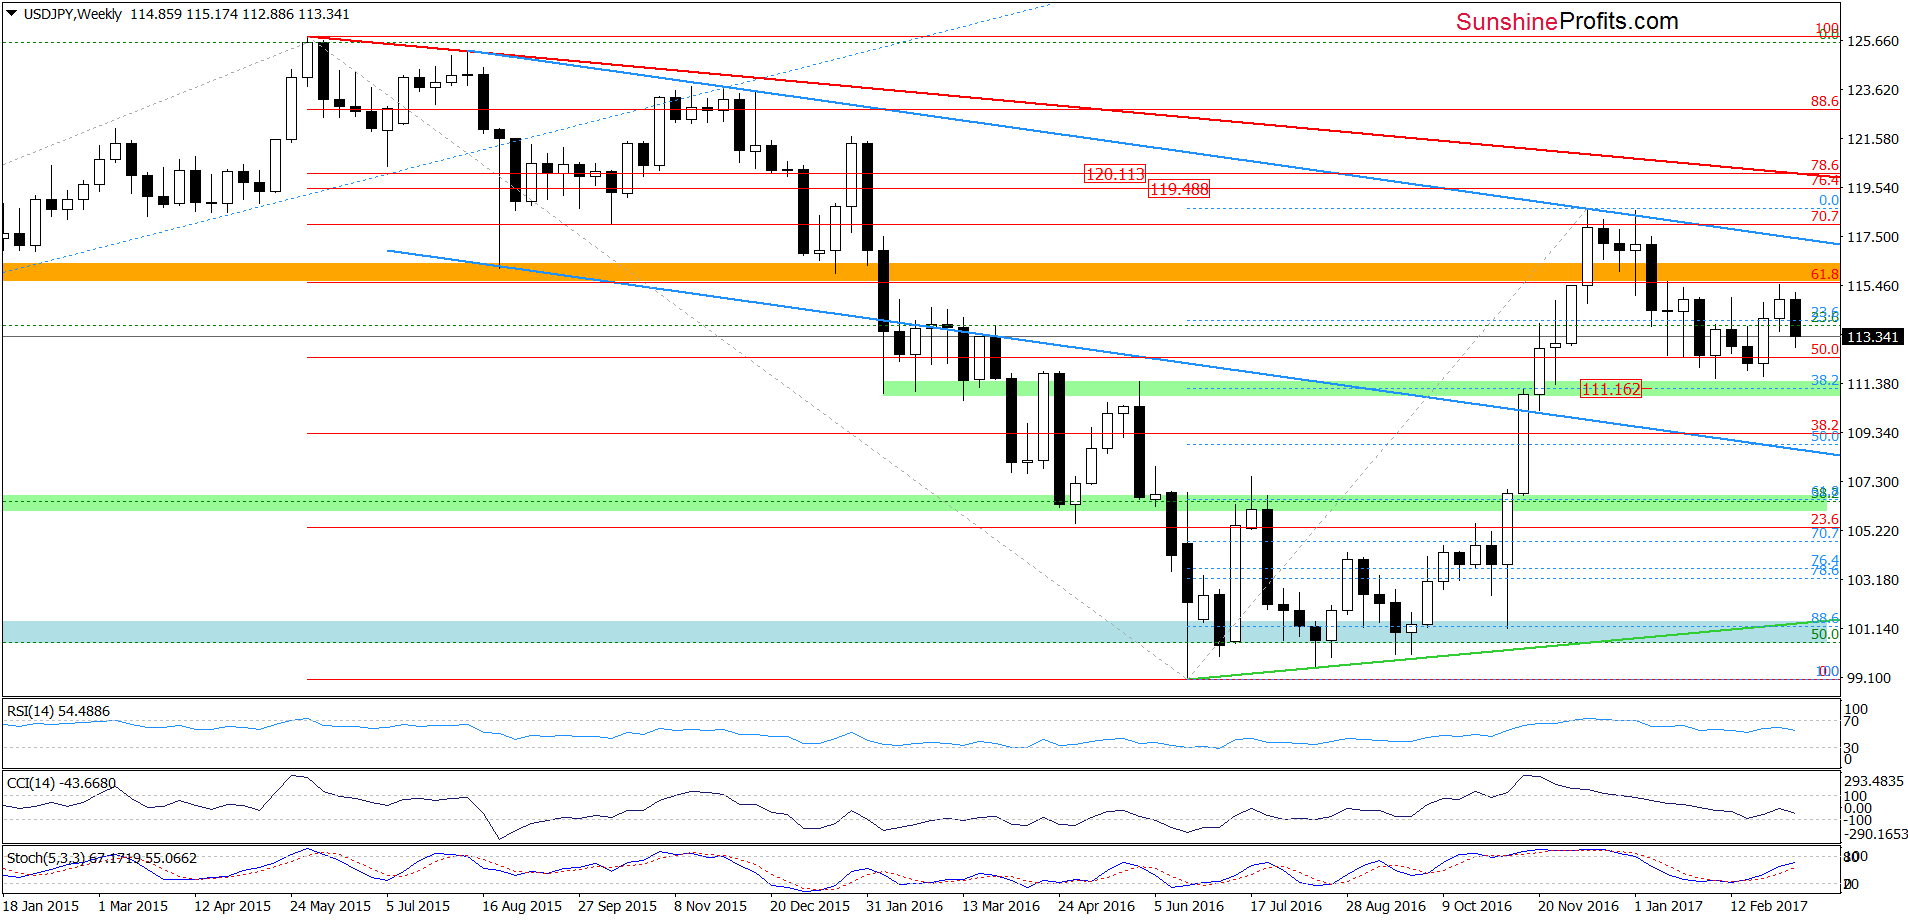
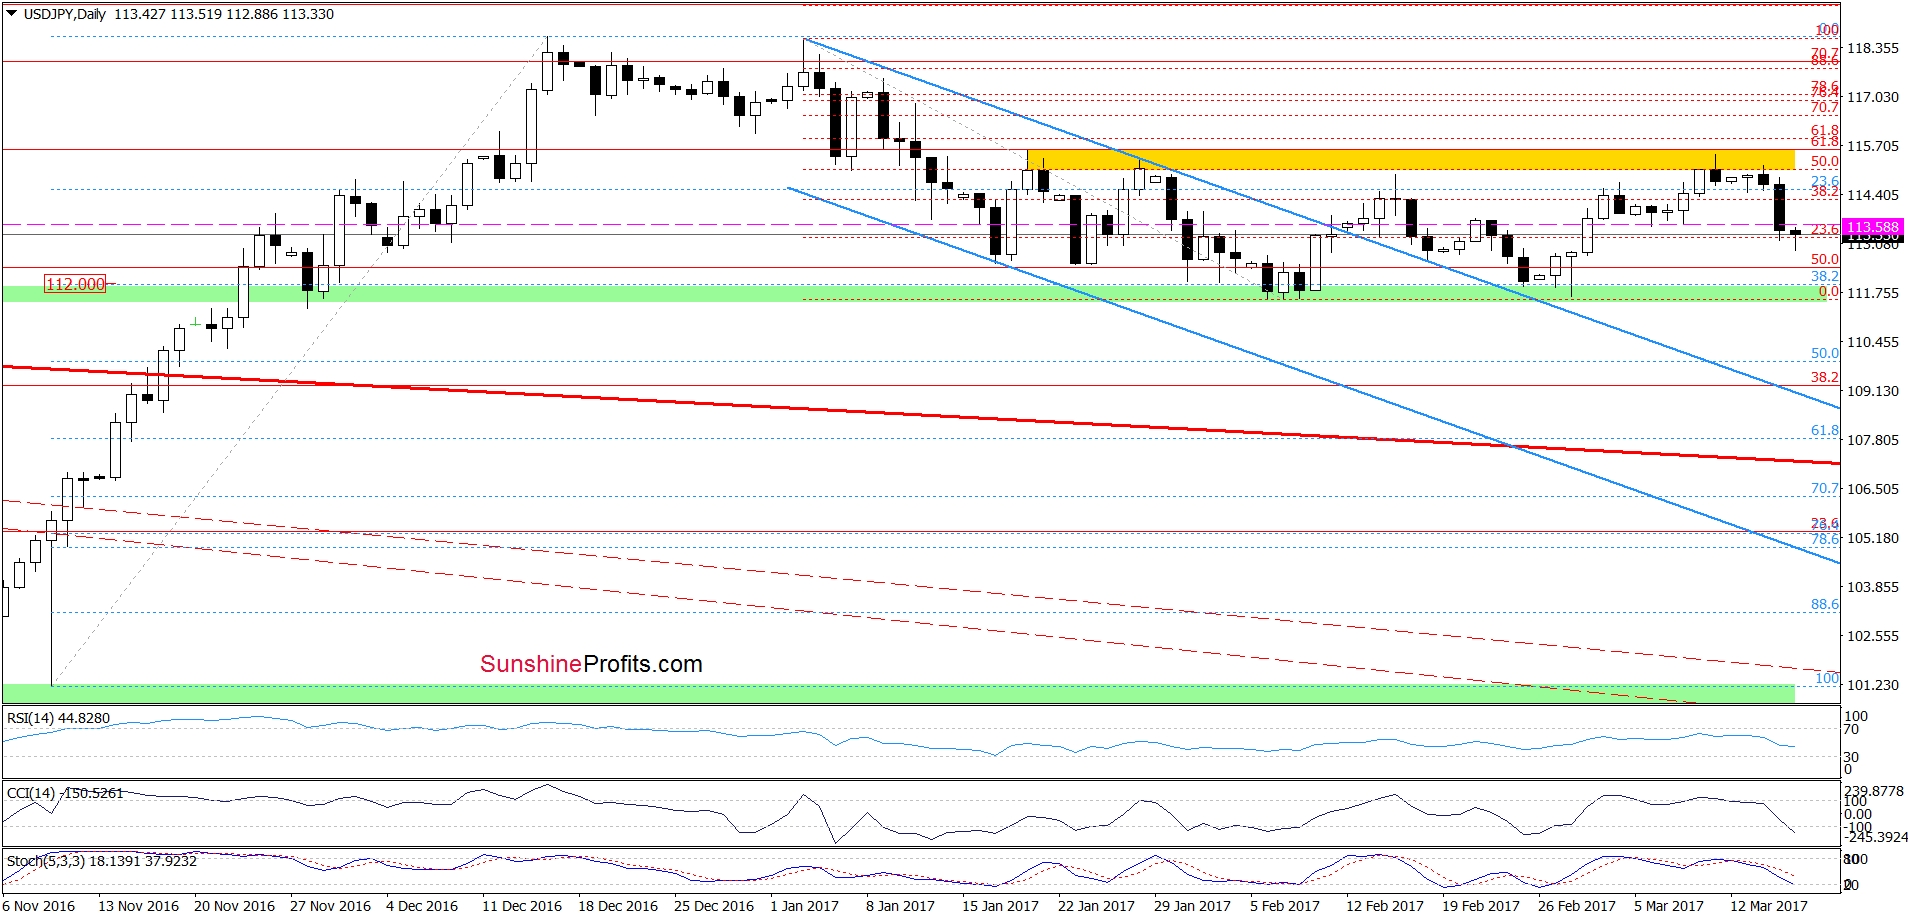
Quoting our previous commentary on this currency pair:
(…) Where will the exchange rate head next? Taking into account the current position of the indicators it seems that another attempt to move lower is just around the corner – especially when we factor in the proximity to the yellow resistance zone. As you see, this area was strong enough to stop currency bulls several times in the previous weeks, which increases the probability of reversal. If his is the case and USD/JPY declines from here, the initial downside target will be around 113.54-113.58, where the recent lows are.
Looking at the daily chart, we see that the situation developed in tune with our assumptions and USD/JPY declined in the previous days, slipping below our initial downside target earlier today. What’s next? The sell signals generated by the indicators suggest that further deterioration is likely. If this is the case and the exchange rate moves lower once again, we’ll likely see a re-test of the green support zone and the 38.22% Fibonacci retracement in the coming day(s).
Very short-term outlook: mixed with bearish bias
Short-term outlook: mixed
MT outlook: mixed
LT outlook: mixed
Trading position (short-term; our opinion): No positions are justified from the risk/reward perspective. We will keep you informed should anything change, or should we see a confirmation/invalidation of the above.
Thank you.
Nadia Simmons
Forex & Oil Trading Strategist
Przemyslaw Radomski, CFA
Founder, Editor-in-chief, Gold & Silver Fund Manager
Gold & Silver Trading Alerts
Forex Trading Alerts
Oil Investment Updates
Oil Trading Alerts

