

Although USD/CAD moved lower yesterday, the pair reached the long-term support line. Will it stop currency bears once again in the coming week?
In our opinion the following forex trading positions are justified - summary:
- EUR/USD: none
- GBP/USD: none
- USD/JPY: none
- USD/CAD: long (a stop-loss order at 1.2949; the initial upside target at 1.3302)
- USD/CHF: none
- AUD/USD: none
EUR/USD
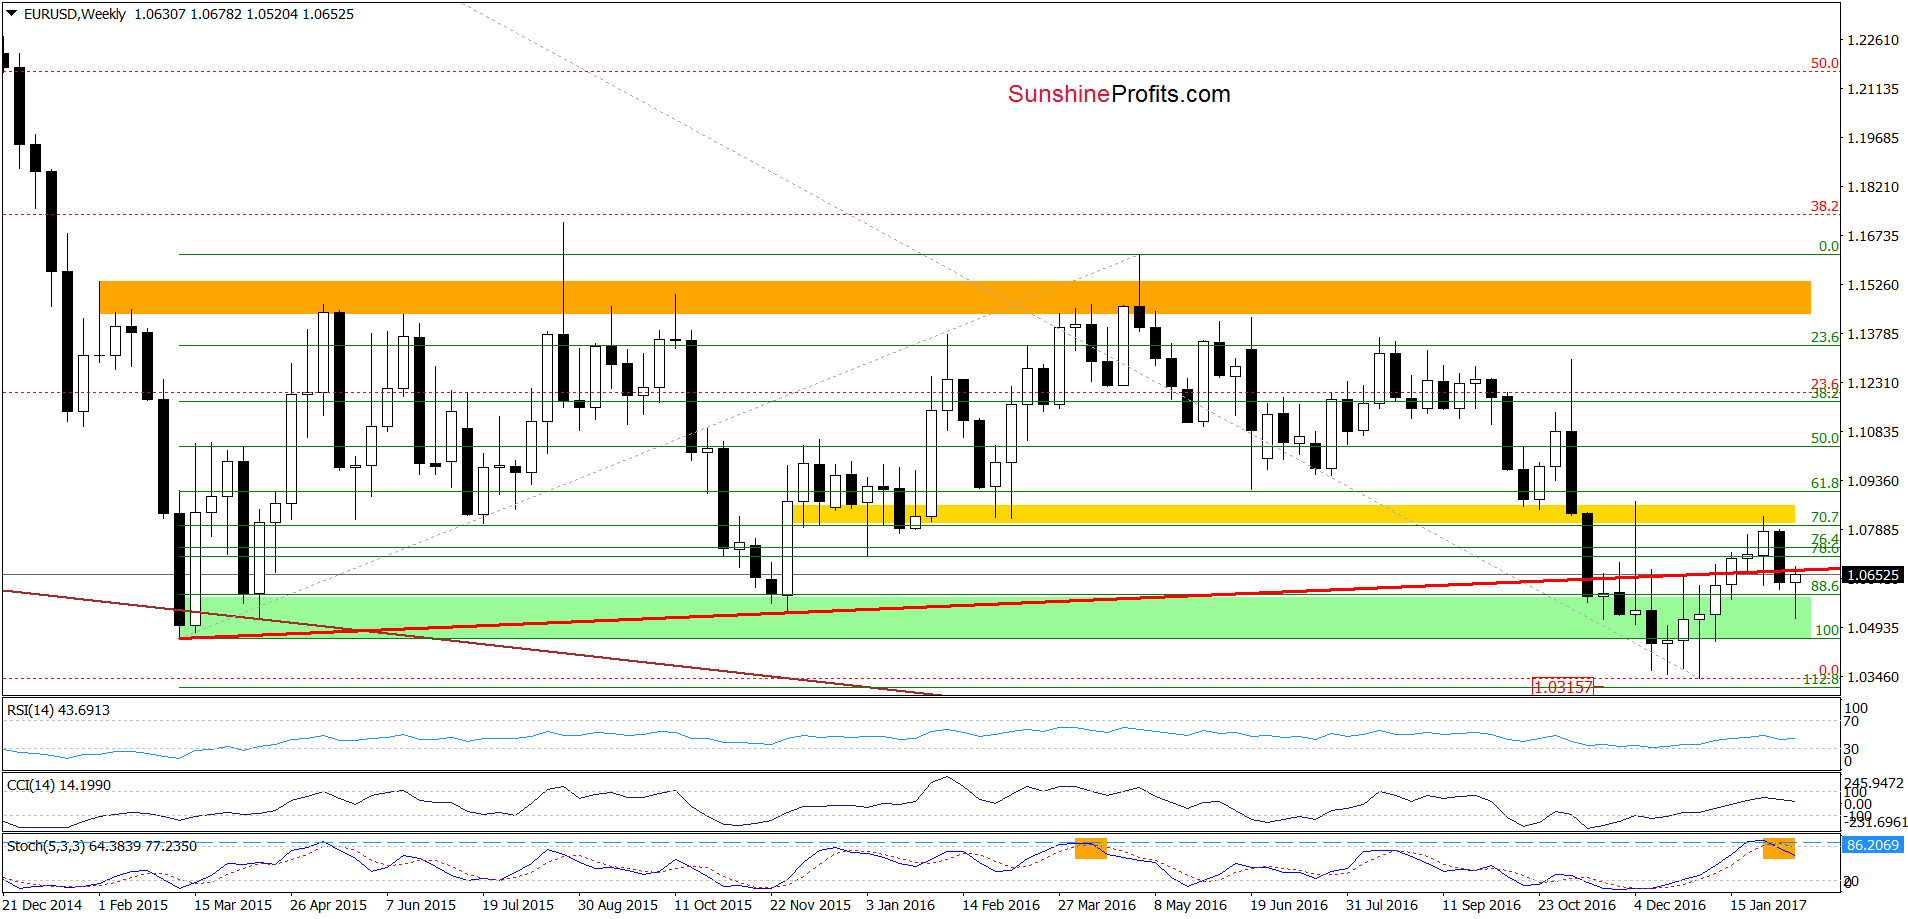
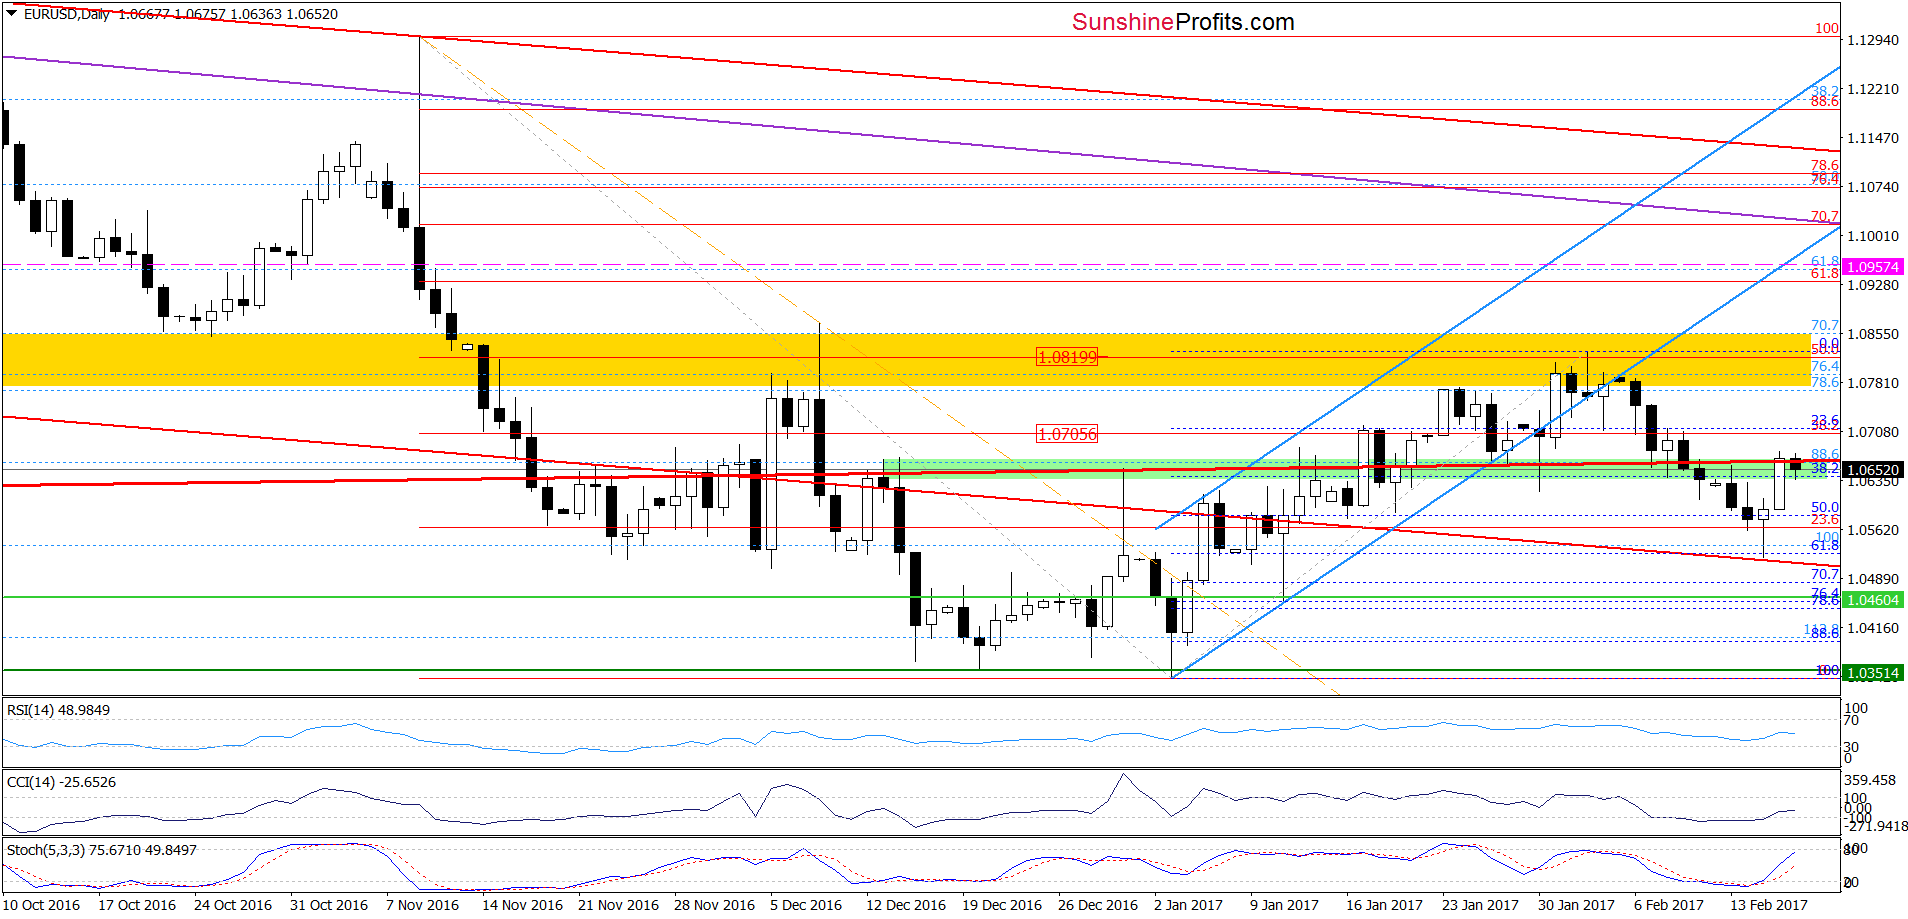
Looking at the charts, we see that although EUR/USD climbed slightly above the green zone and the long-term red line, currency bulls didn’t manage to hold these levels, which resulted in a pullback earlier today. Although such price action suggests another attempt to move lower, buy signals continue to support currency bulls, which makes the situation to unclear to open any positions. Nevertheless, if the exchange rate closes today’s session (and the whole week) under the above-mentioned levels, we’ll consider re-opening short positions.
Very short-term outlook: mixed
Short-term outlook: mixed
MT outlook: mixed
LT outlook: mixed
Trading position (short-term; our opinion): No positions are justified from the risk/reward perspective. We will keep you informed should anything change, or should we see a confirmation/invalidation of the above.
USD/JPY
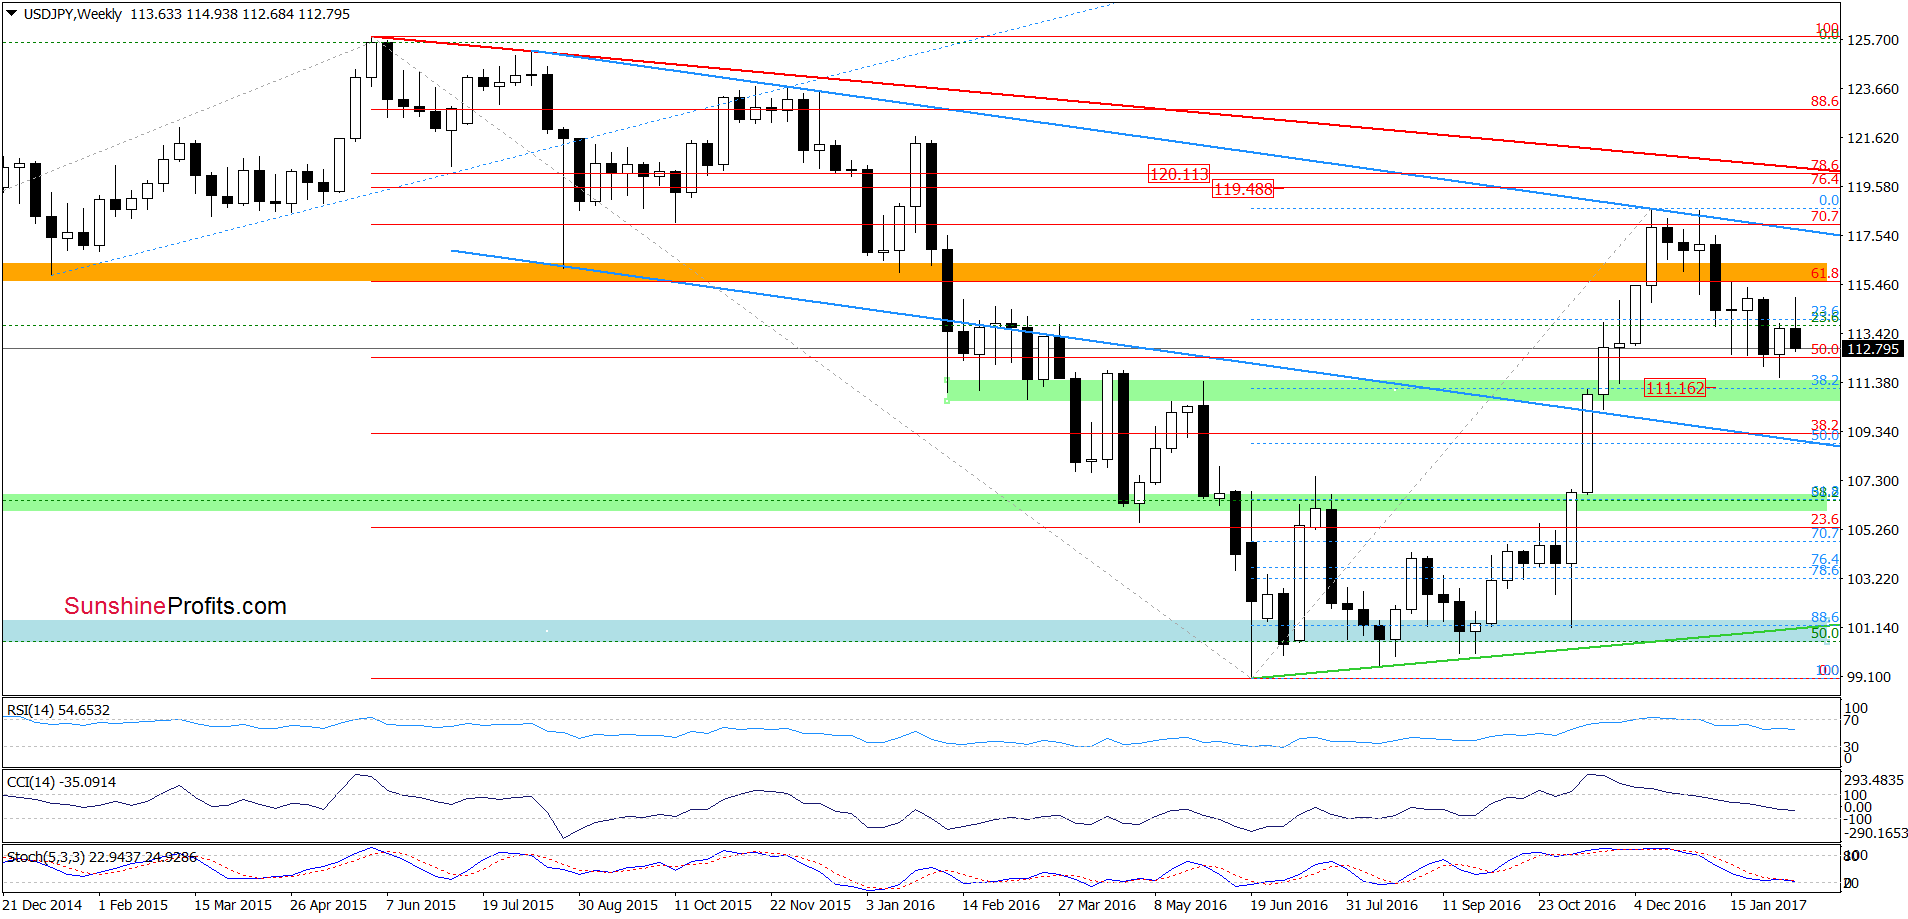
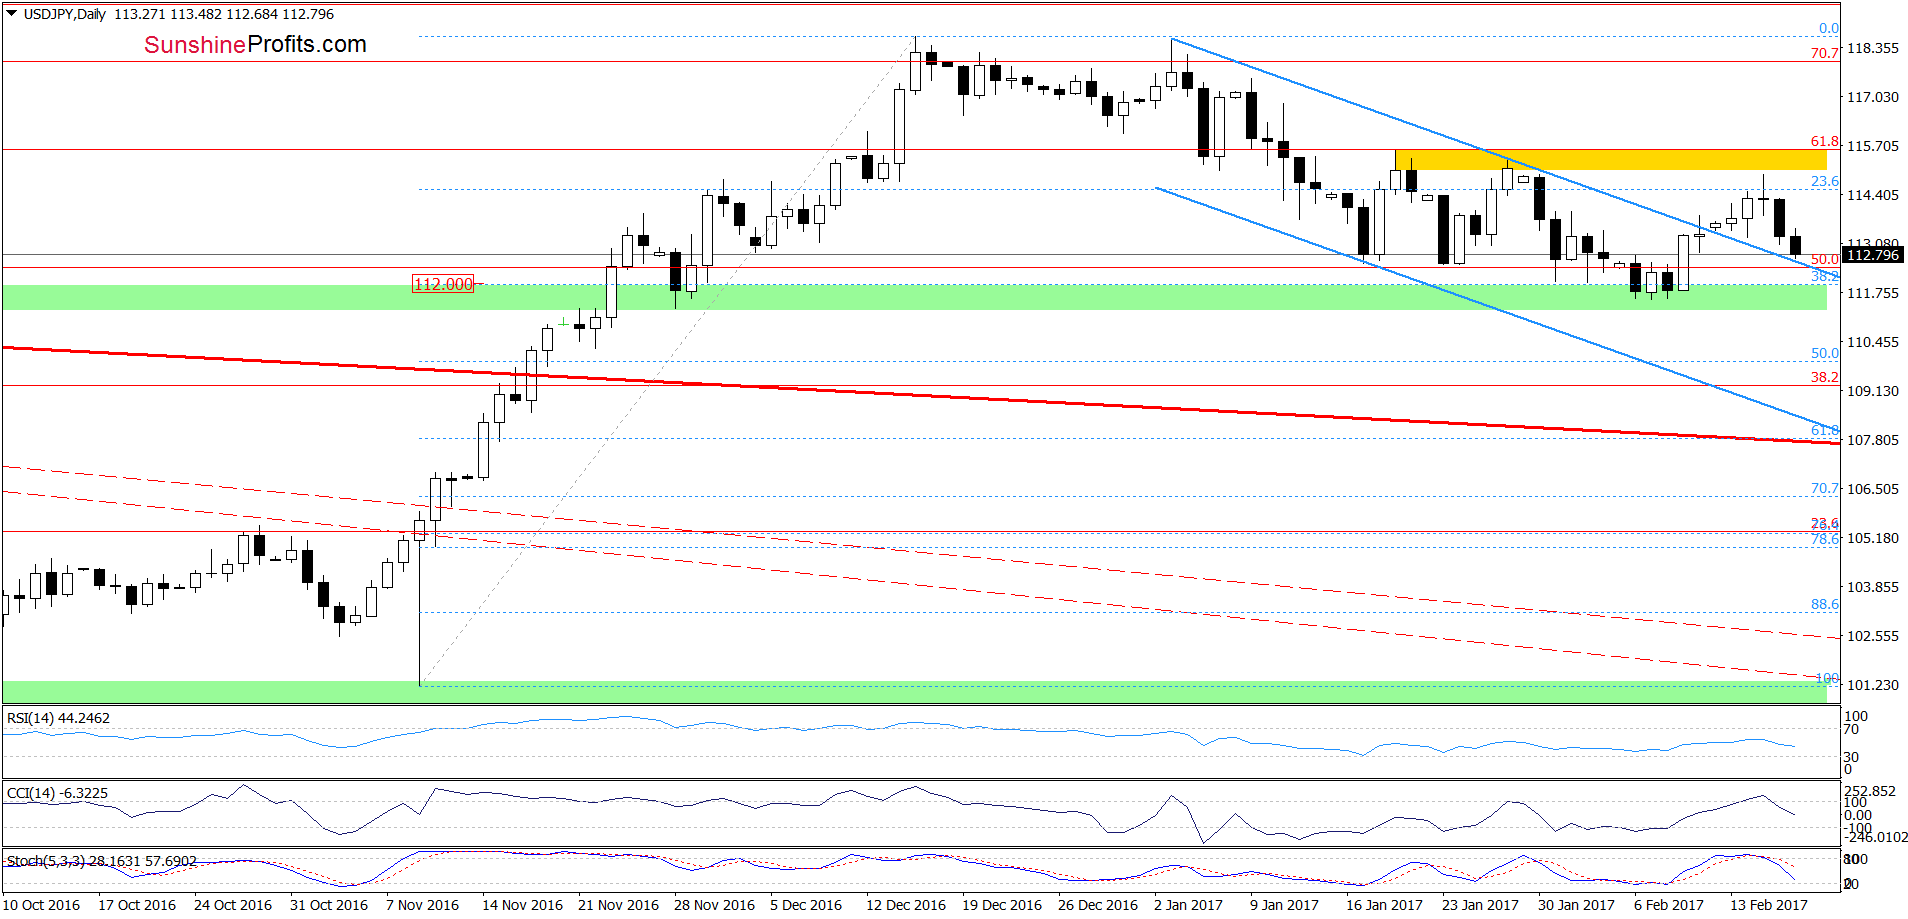
On the daily chart, we see that the proximity to the yellow resistance zone encouraged currency bears to act, which pushed USD/JPY lower in the previous days. Additionally, the CCI and the Stochastic Oscillator generated the sell signals, which suggests that we may see a re-test of the strength of the green support zone and the 38.2% Fibonacci retracement in the coming days.
Very short-term outlook: mixed
Short-term outlook: mixed
MT outlook: mixed
LT outlook: mixed
Trading position (short-term; our opinion): No positions are justified from the risk/reward perspective. We will keep you informed should anything change, or should we see a confirmation/invalidation of the above.
USD/CAD
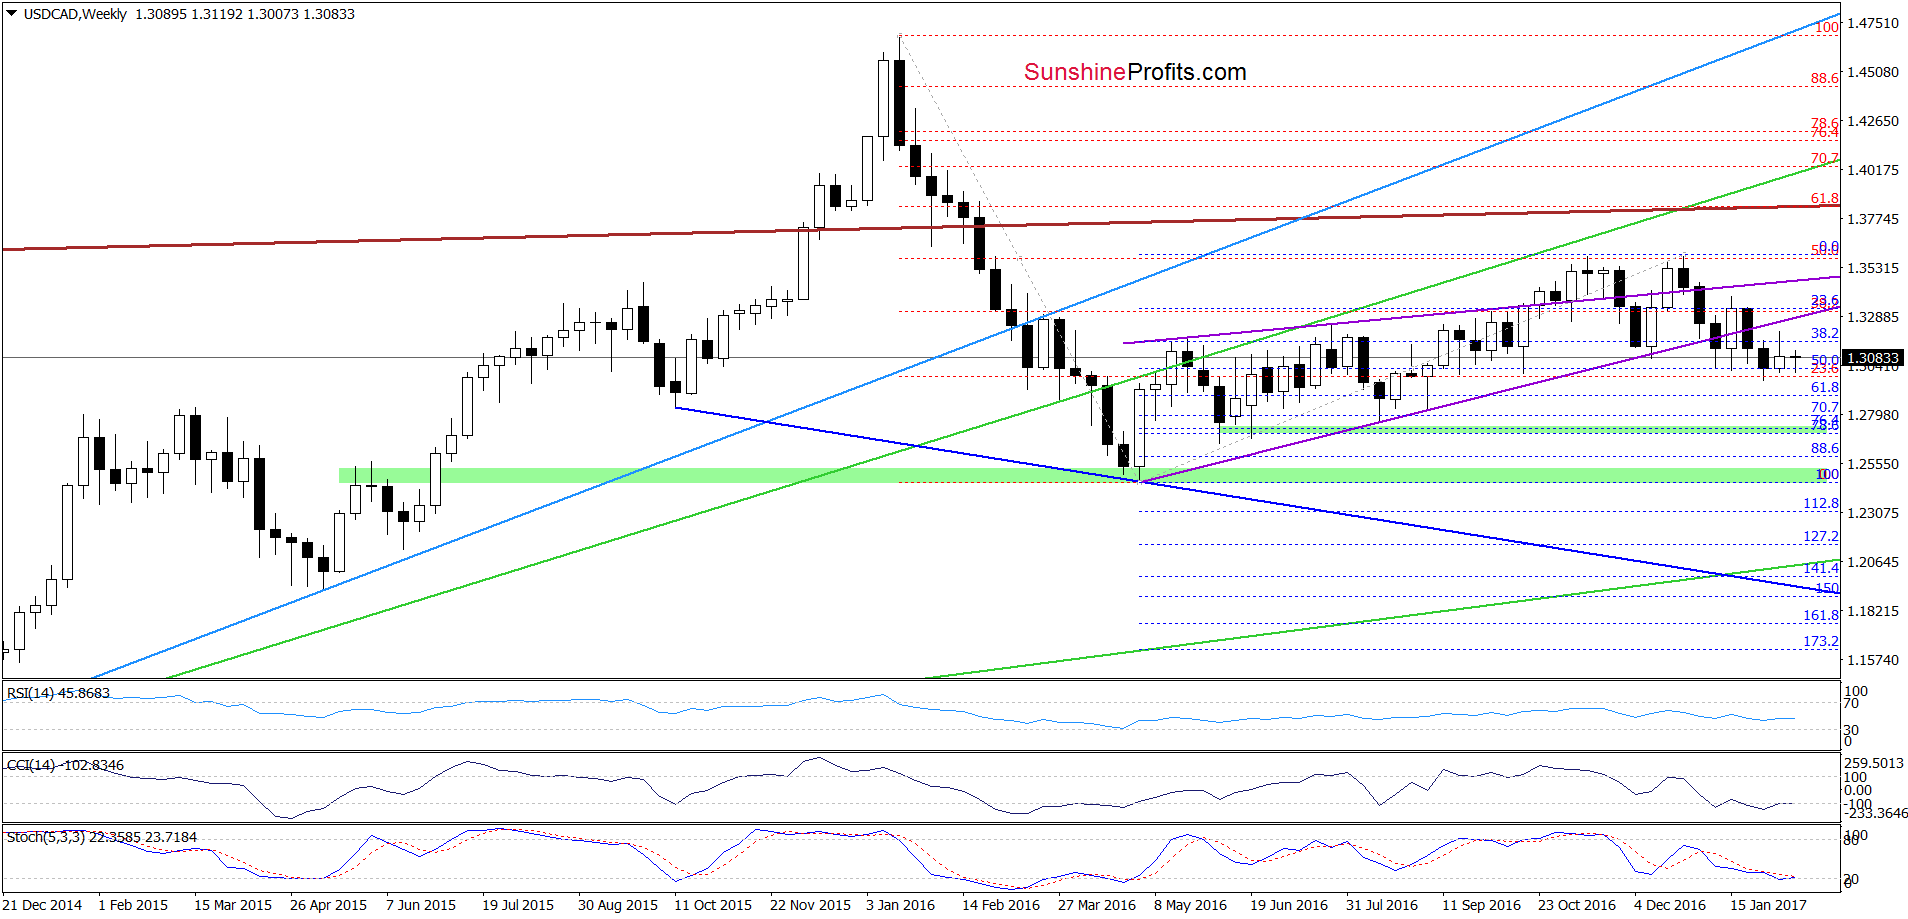
On the weekly chart, we see that USD/CAD is consolidating around the 50% Fibonacci retracement based on the May-December upward move. However, the current position of the indicators (the CCI and the Stochastic Oscillator were around these levels in April 2016) suggests that another bigger move to the upside is just around the corner.
Having said the above, let’s check what can we infer from the very short-term chart.
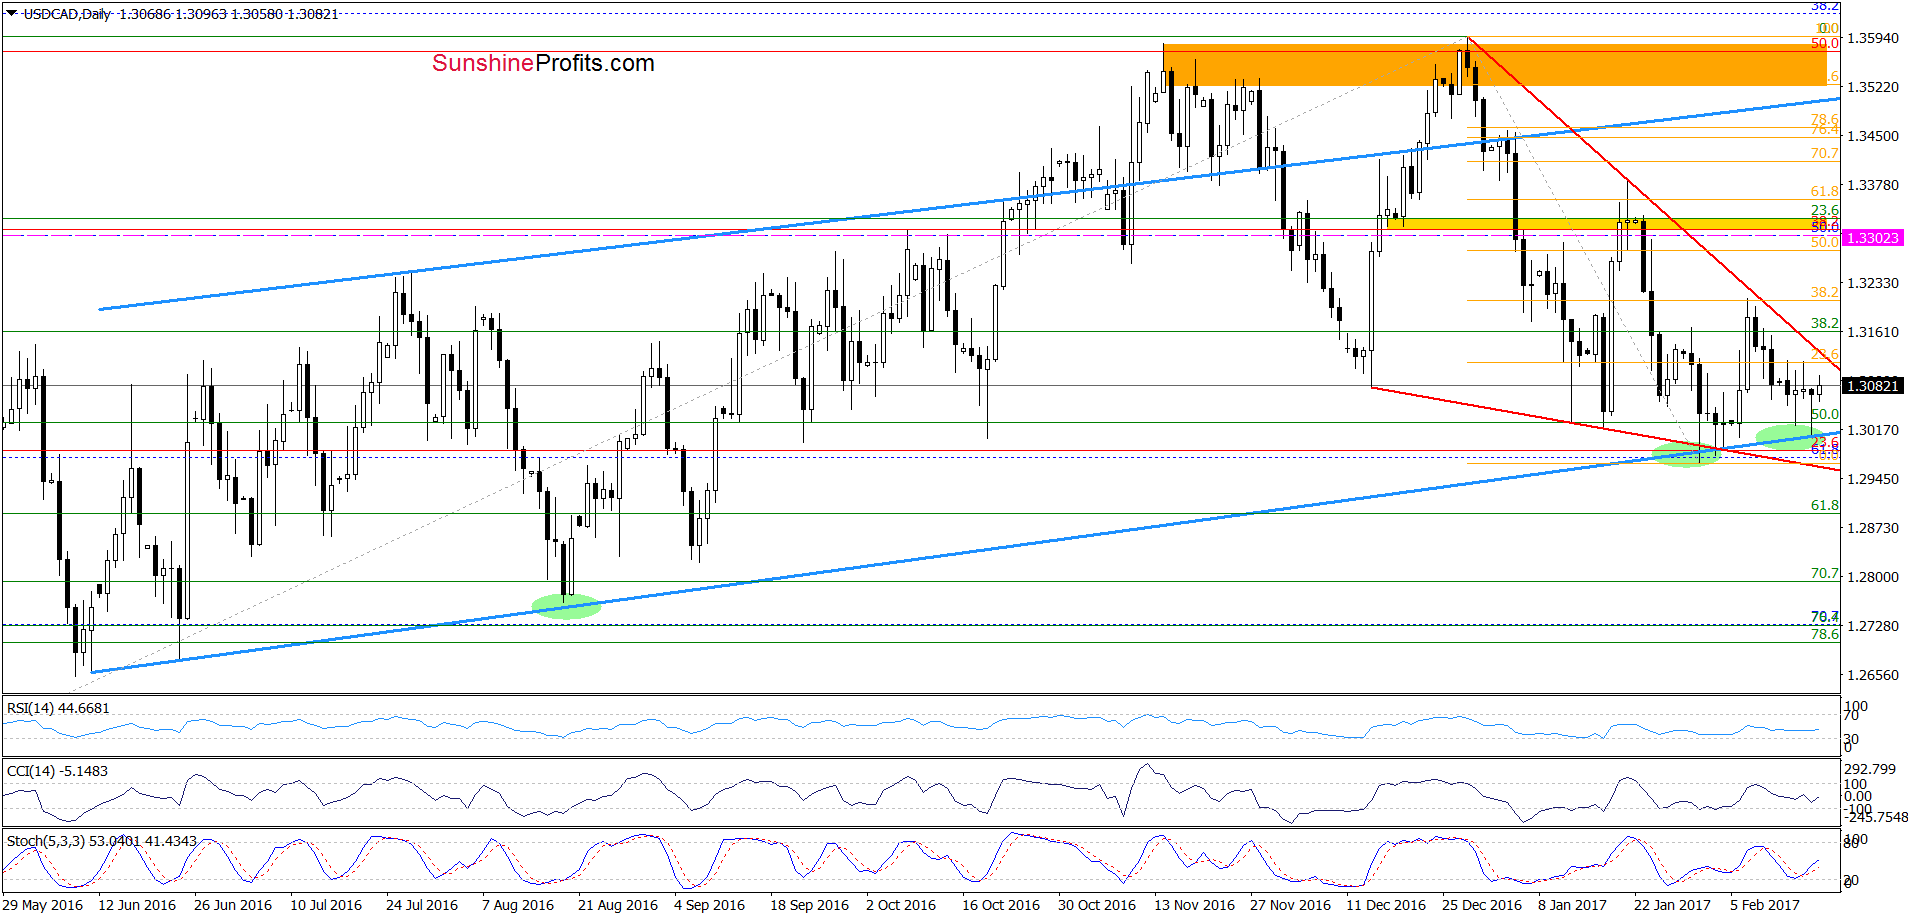
From today’s point of view, we see that although USD/CAD moved lower yesterday, the long-term blue support line stopped currency bears once again, triggering a rebound. On the daily chart, we see that there were similar situations in the past. In both previous cases, such price action translated into an upward move. Taking this fact into account and the buy signal generated by the Stochastic Oscillator we think that the pair will extend gains in the coming week. If this is the case, the exchange rate will (at least) test the last week’s high.
Very short-term outlook: bullish
Short-term outlook: mixed with bullish bias
MT outlook: mixed
LT outlook: mixed
Trading position (short-term; our opinion): Long positions (with a stop-loss order at 1.2949 and the initial upside target at 1.3302) are justified from the risk/reward perspective. We will keep you informed should anything change, or should we see a confirmation/invalidation of the above.
Thank you.
Nadia Simmons
Forex & Oil Trading Strategist
Przemyslaw Radomski, CFA
Founder, Editor-in-chief, Gold & Silver Fund Manager
Gold & Silver Trading Alerts
Forex Trading Alerts
Oil Investment Updates
Oil Trading Alerts

