

Earlier today, the greenback extended gains against the yen after a weekend meeting between U.S. President Donald Trump and Japanese Prime Minister Shinzo Abe. As a result, USD/JPY hit a fresh February high and broke above the upper border of the short-term declining trend channel. Will we see further improvement in near future?
In our opinion the following forex trading positions are justified - summary:
- EUR/USD: short (a stop-loss order at 1.0957; the initial downside target at 1.0538)
- GBP/USD: none
- USD/JPY: none
- USD/CAD: long (a stop-loss order at 1.2949; the initial upside target at 1.3302)
- USD/CHF: long (a stop-loss order at 0.9879; the initial upside target at 1.0064)
- AUD/USD: short (a stop-loss order at 0.7723; the initial downside target at 0.7520)
EUR/USD
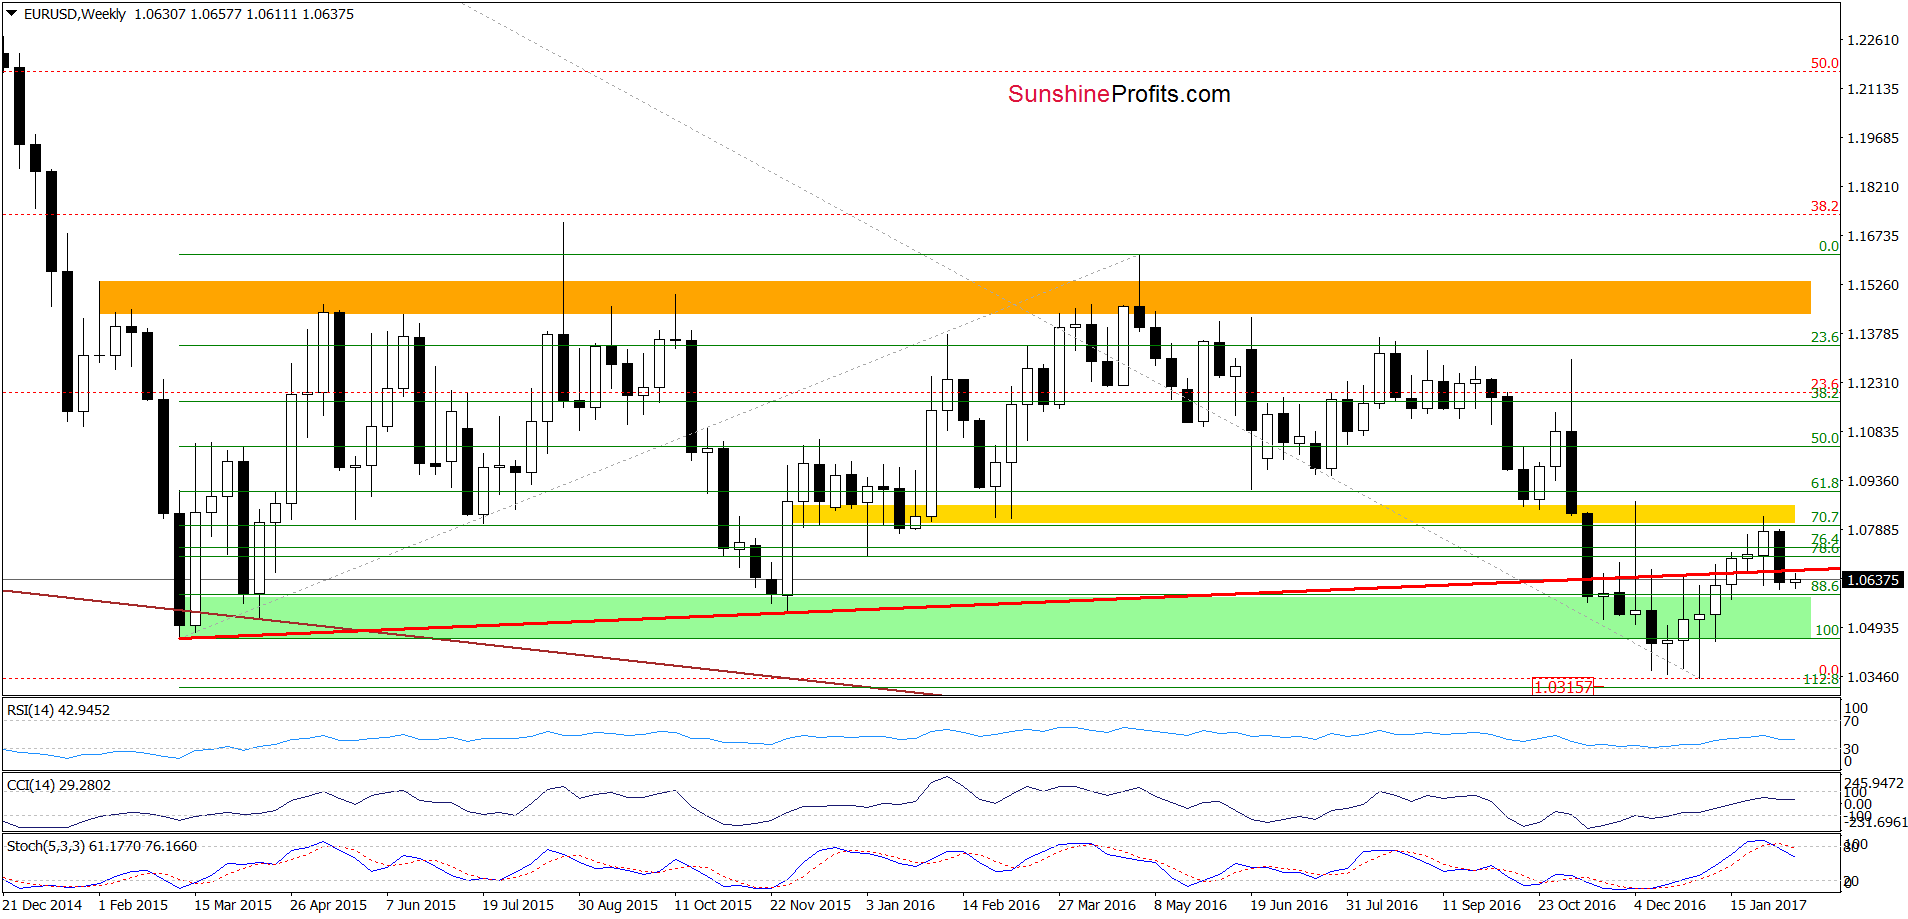
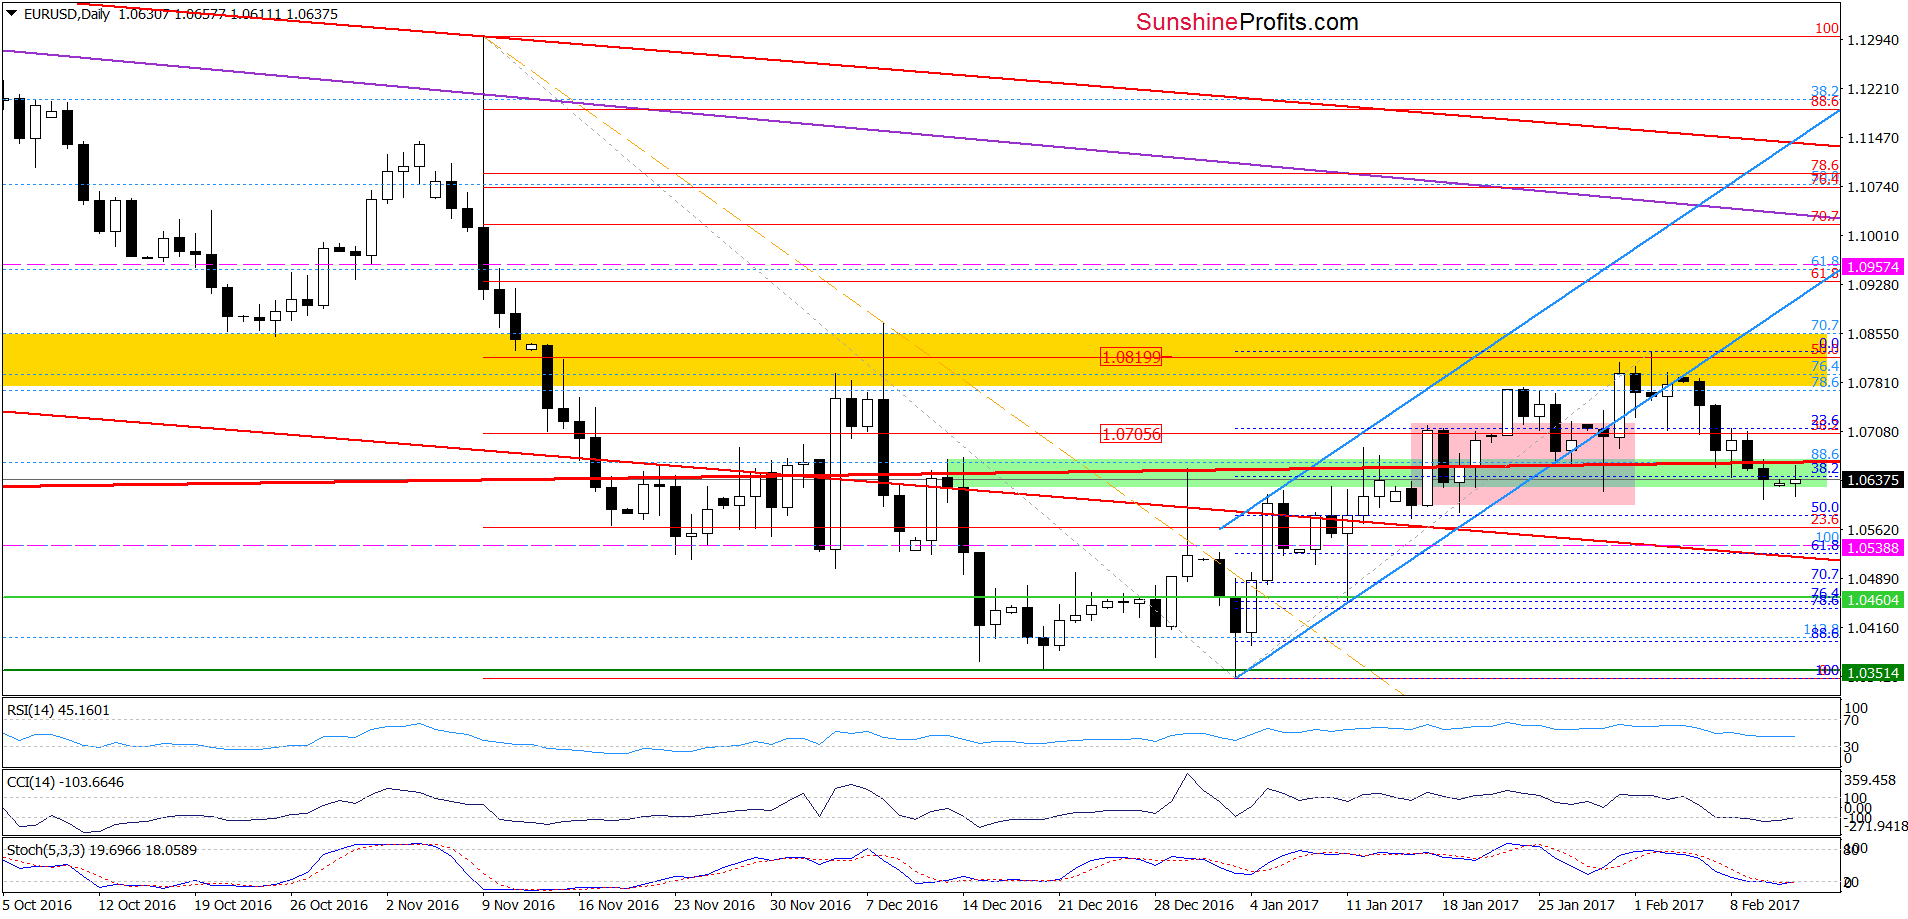
Looking at the charts, we see that EUR/USD closed the previous week below the long-term red support line (seen more clearly on the weekly chart), invalidating the earlier breakout. Additionally, earlier today the exchange rate moved a bit higher, but then gave up the gains, which looks like a verification of the breakdown under the above-mentioned red line. If this is the case, the pair will likely extend losses and test the January 19 low of 1.0588. If this support is broken, the next target for currency bears will be the 61.8% Fibonacci retracement based on the January-February upward move around 1.0526.
Very short-term outlook: bearish
Short-term outlook: mixed with bearish bias
MT outlook: mixed
LT outlook: mixed
Trading position (short-term; our opinion): Short positions (with a stop-loss order at 1.0957 and the initial downside target at 1.0538) are justified from the risk/reward perspective. We will keep you informed should anything change, or should we see a confirmation/invalidation of the above.
USD/JPY
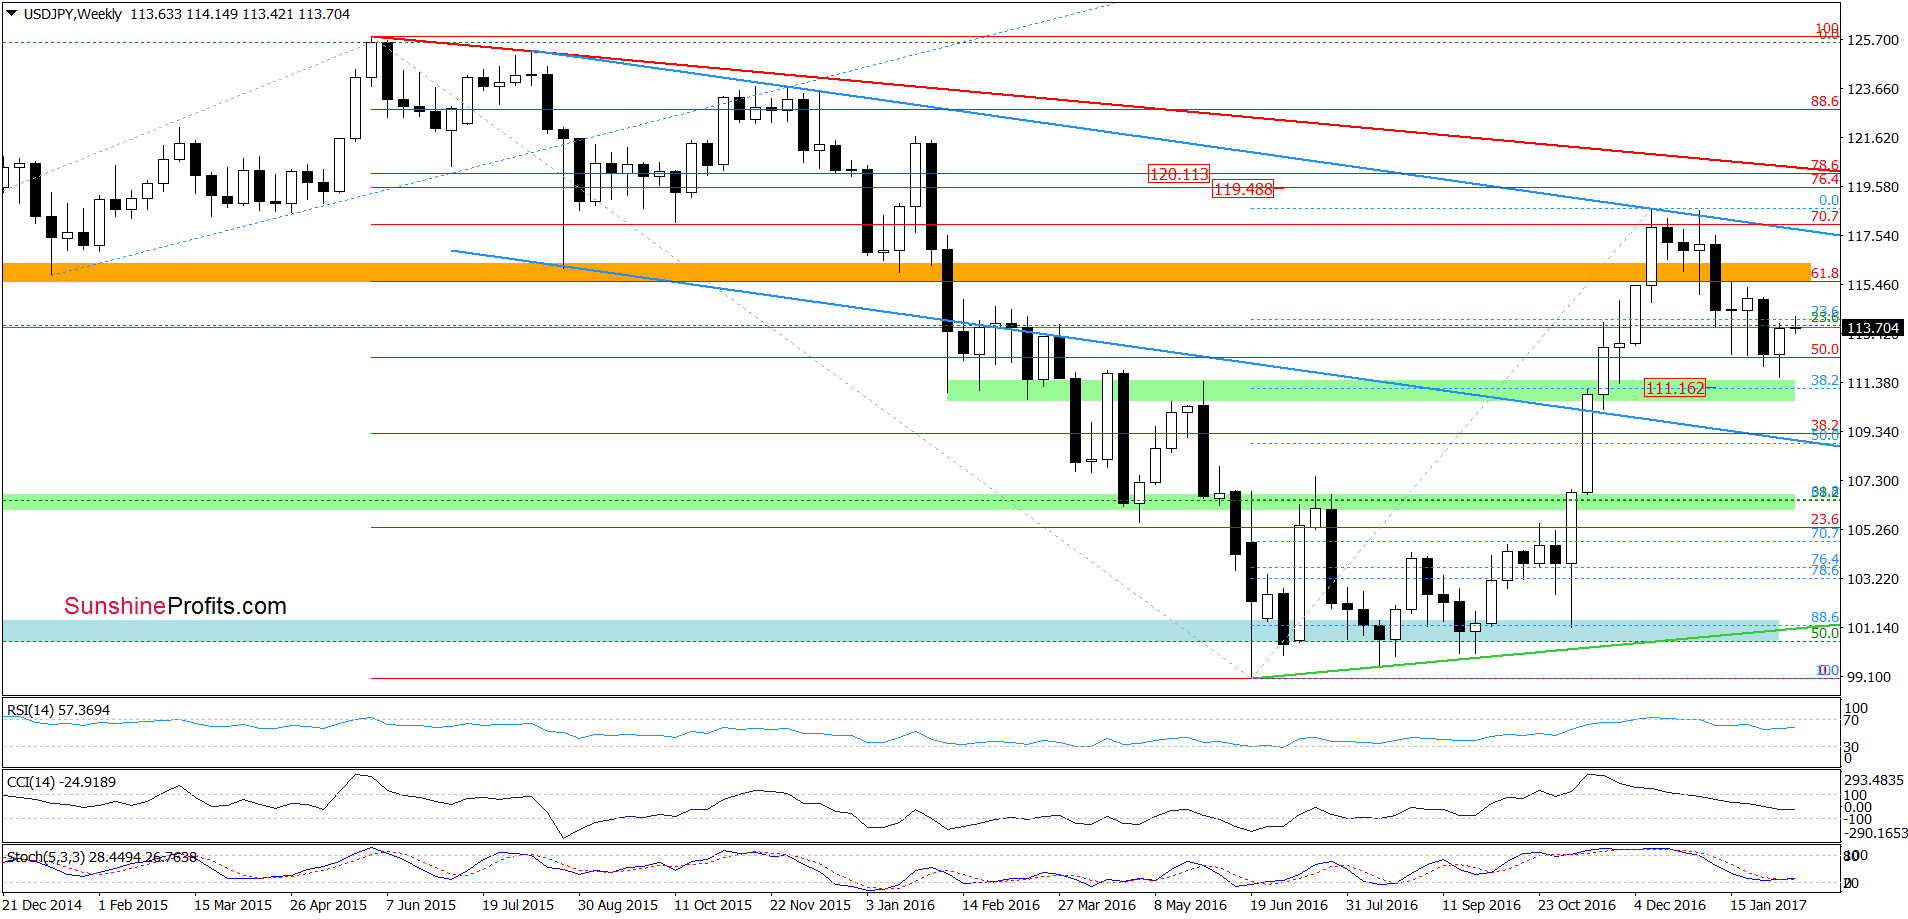
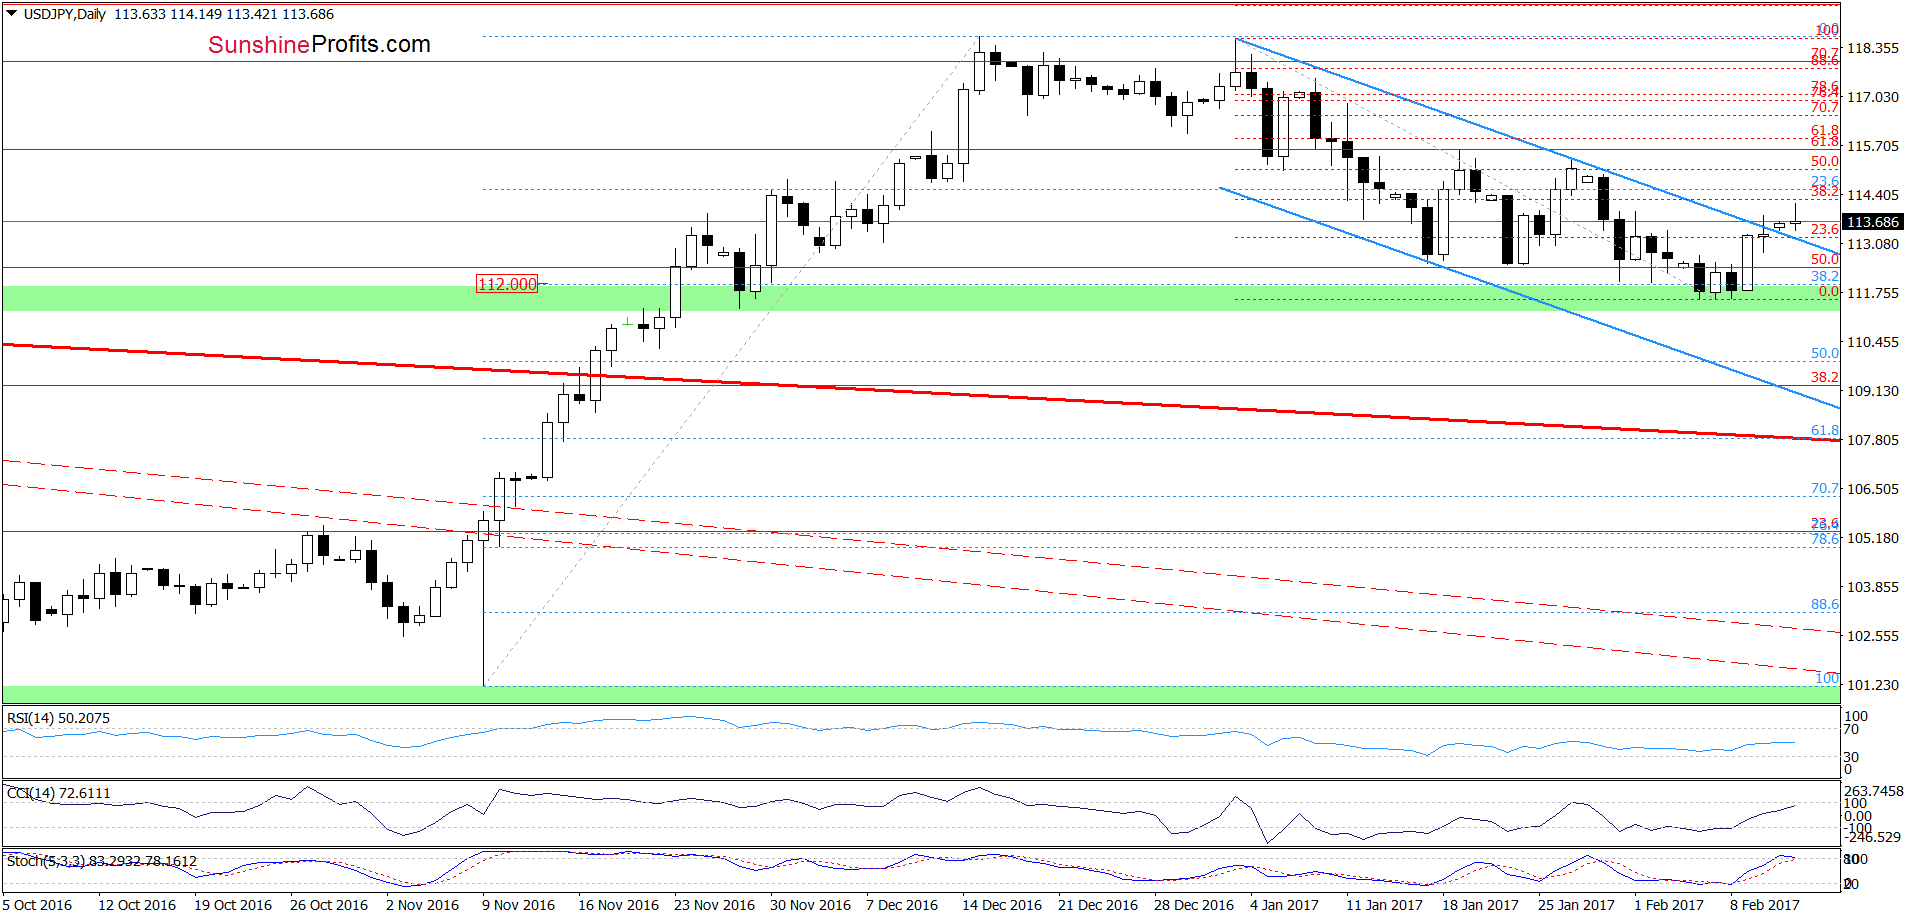
From today’s point of view, we see that USD/JPY extended gains and climbed above the upper border of the blue declining trend channel. Although this is a positive sign, which suggests further improvement, we think that it will be more reliable if the exchange rate closes today’s session above the blue line. In this case, we’ll see an increase to at least 115.36-115.60, where the January 19 and 27 highs are.
Very short-term outlook: mixed with bullish bias
Short-term outlook: mixed
MT outlook: mixed
LT outlook: mixed
Trading position (short-term; our opinion): No positions are justified from the risk/reward perspective. However, if USD/JPY closes today’s session above the upper border of the declining trend channel, we’ll consider opening short positions. We will keep you informed should anything change, or should we see a confirmation/invalidation of the above.
USD/CAD
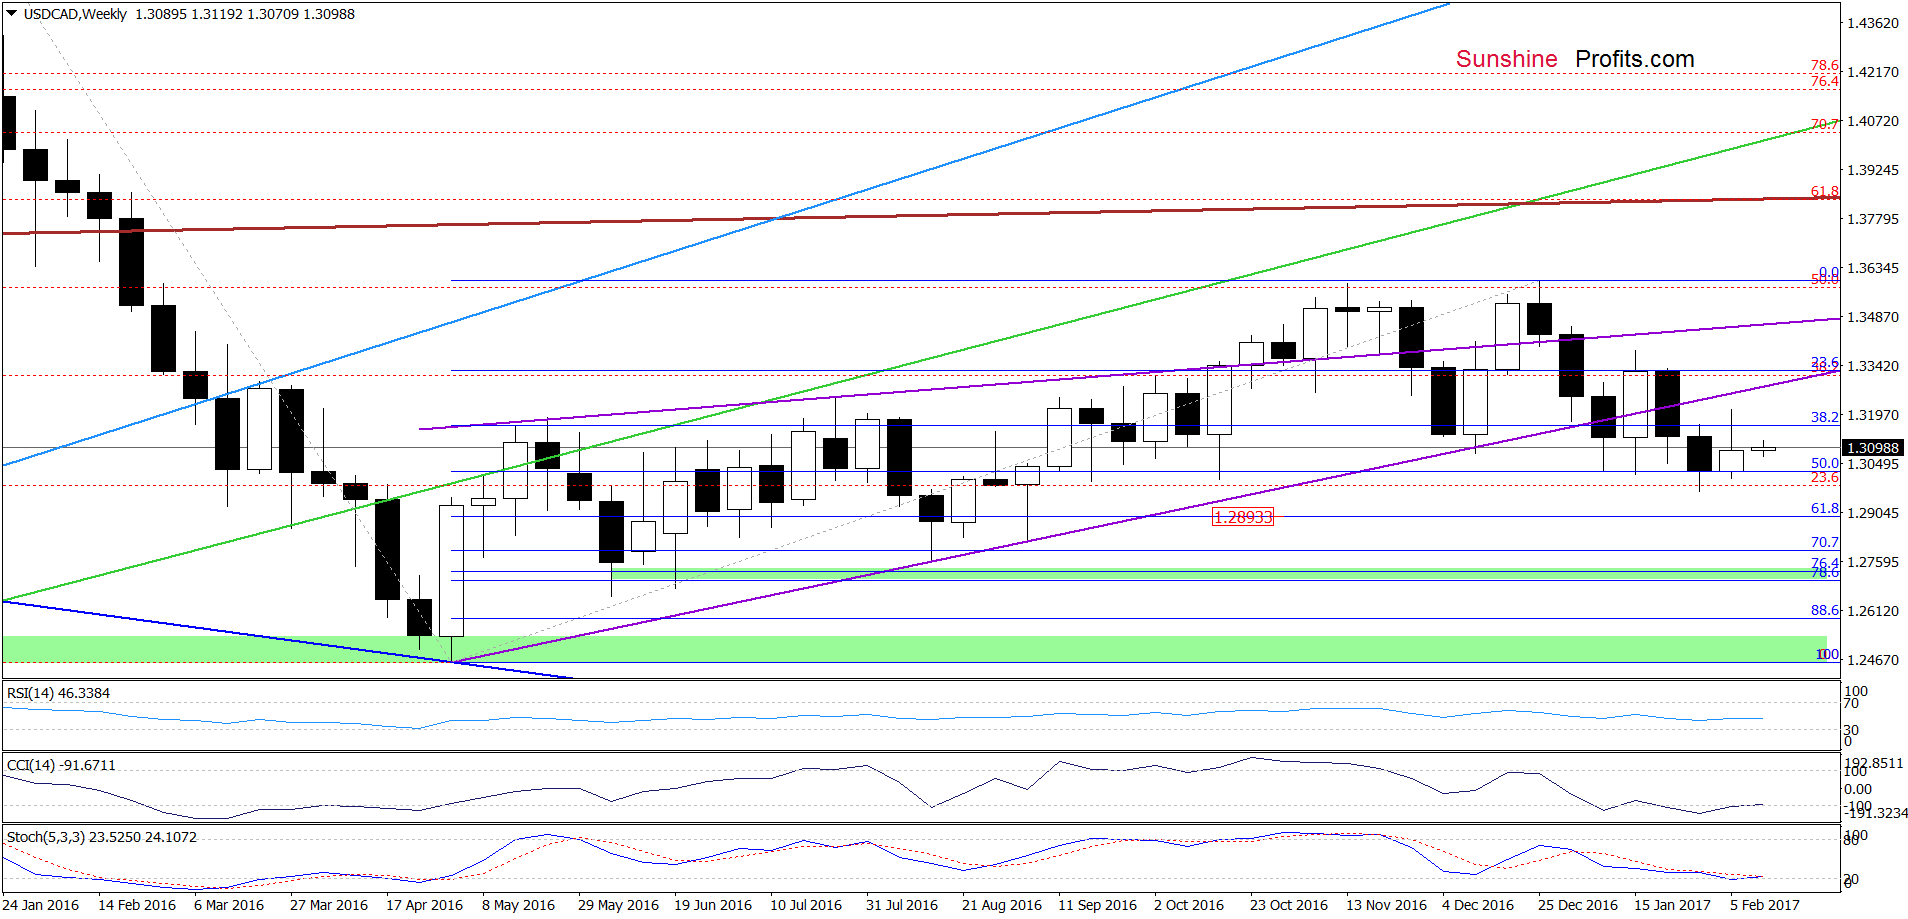
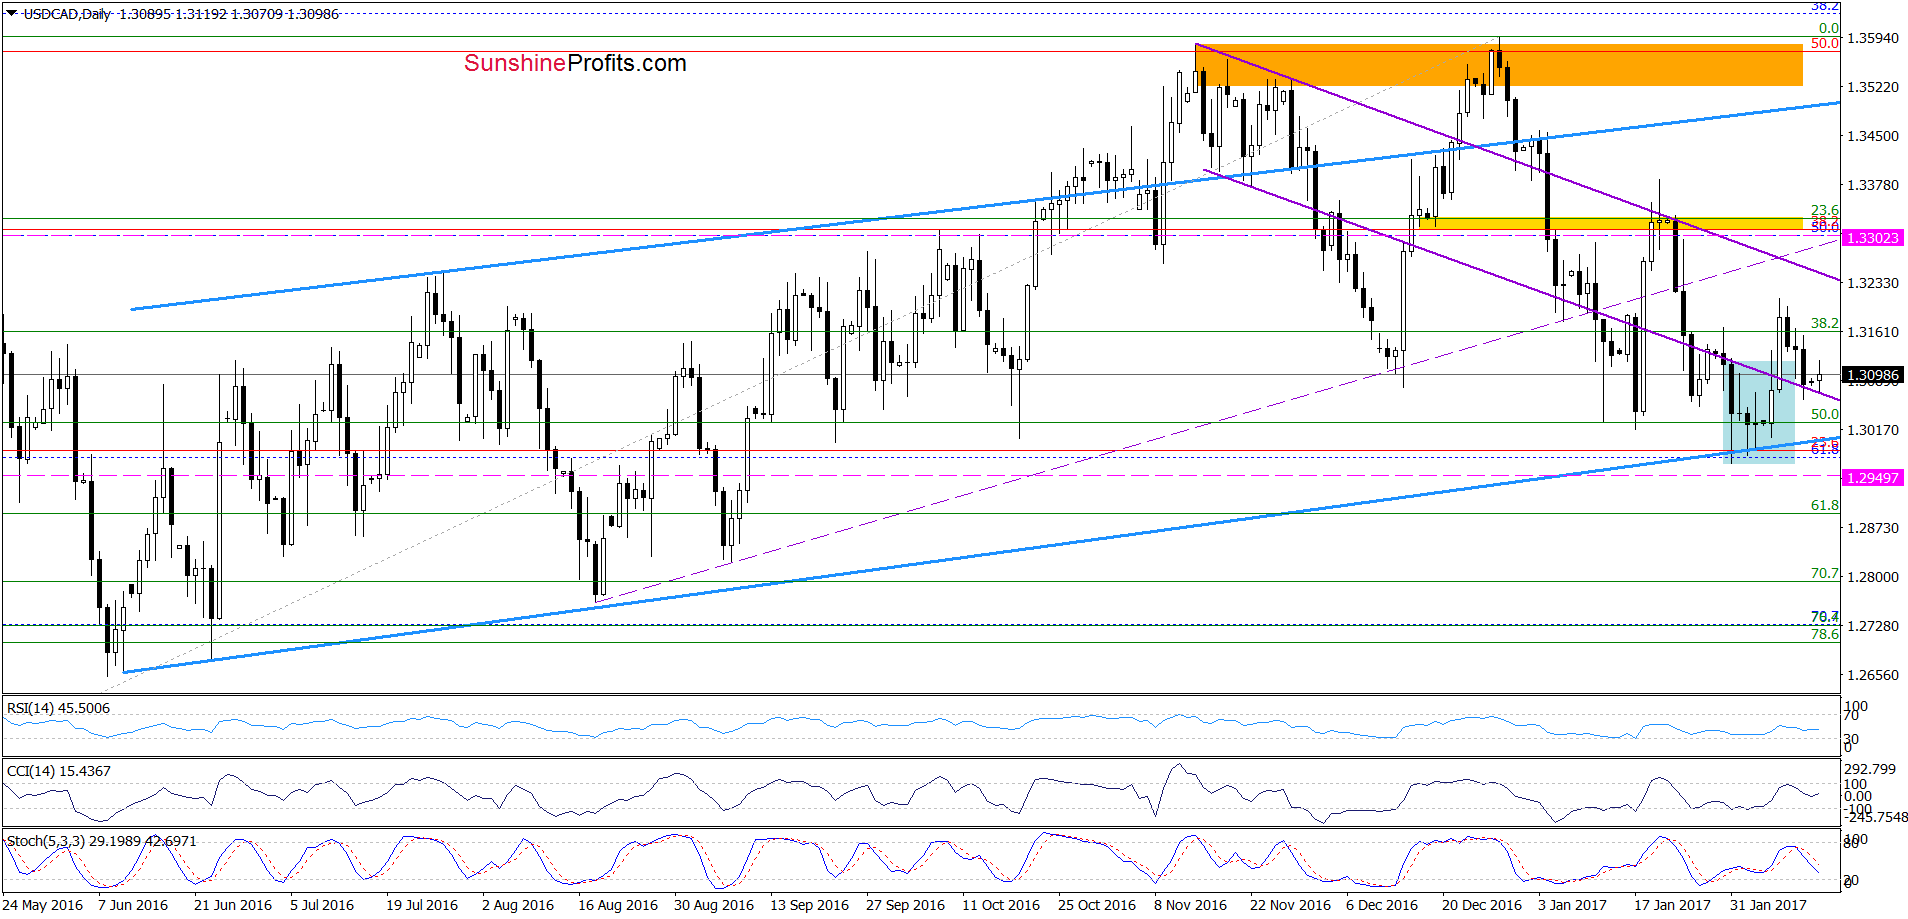
Looking at the daily chart, we see that USD/CAD moved lower at the end of the previous week and corrected Tuesday’s sharp increase. With this decline the exchange slipped to the previously-broken lower border of the purple declining trend channel, which looks like a verification of the earlier breakout. If this is the case, the exchange rate will likely rebound and test not only last week’s high, but also the upper border of the purple trend channel. If this resistance is broken, the next upside target will be the yellow resistance zone and the January 20 high of 1.3385.
Very short-term outlook: bullish
Short-term outlook: mixed with bullish bias
MT outlook: mixed
LT outlook: mixed
Trading position (short-term; our opinion): Long positions (with a stop-loss order at 1.2949 and the initial upside target at 1.3302) are justified from the risk/reward perspective. We will keep you informed should anything change, or should we see a confirmation/invalidation of the above.
AUD/USD
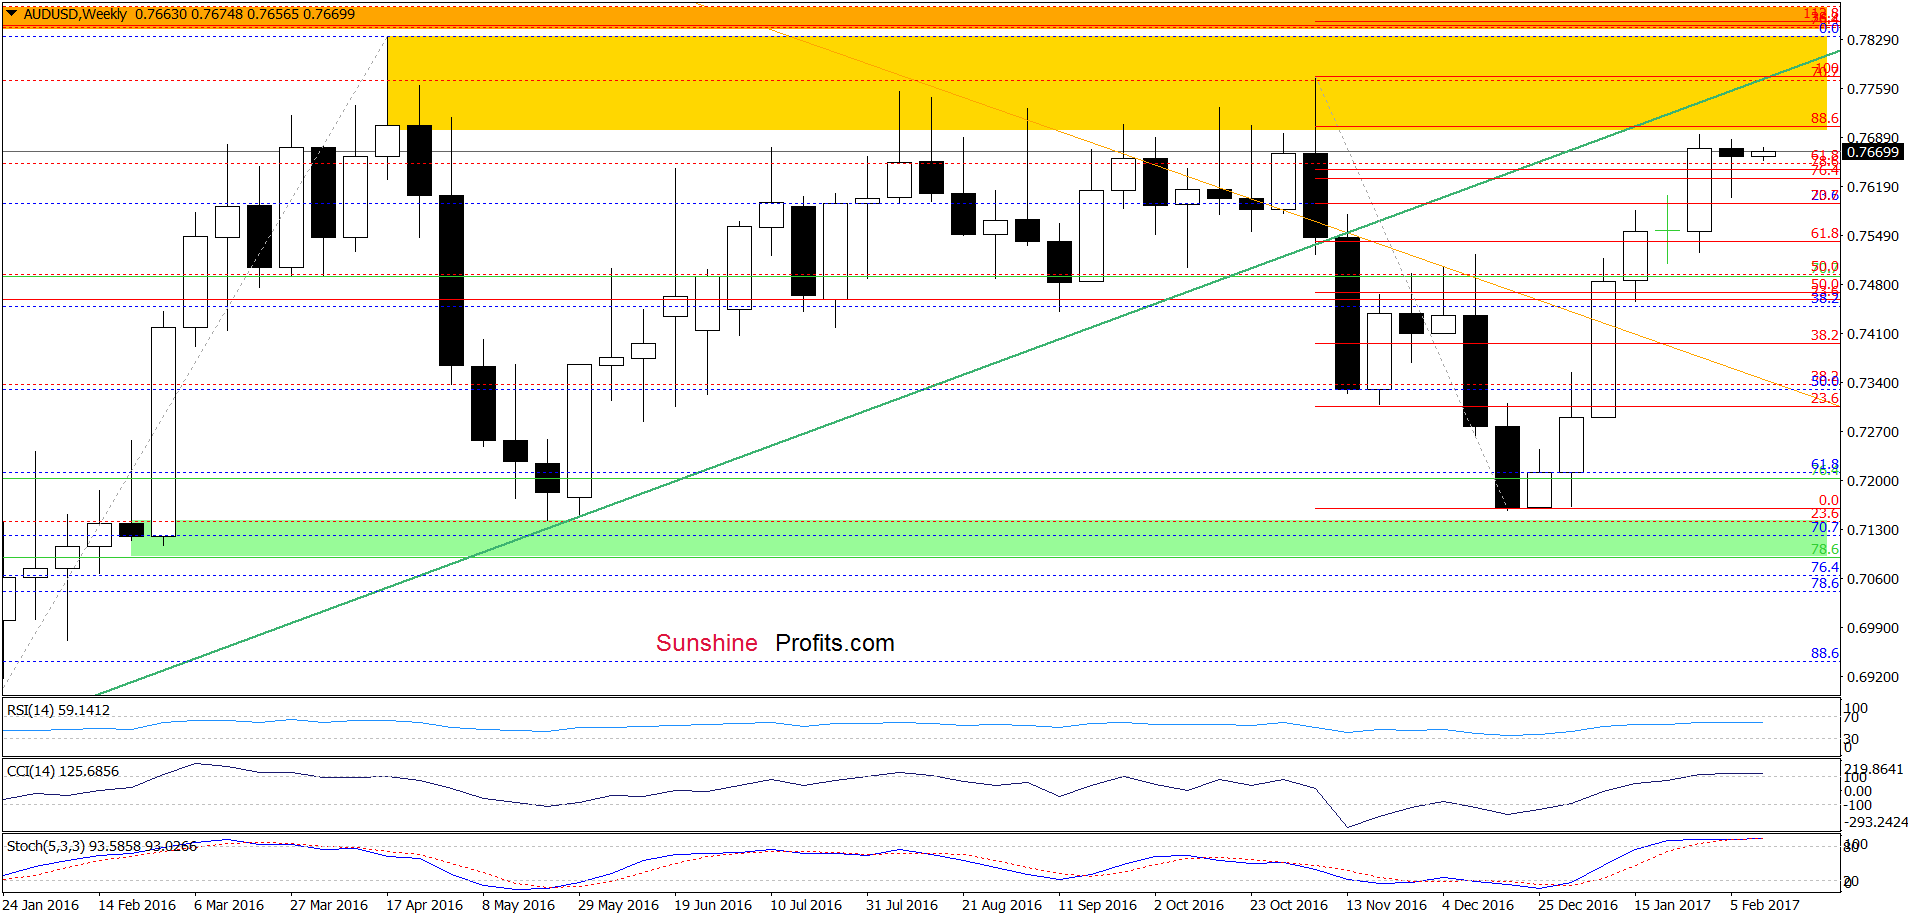
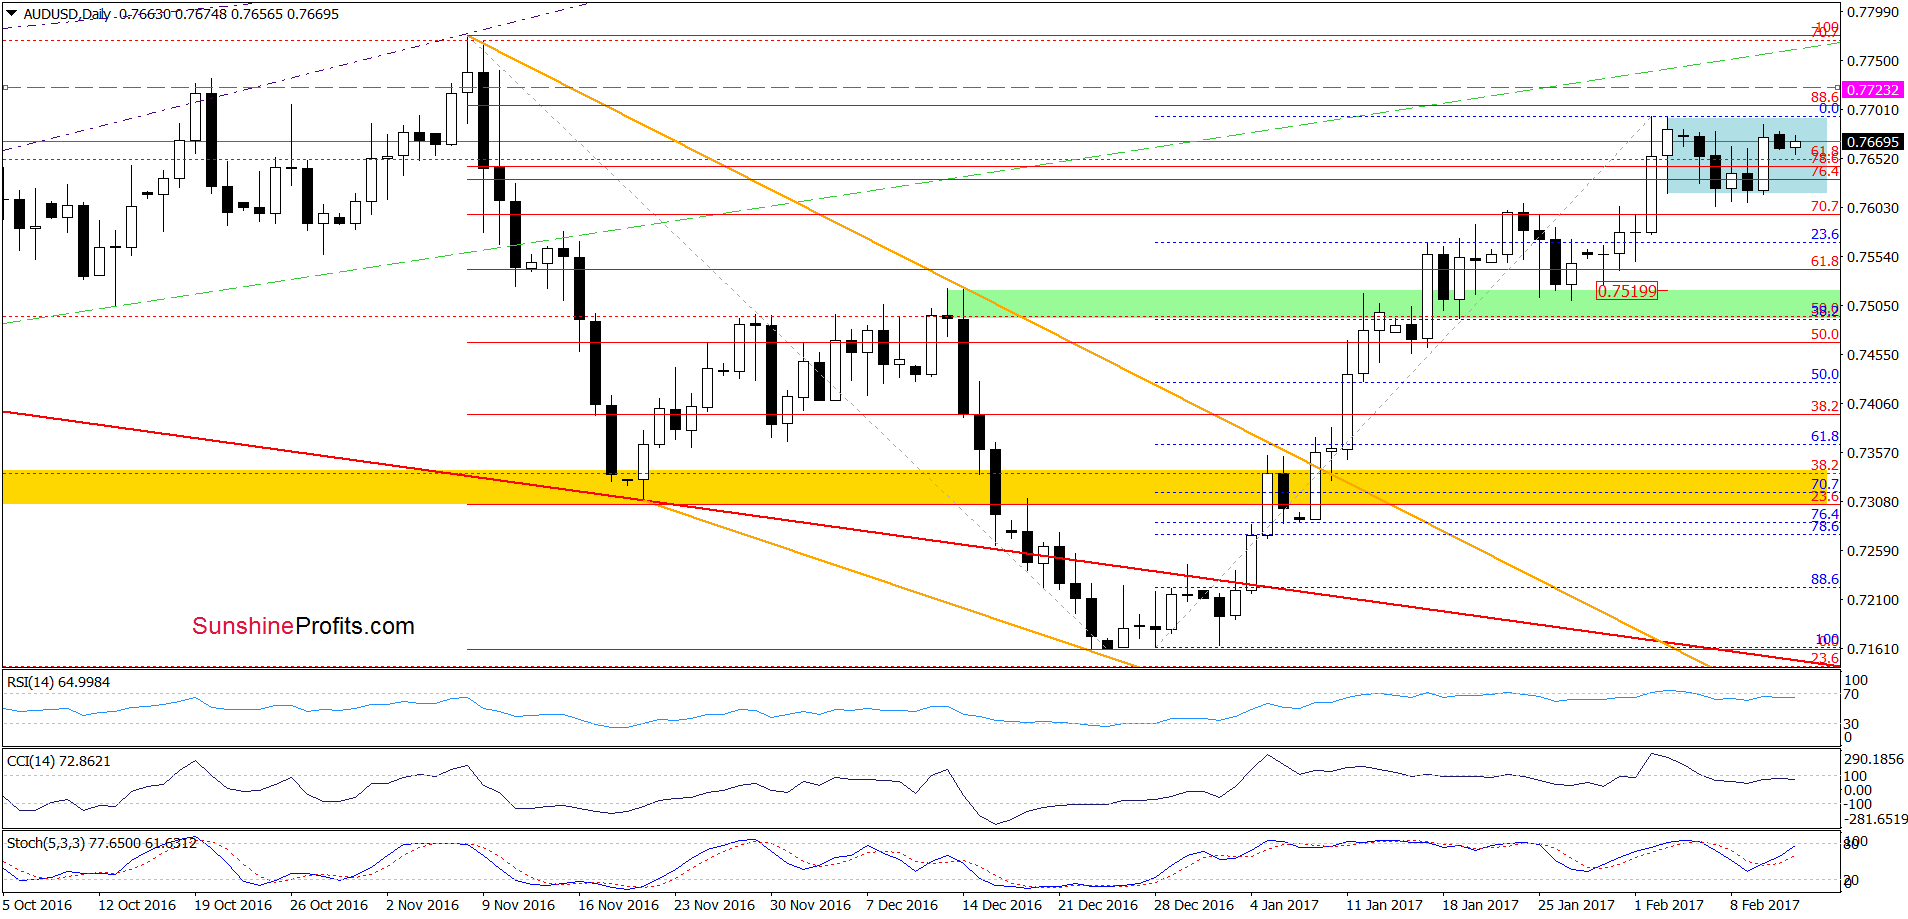
Looking at the daily chart, we see that although AUD/USD moved higher on Friday, the overall situation hasn’t changed much as the exchange rate is still trading in the blue consolidation. On the weekly chart, we see that slightly above the consolidation is the yellow resistance zone, which successfully stopped currency bulls several times in the previous months. Additionally, the weekly indicators are overbought and very close to generating sell signals, which increases the probability of another move to the downside in the coming days/weeks. If this is the case and AUD/USD declines under the lower border of the blue consolidation once again, we’ll see a decline to the green support zone seen on the daily chart (around 0.7520) in the following days.
Very short-term outlook: bearish
Short-term outlook: mixed with bearish bias
MT outlook: mixed
LT outlook: mixed
Trading position (short-term; our opinion): Short positions (with a stop-loss order at 0.7723 and the initial downside target at 0.7520) are justified from the risk/reward perspective. We will keep you informed should anything change, or should we see a confirmation/invalidation of the above.
As a reminder – “initial target price” means exactly that – an “initial” one, it’s not a price level at which we suggest closing positions. If this becomes the case (like it did in the previous trade) we will refer to these levels as levels of exit orders (exactly as we’ve done previously). Stop-loss levels, however, are naturally not “initial”, but something that, in our opinion, might be entered as an order.
Thank you.
Nadia Simmons
Forex & Oil Trading Strategist
Przemyslaw Radomski, CFA
Founder, Editor-in-chief, Gold & Silver Fund Manager
Gold & Silver Trading Alerts
Forex Trading Alerts
Oil Investment Updates
Oil Trading Alerts

