

Although the euro bounced off the long-term support line yesterday, currency bears didn’t give up and pushed EUR/USD lower once again. Will we see a breakdown and a drop below 1.0600 in the coming days?
In our opinion the following forex trading positions are justified - summary:
- EUR/USD: short (a stop-loss order at 1.0957; the initial downside target at 1.0538)
- GBP/USD: short (a stop-loss order at 1.2543; the initial downside target at 1.2260)
- USD/JPY: none
- USD/CAD: long (a stop-loss order at 1.3055; the initial upside target at 1.3302)
- USD/CHF: long (a stop-loss order at 0.9879; the initial upside target at 1.0064)
- AUD/USD: short (a stop-loss order at 0.7723; the initial downside target at 0.7520)
EUR/USD
Quoting our yesterday’s alert:
(…) EUR/USD reached our first downside target earlier today. Although this support could trigger a small rebound from here, the sell signals generated by the indicators are still in play, supporting currency bears and further deterioration.
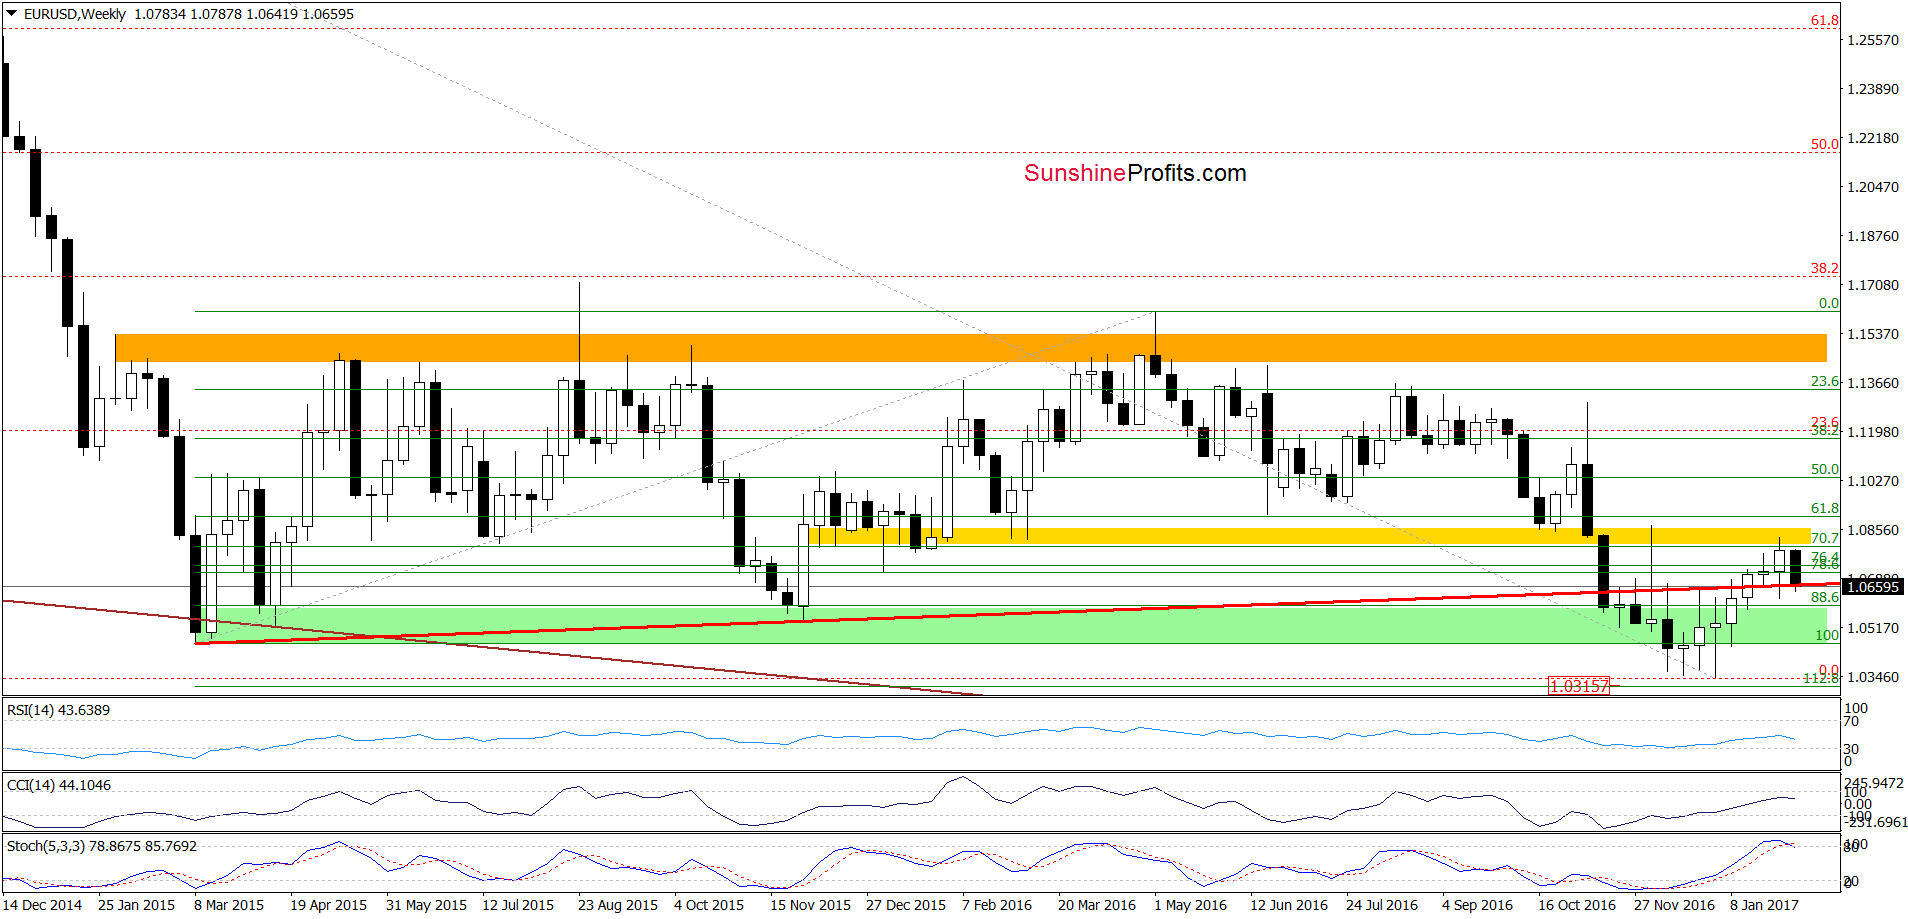
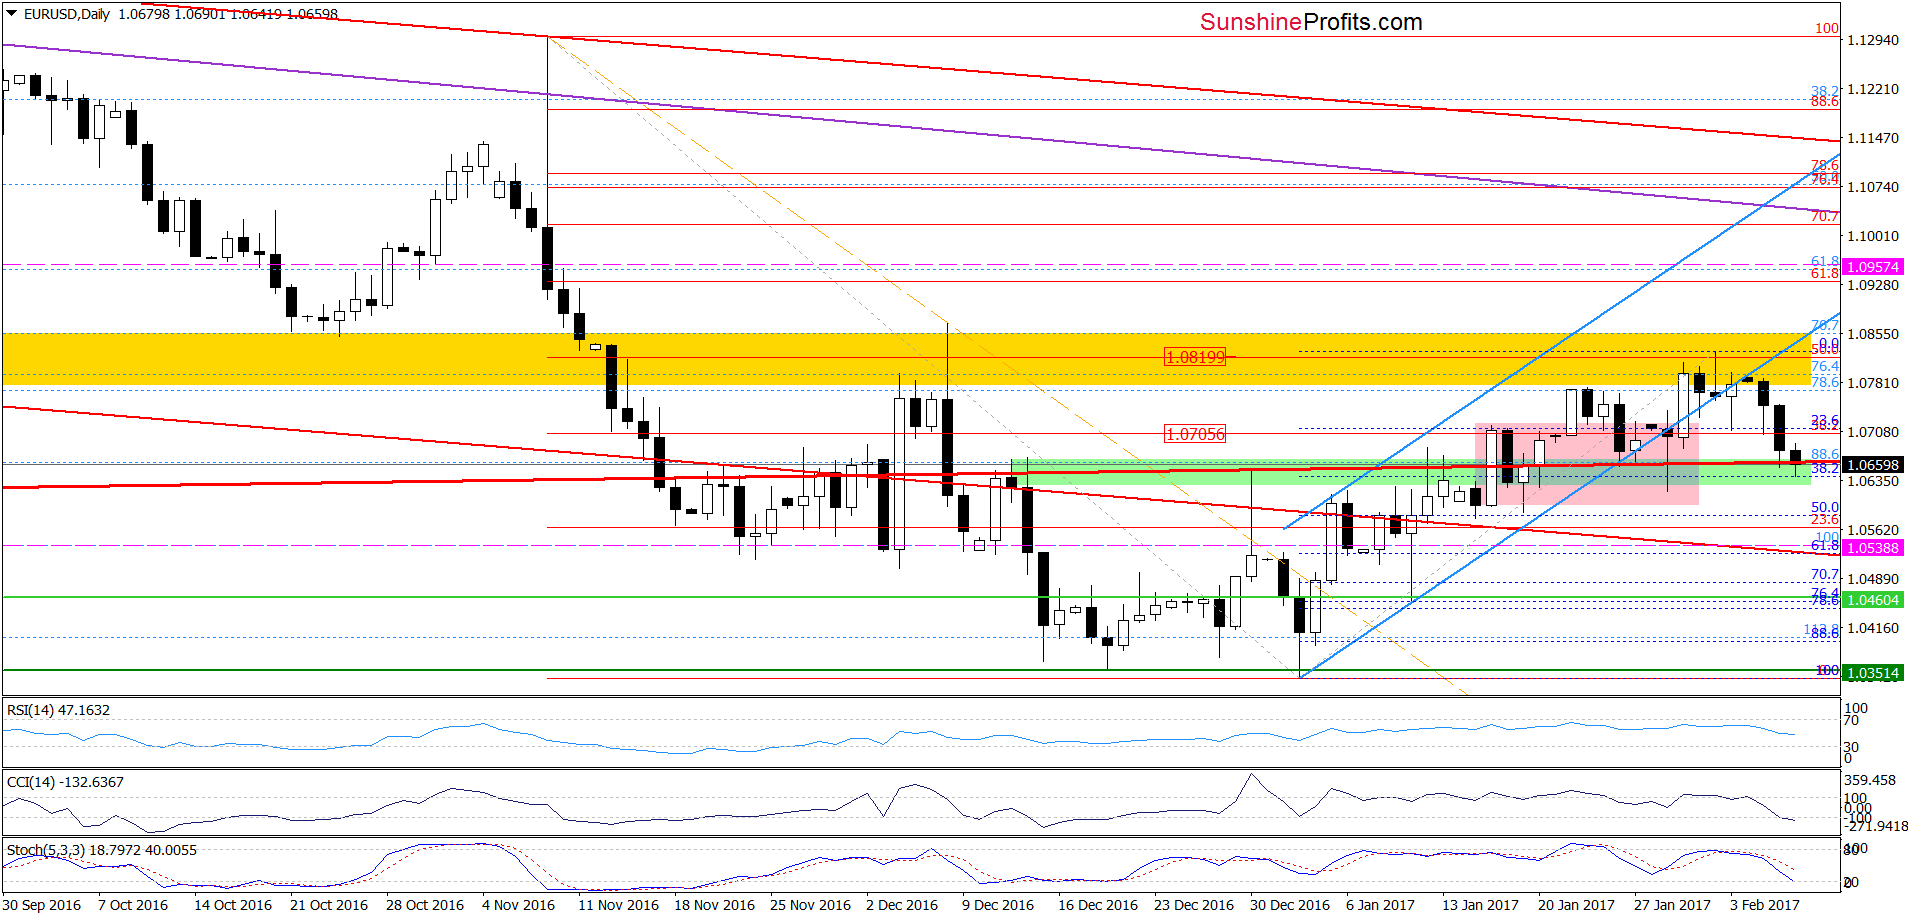
From today’s point of view, we see that the situation developed in line with the above scenario and EUR/USD moved a bit higher after a drop to the green support zone. Despite this tiny rebound, currency bears pushed the exchange rate lower once again earlier today, which means that what we wrote yesterday remains up-to-date:
If (…) the pair drops under the long-term red support line (seen more clearly on the weekly chart), we’ll see (at least) a test of the lower border of the pink consolidation and the January 19 low of 1.0588 in the following days.
(…) please keep in mind what we wrote (…) about the long-term picture of EUR/USD:
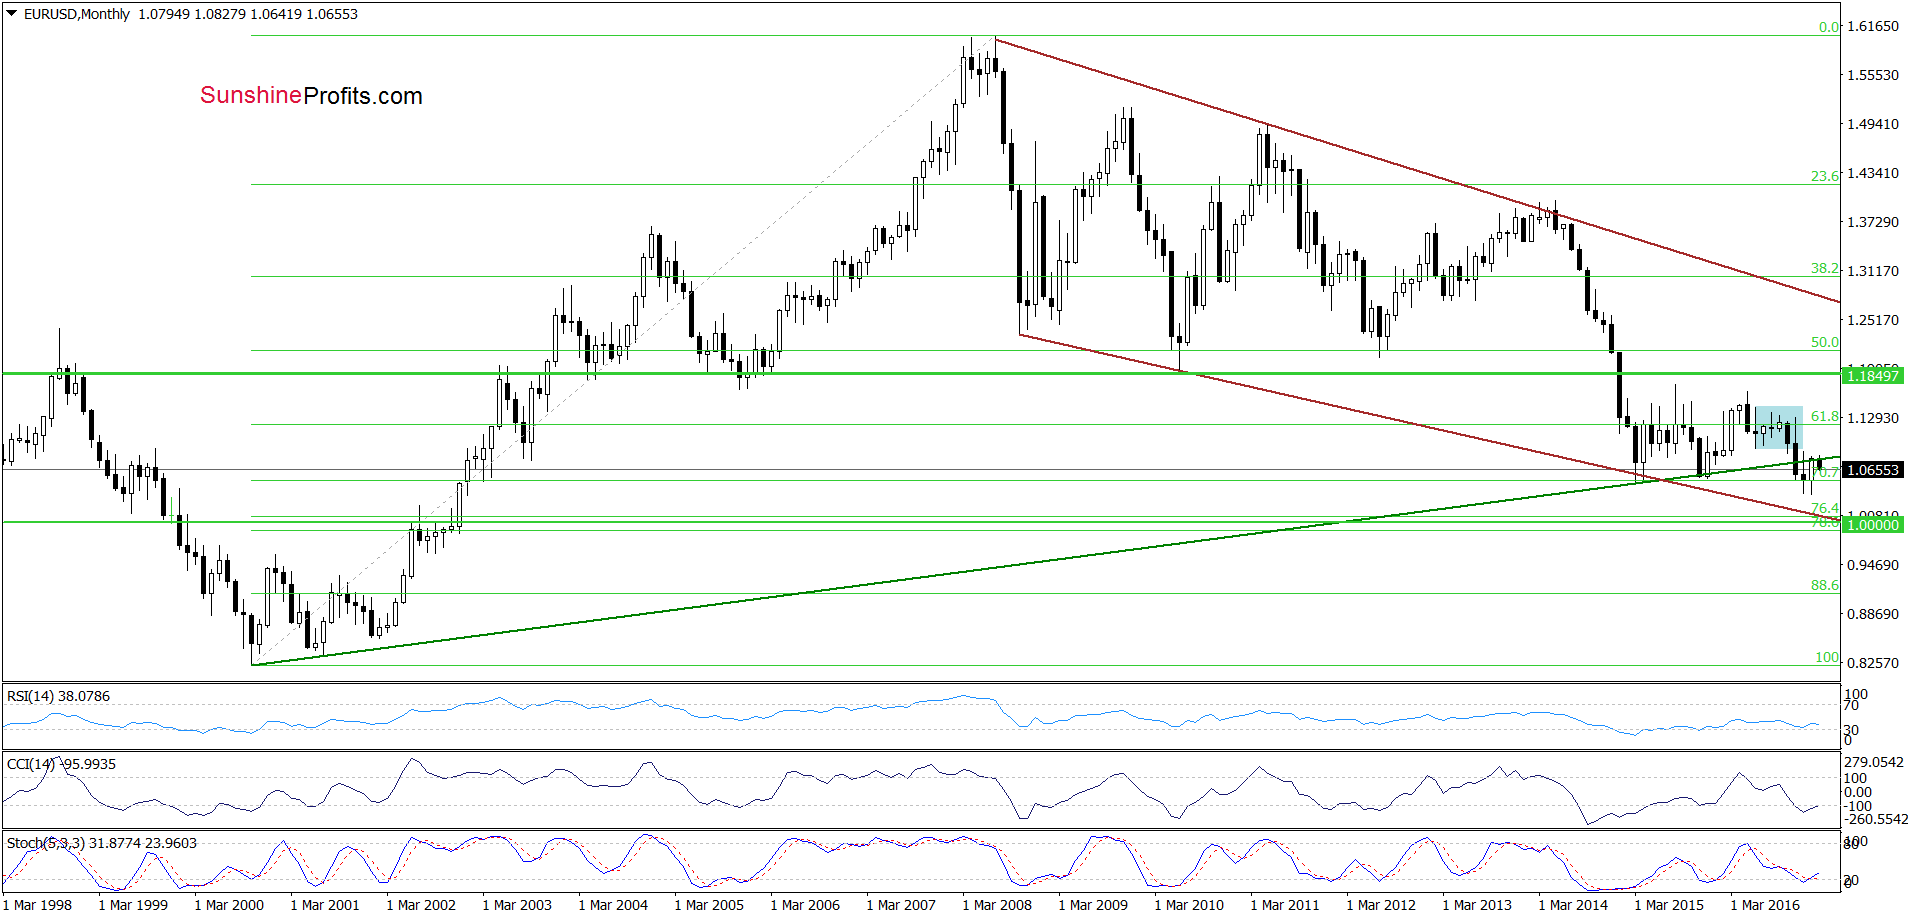
(…) the exchange rate climbed in the previous month to the previously-broken long-term green line, which serves as the key resistance at the moment. Although currency bulls tried to push EUR/USD higher earlier this month, they failed, which resulted in a pullback. This action looks like a verification of the earlier breakdown under this important line, suggesting lover values of the exchange rate in the coming days/weeks.
Very short-term outlook: bearish
Short-term outlook: bearish
MT outlook: mixed
LT outlook: mixed
Trading position (short-term; our opinion): Short positions (with a stop-loss order at 1.0957 and the initial downside target at 1.0538) are justified from the risk/reward perspective. We will keep you informed should anything change, or should we see a confirmation/invalidation of the above.
USD/JPY
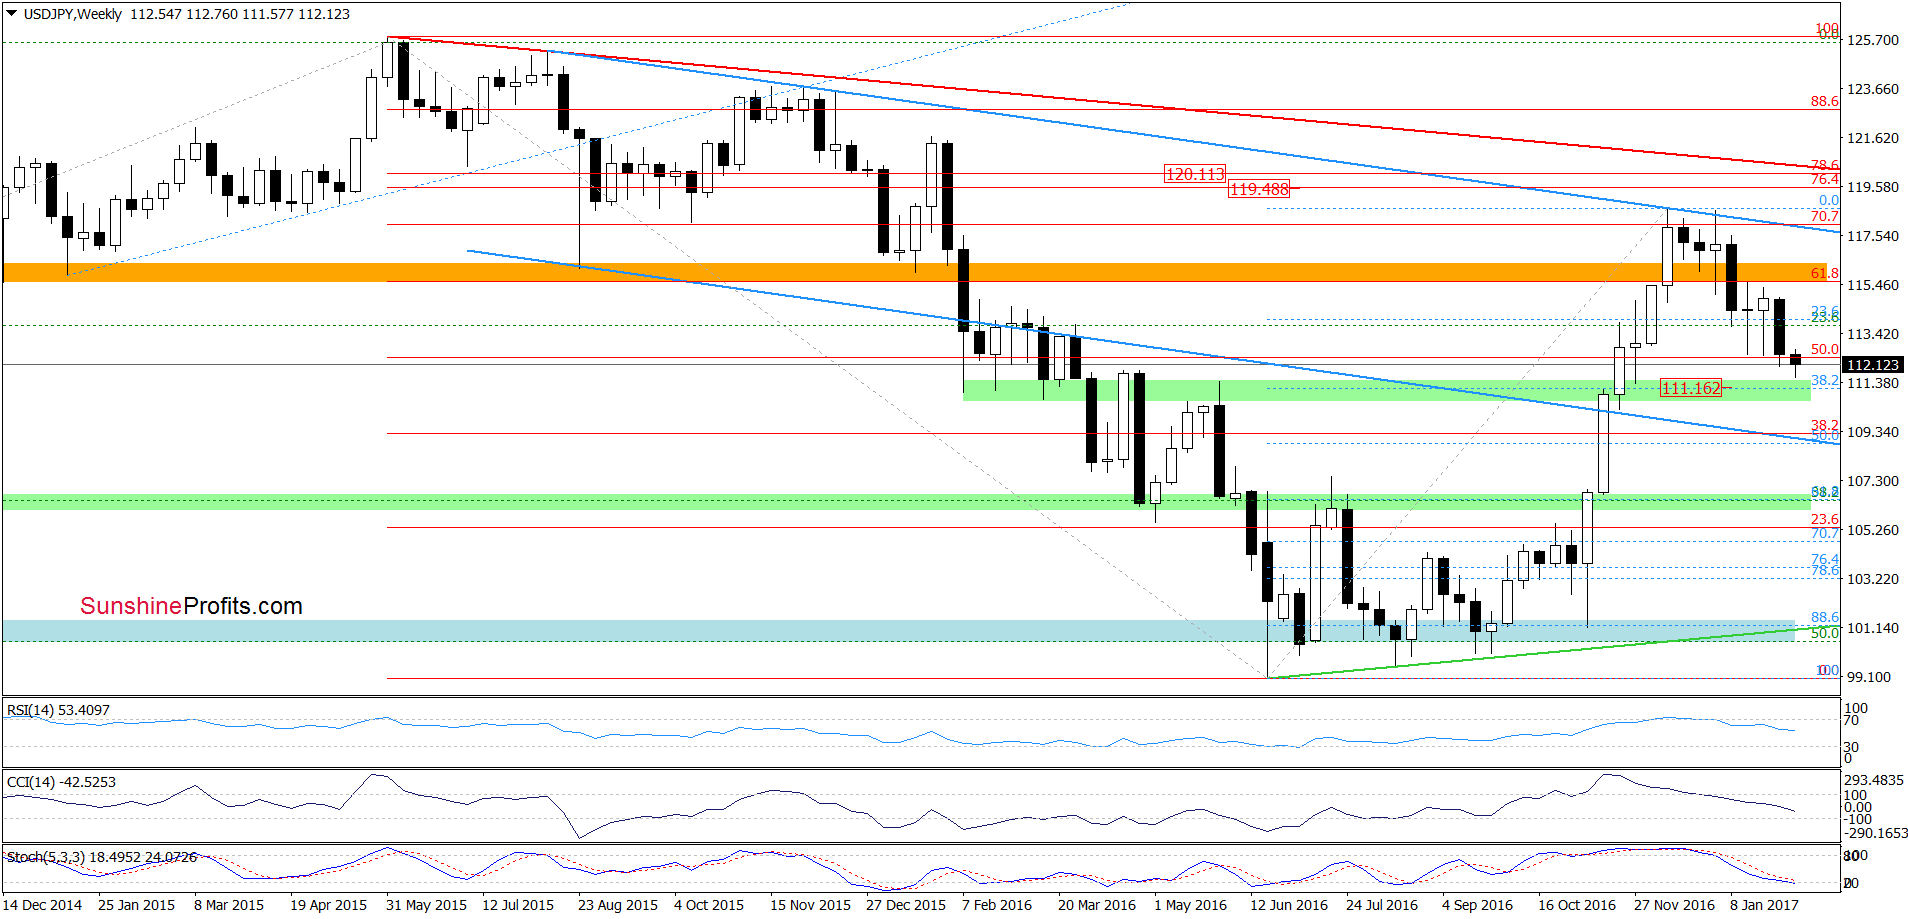
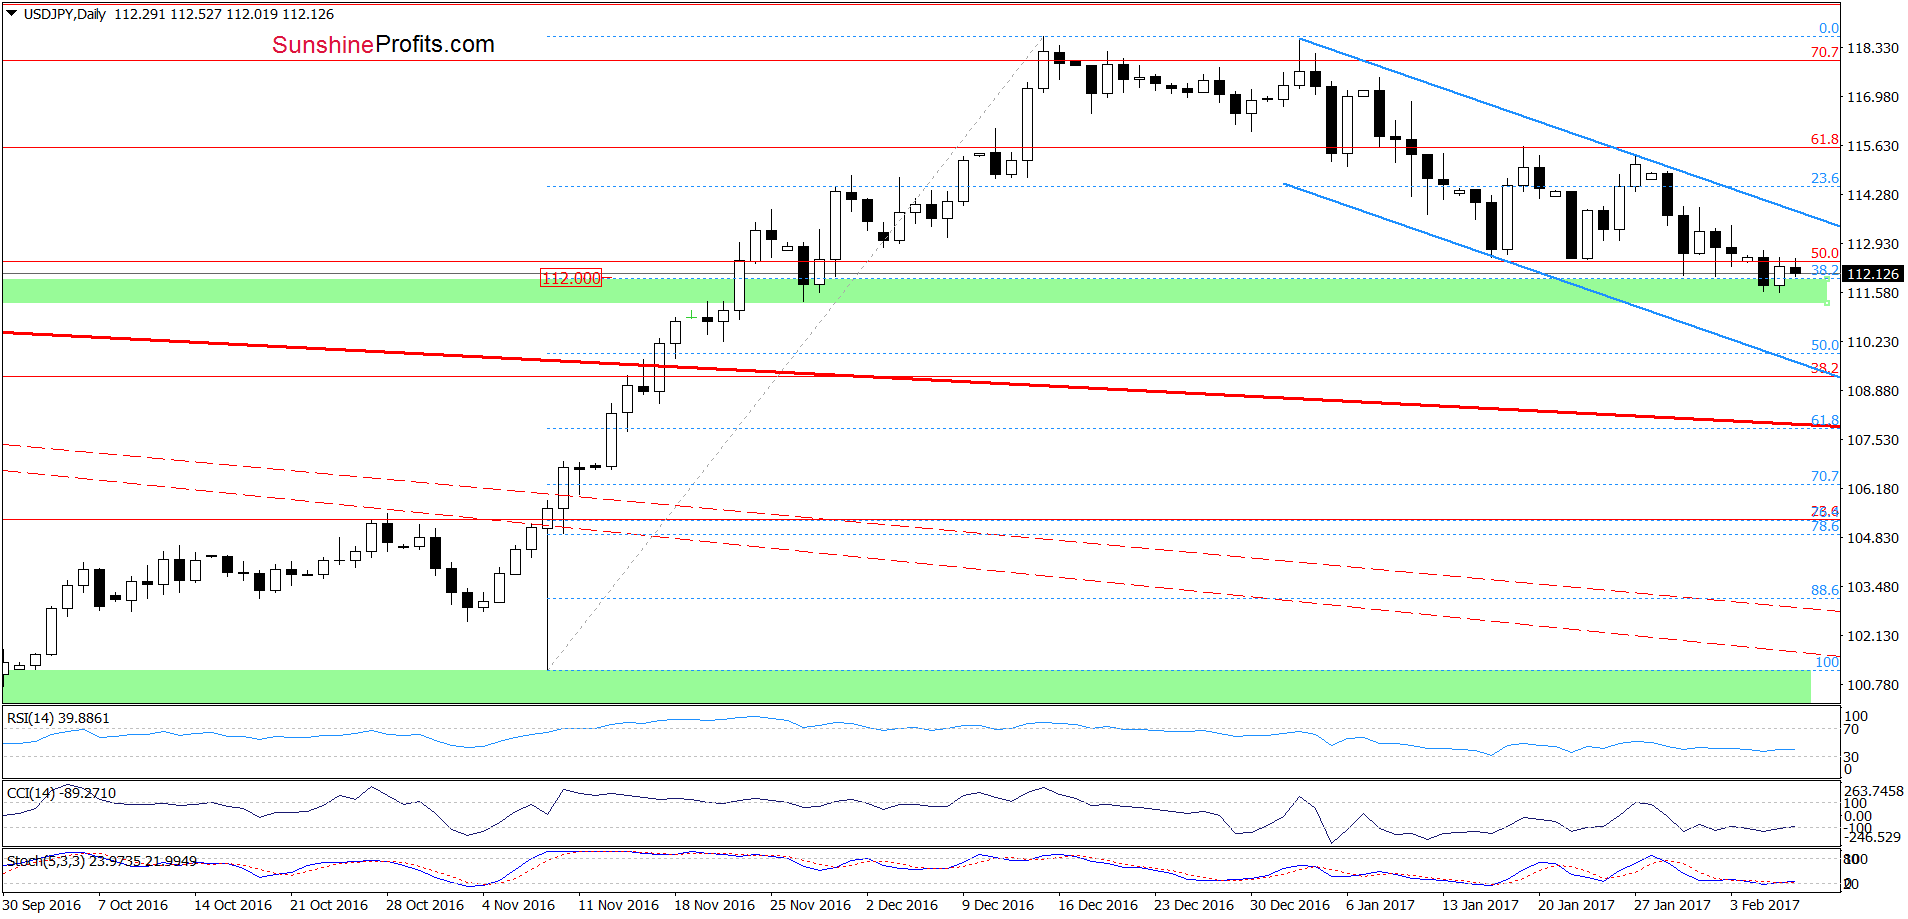
Looking at the daily chart, we see that although USD/JPY moved a bit lower earlier today, the 38.2% Fibonacci retracement based on the entire November-December upward and the green support zone continue to keep declines in check. This means that as long as there is no confirmed breakdown under this area another rebound and higher values of USD/JPY are likely.
Finishing today’s commentary on this currency pair, please keep in mind what we wrote yesterday:
(…) USD/JPY (…) slipped slightly below the 38.2% Fibonacci retracement (…) yesterday. Despite this move, the green support zone encouraged currency bulls to act, which resulted in an invalidation of this small breakdown earlier today. Taking this event into account and the current position of the indicators (they are very close to generating buy signals), we think that further improvement is just around the corner. If this is the case, the initial upside target will be the upper border of the blue declining trend channel (currently around 113.88).
Very short-term outlook: mixed with bullish bias
Short-term outlook: mixed
MT outlook: mixed
LT outlook: mixed
Trading position (short-term; our opinion): No positions are justified from the risk/reward perspective. We will keep you informed should anything change, or should we see a confirmation/invalidation of the above.
USD/CHF
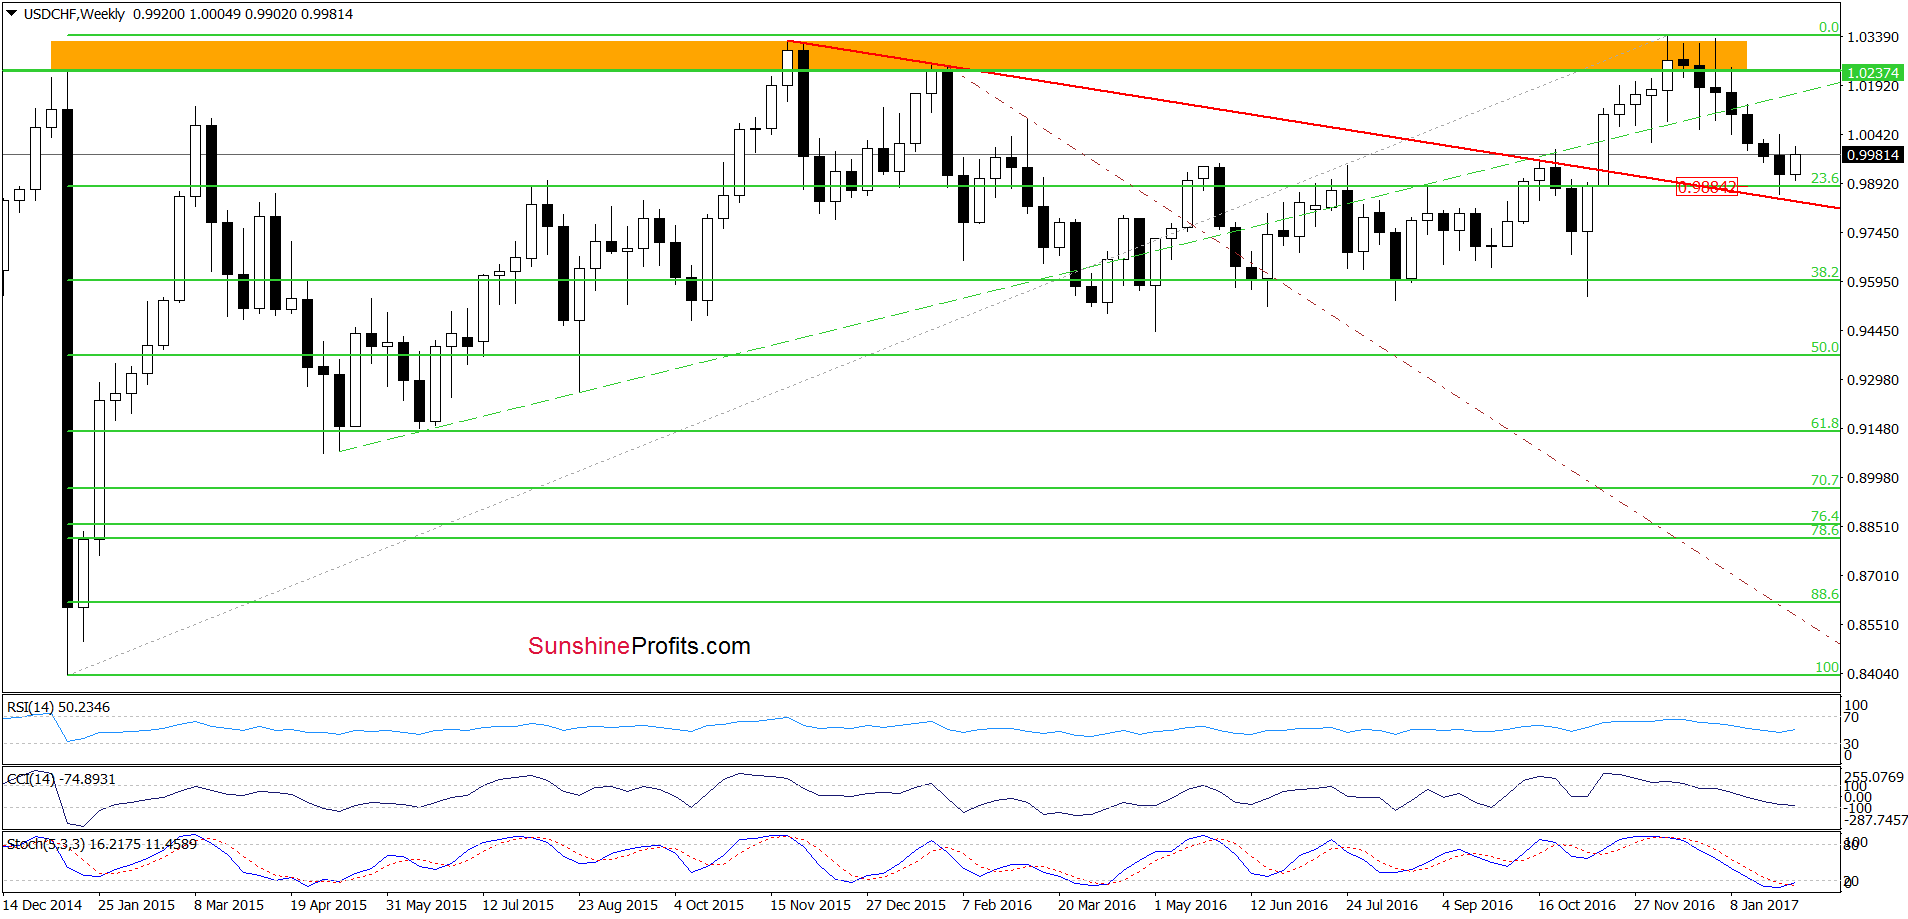
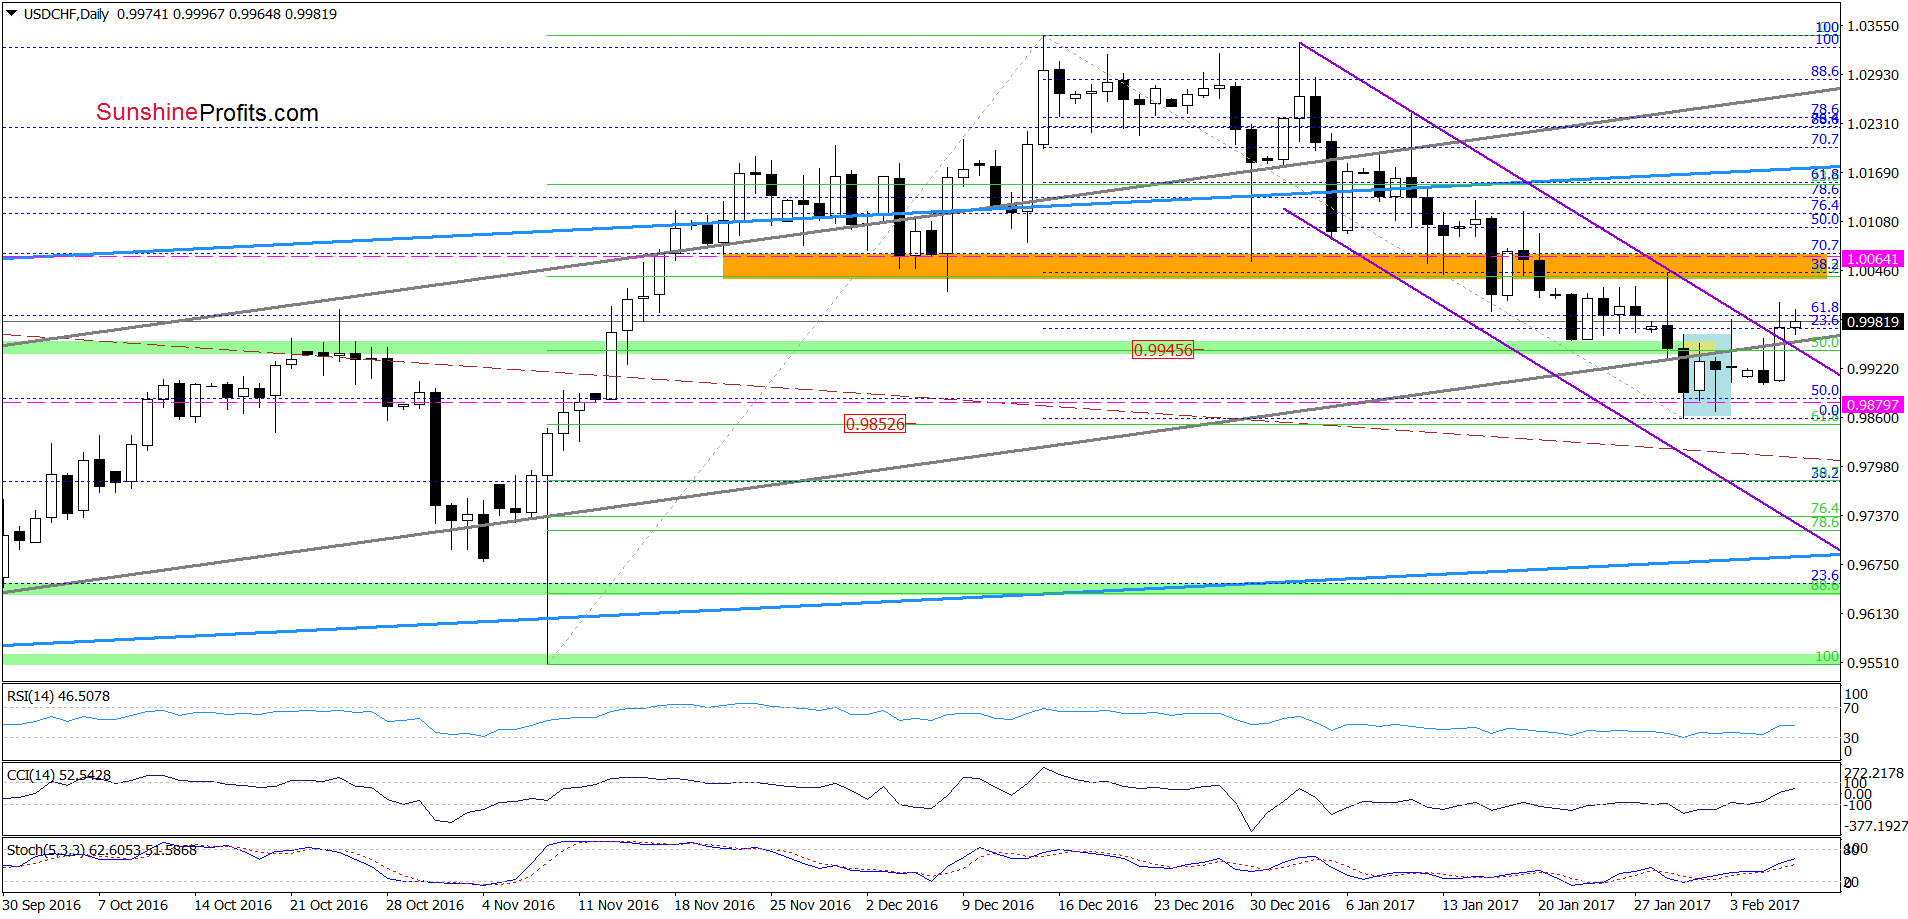
On the daily chart, we see that although USD/CHF gave up some of yesterday’s gains, the exchange rate closed Tuesday’s session above the upper border of the purple declining trend channel. This suggests that our last commentary is still valid:
(…) This is a bullish development, which together with the buy signals generated by the indicators suggest further improvement and (at least) a test of our initial upside target. If this area is broken, we may see even an increase to the previously-broken upper border of the blue rising trend channel (currently around 1.0172) in the following days.
Very short-term outlook: bullish
Short-term outlook: mixed with bullish bias
MT outlook: mixed
LT outlook: mixed
Trading position (short-term; our opinion): Long positions (with a stop-loss order at 0.9879 and the initial upside target at 1.0064) are justified from the risk/reward perspective. We will keep you informed should anything change, or should we see a confirmation/invalidation of the above.
As a reminder – “initial target price” means exactly that – an “initial” one, it’s not a price level at which we suggest closing positions. If this becomes the case (like it did in the previous trade) we will refer to these levels as levels of exit orders (exactly as we’ve done previously). Stop-loss levels, however, are naturally not “initial”, but something that, in our opinion, might be entered as an order.
Thank you.
Nadia Simmons
Forex & Oil Trading Strategist
Przemyslaw Radomski, CFA
Founder, Editor-in-chief, Gold & Silver Fund Manager
Gold & Silver Trading Alerts
Forex Trading Alerts
Oil Investment Updates
Oil Trading Alerts

