

Earlier today, the pound extended Friday’s losses as yesterday’s British Prime Minister Theresa May comments weighed on the British currency. What happened at the same time with our other currency pairs?
In our opinion the following forex trading positions are justified - summary:
EUR/USD
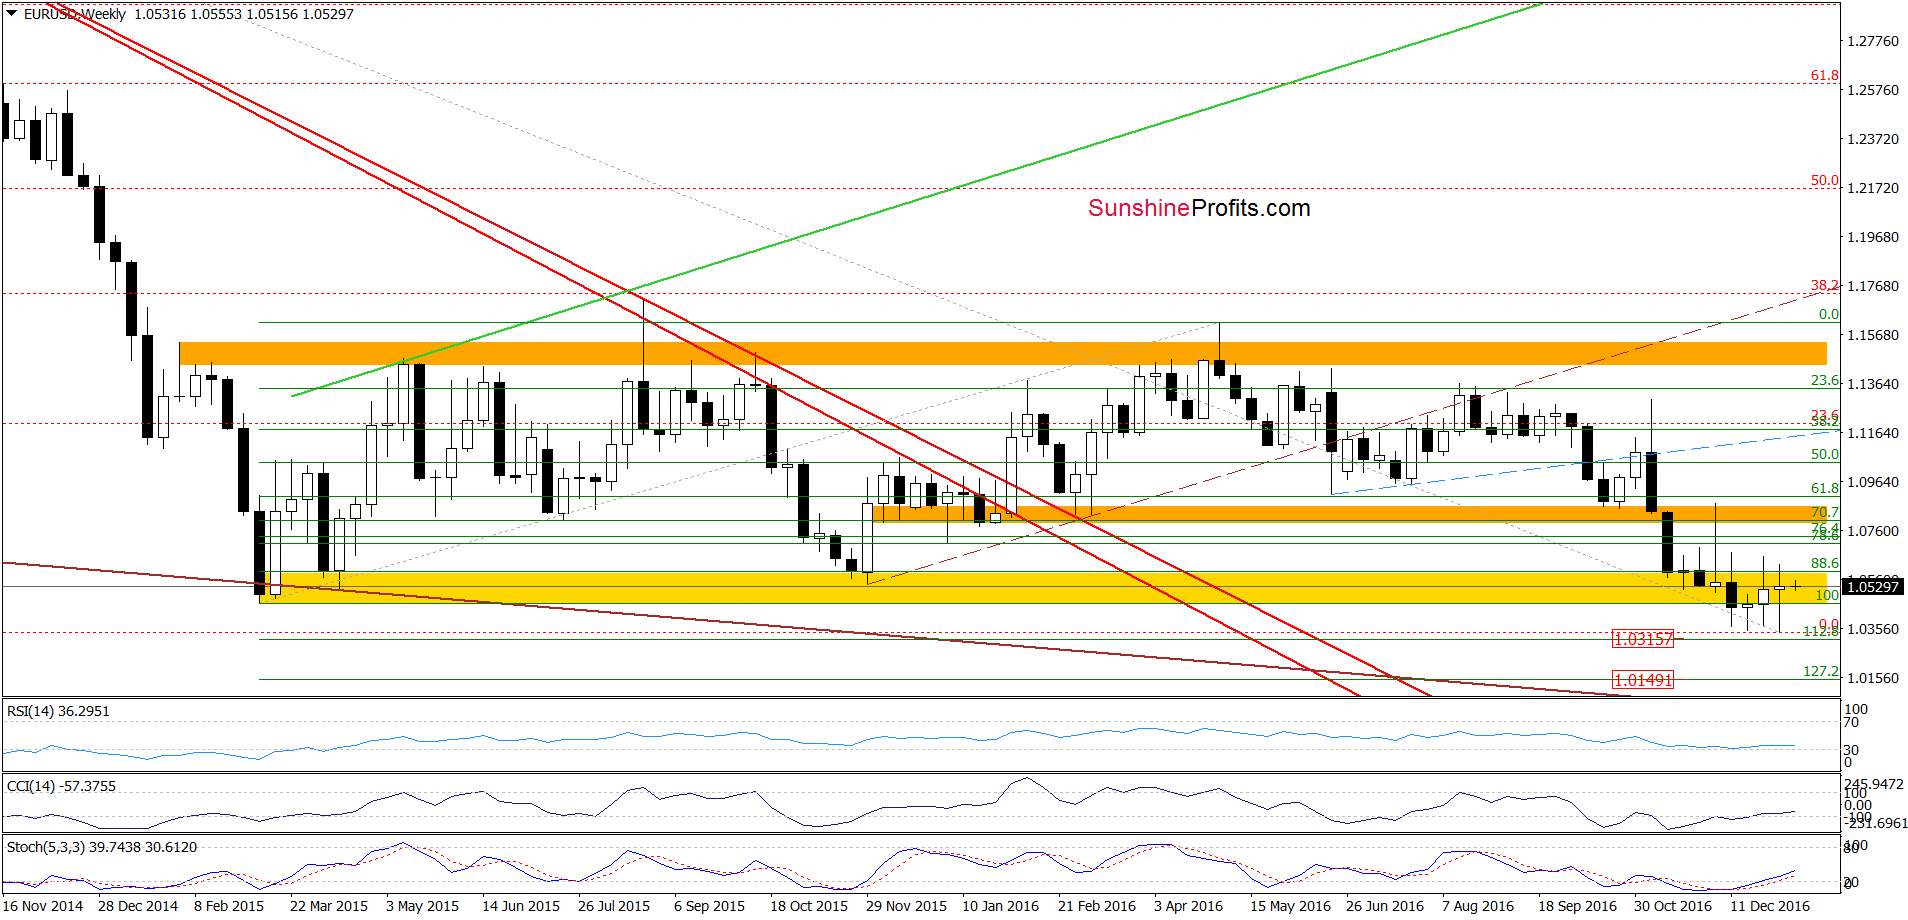
The situation in the medium term hasn’t changed much as EUR/USD is still trading in a narrow range in the yellow resistance zone.
Will the very short-term chart give us more clues about future moves? Let’s check.
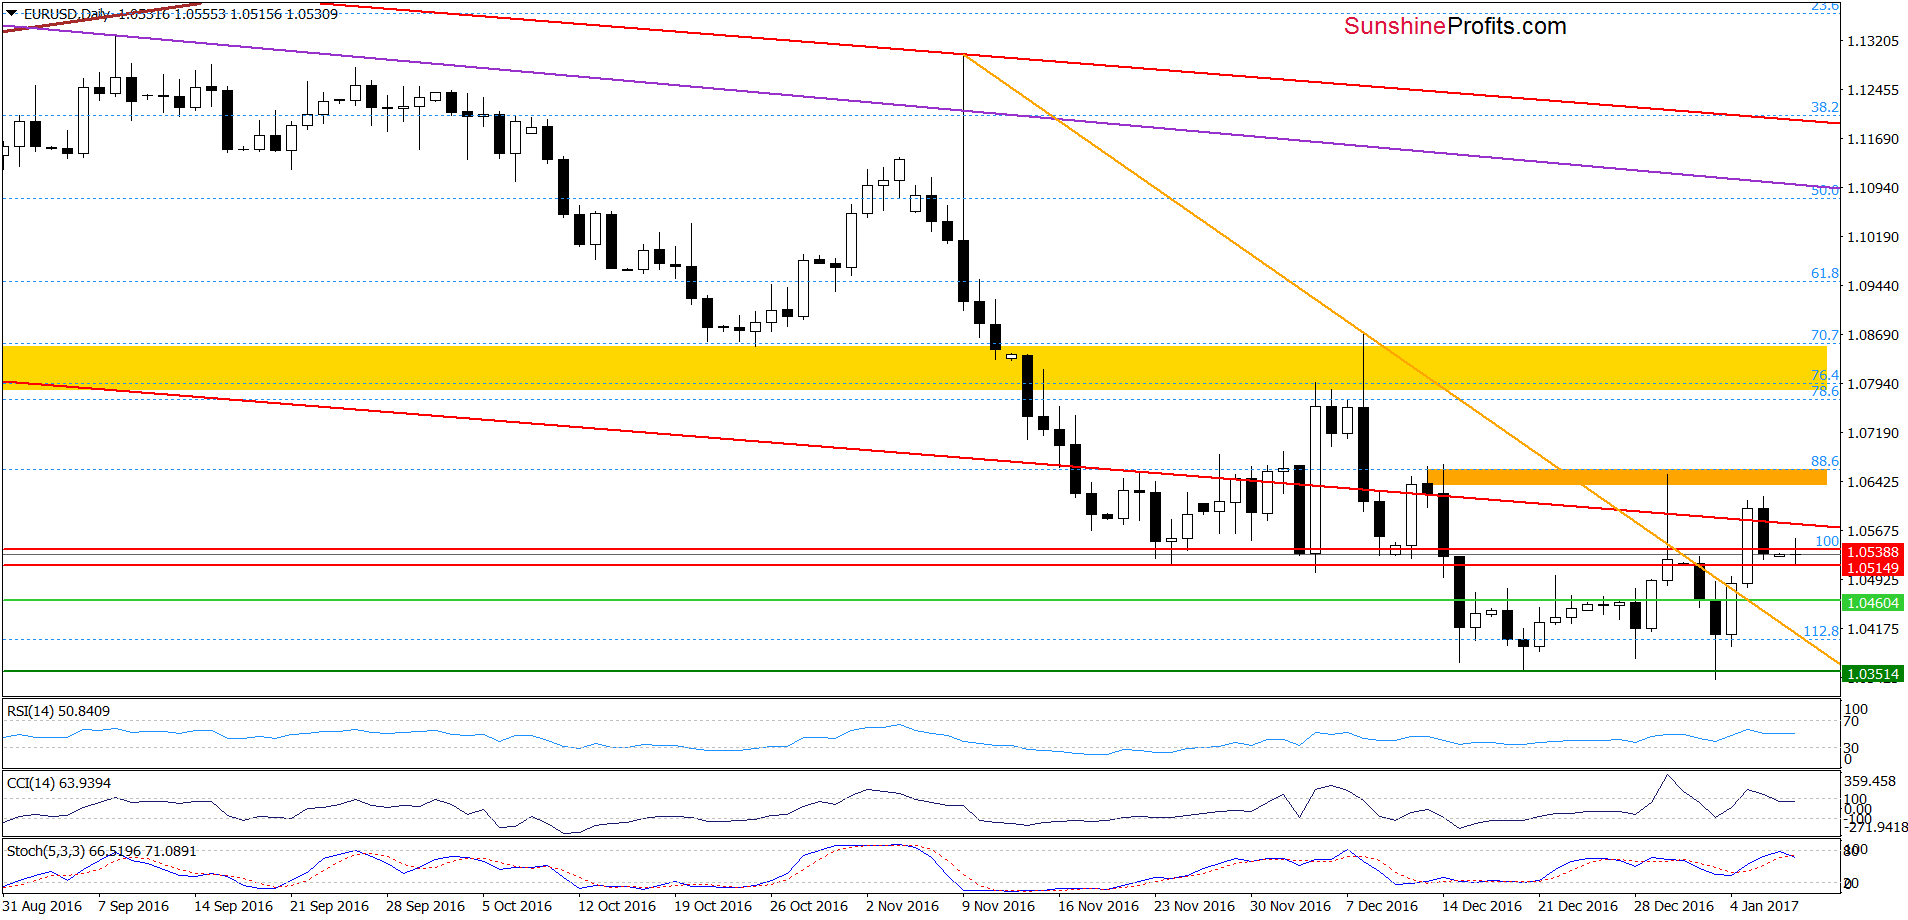
The first thing that catches the eye on the daily chart is an invalidation of the breakout above the lower border of the red declining trend channel. Additionally, the CCI and Stochastic Oscillator generated sell signals, which suggests further deterioration and a test of the previously-broken orange declining line, which serves as the nearest important support at the moment.
Very short-term outlook: mixed with bearish bias
Short-term outlook: mixed
MT outlook: mixed
LT outlook: mixed
Trading position (short-term; our opinion): No positions are justified from the risk/reward perspective. We will keep you informed should anything change, or should we see a confirmation/invalidation of the above.
GBP/USD
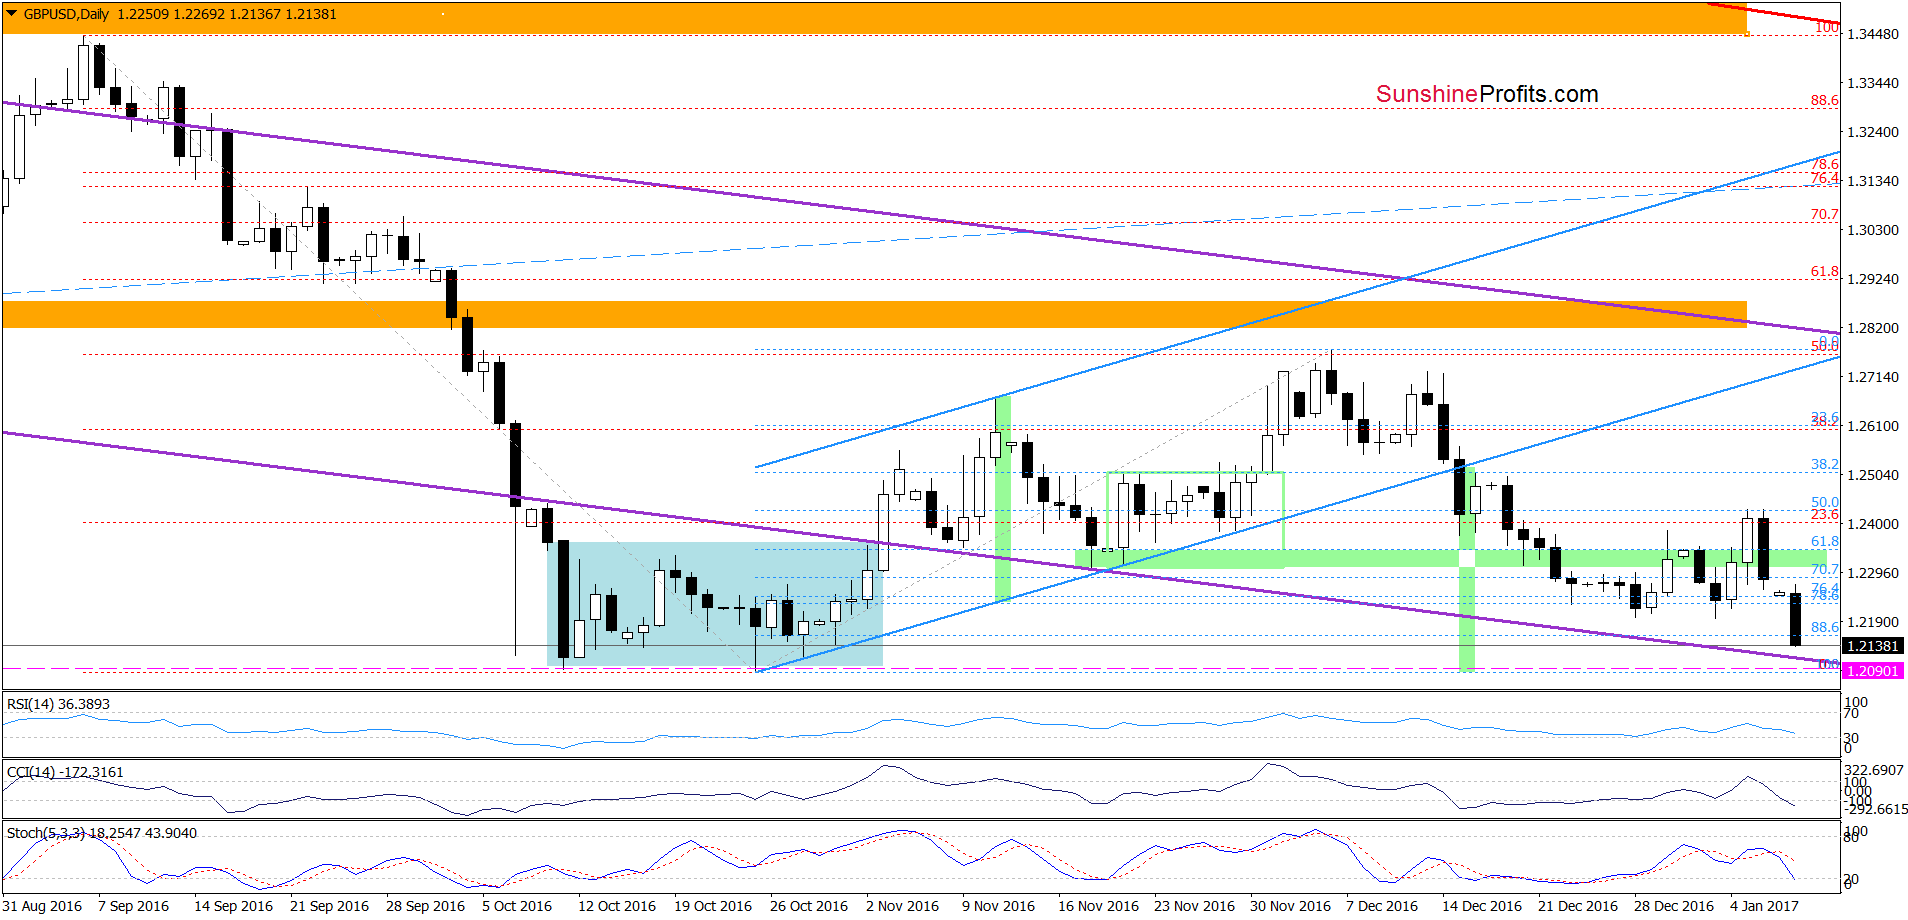
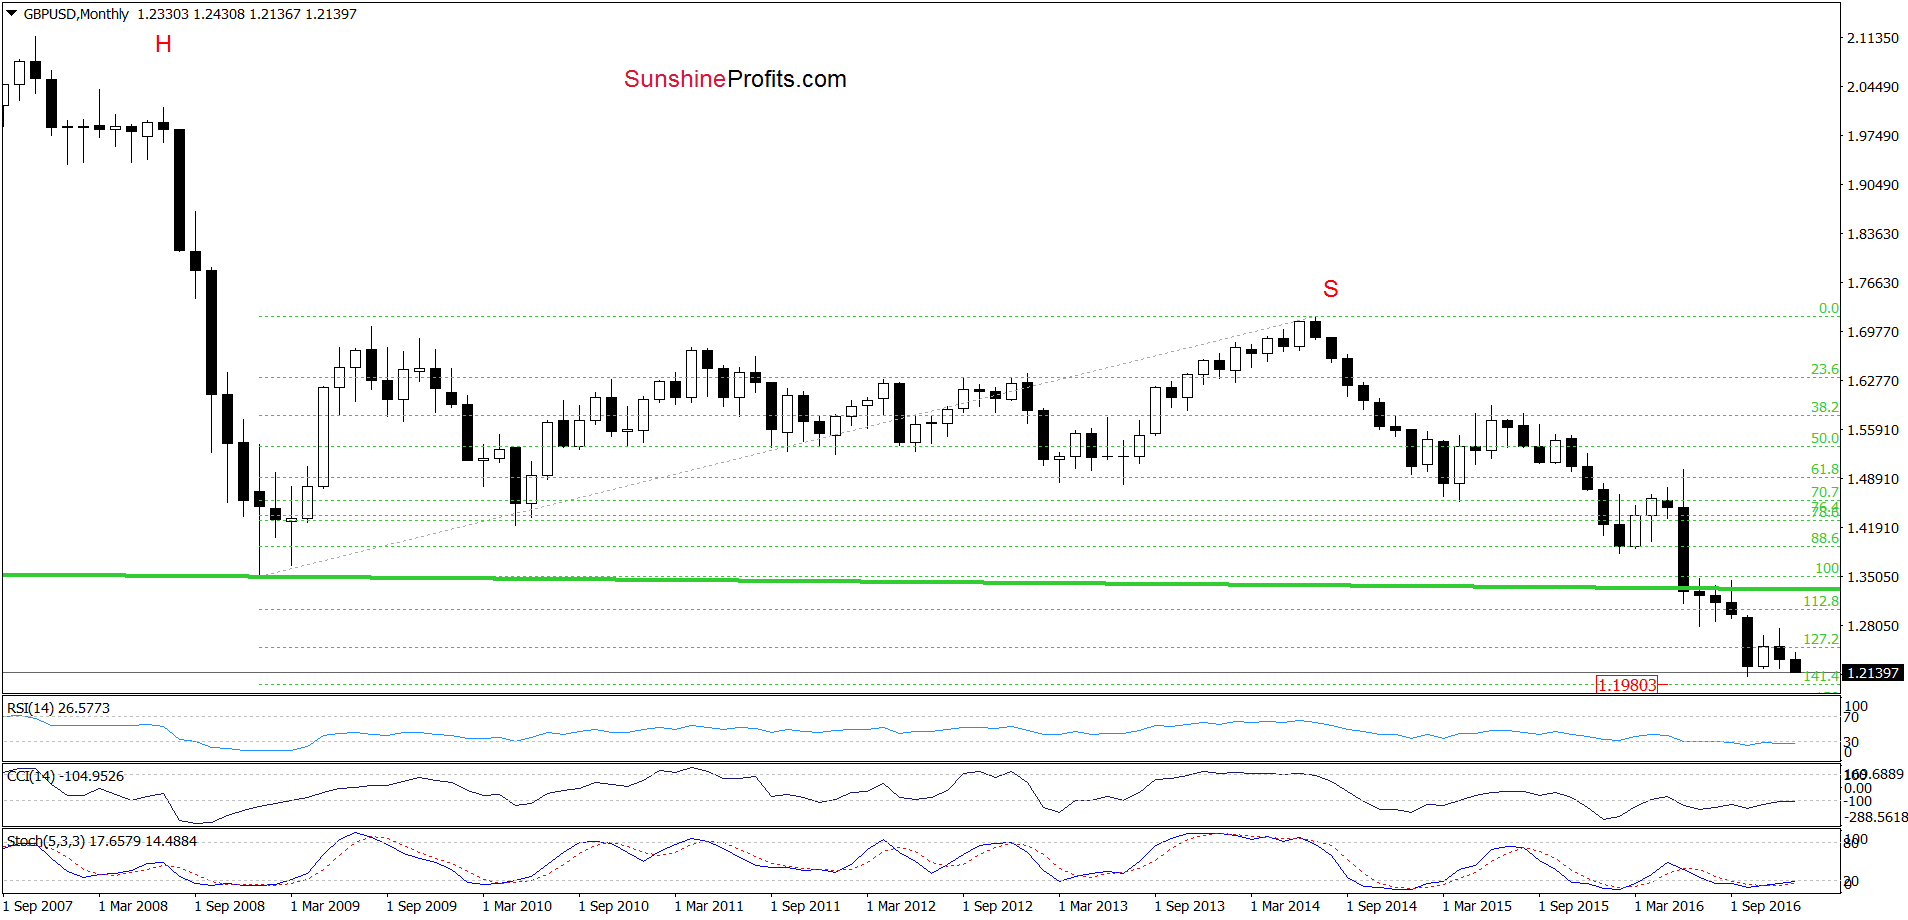
From today’s point of view, we see that GBP/USD invalidated the earlier breakout above the previously-broken green zone on Friday, which means that our previous commentary on this currency pair is up-to-date also today:
(…) the initial downside target for currency bears will be around 1.2127, where the purple support line currently is. Nevertheless, a breakdown under the lower border of the blue rising trend channel, suggests a drop to around 1.2090, where the size of the move would correspond to the height of the channel. In this area is also the October low and the barrier of 1.2000, which together could stop further deterioration once again.
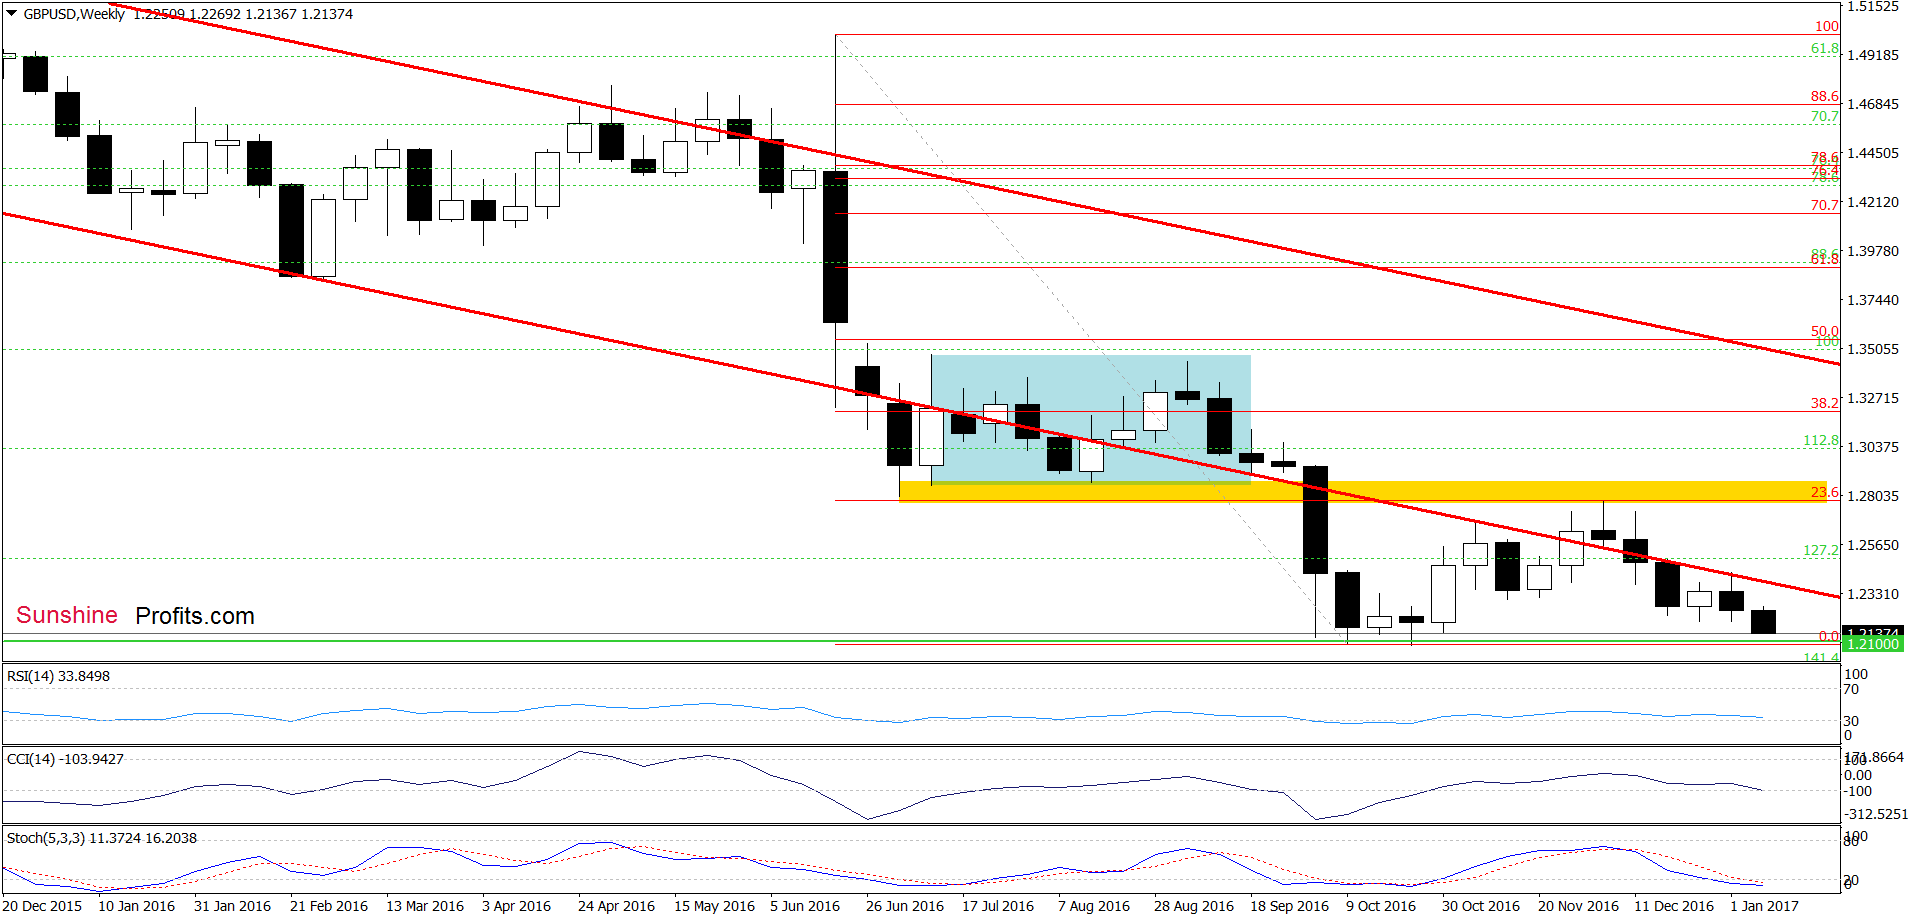
Finishing today’s commentary on GBP/USD it is also worth noting that if currency bulls failed in this area, the exchange rate would likely drop to 1.1980, where the next Fibonacci extension (marked on the monthly chart below) is.
Very short-term outlook: mixed with bearish bias
Short-term outlook: mixed with bearish bias
MT outlook: mixed
LT outlook: mixed
Trading position (short-term; our opinion): No positions are justified from the risk/reward perspective. We will keep you informed should anything change, or should we see a confirmation/invalidation of the above.
USD/JPY
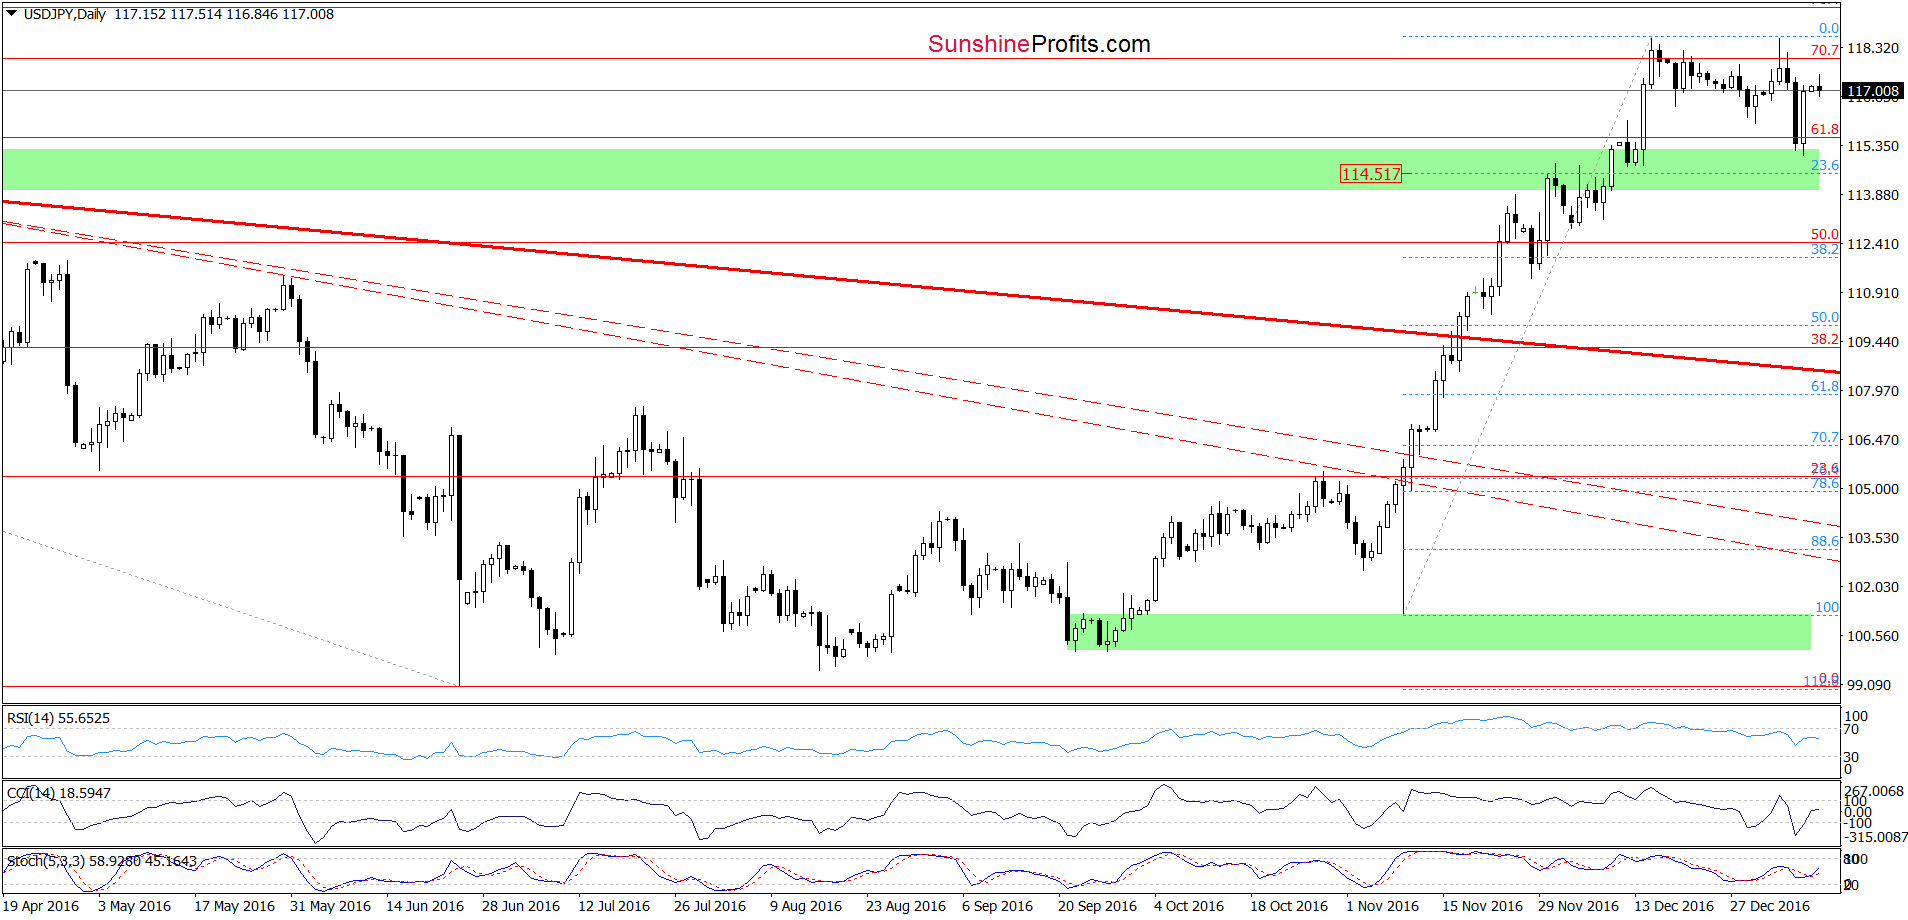
Looking at the daily chart, we see that USD/JPY rebounded after Friday’s drop, but will we see further improvement? Let’s examine the charts below and find out.
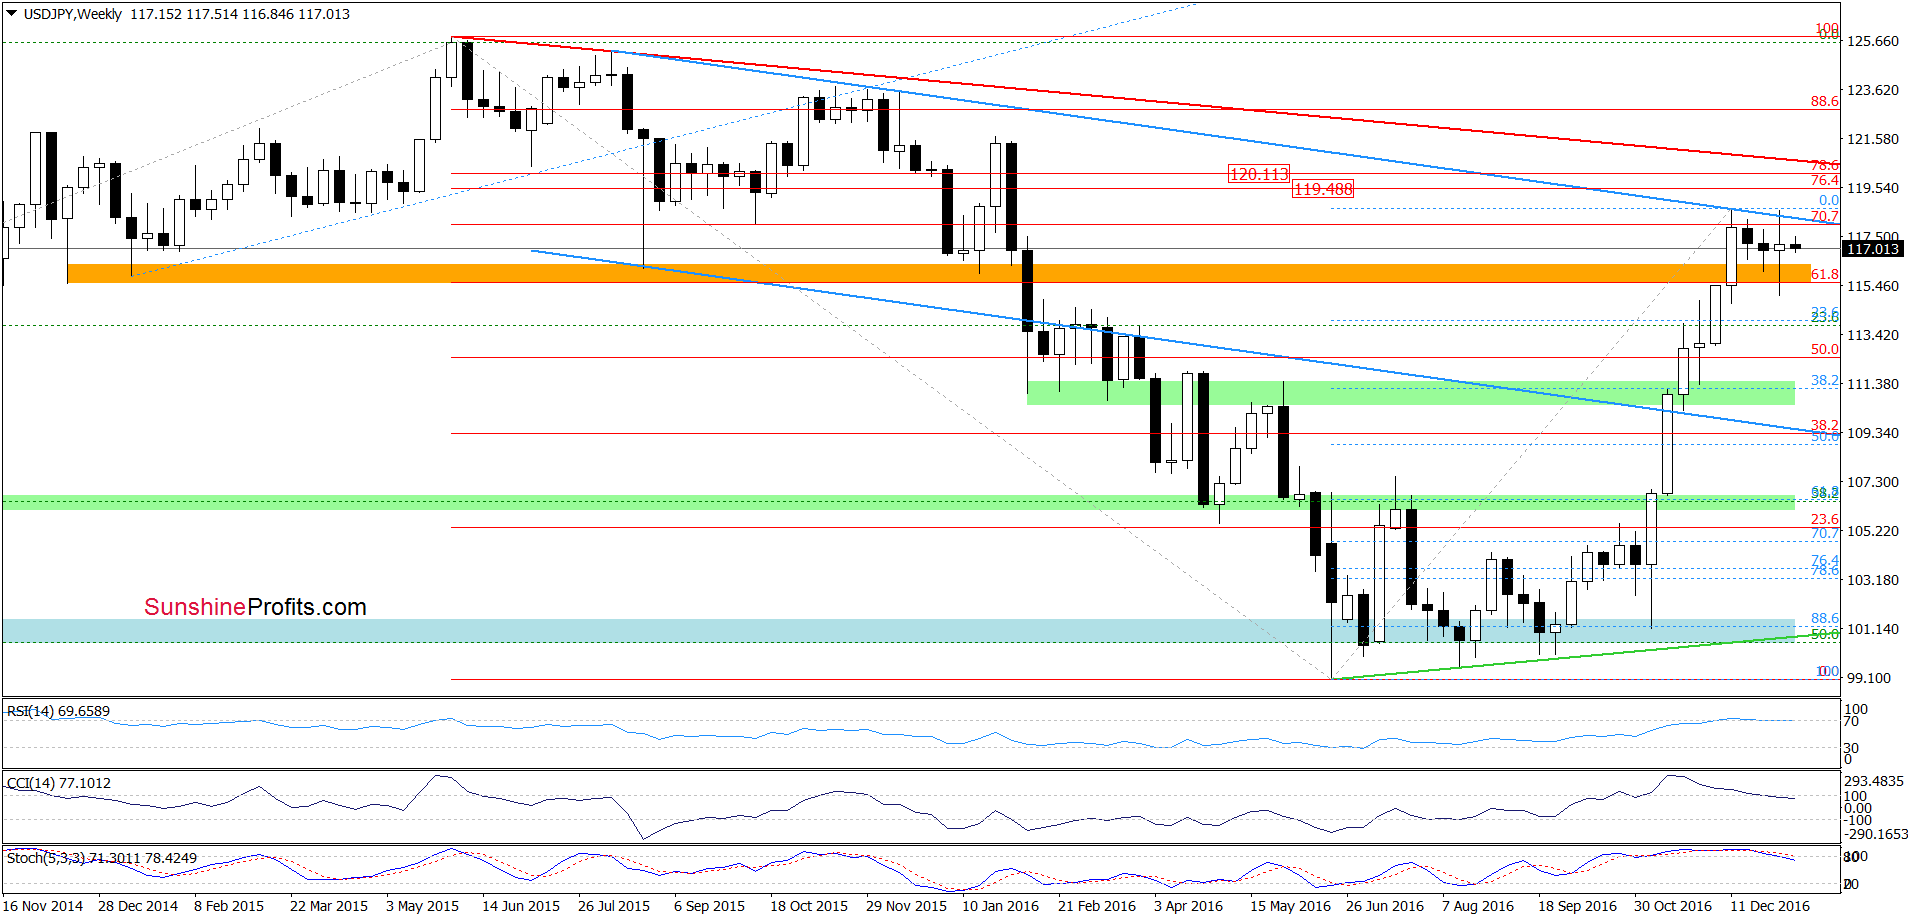
From the medium-term perspective, we see that the pair re-approached the blue declining resistance line in the previous week, which could stop the appreciation in the coming week(s) – similarly to what we saw in mid December. Additionally, the RSI, the CCI and Stochastic Oscillator generated sell signals, increasing the probability of declines. If we see such price action, the initial downside target will be the orange zone, which serves now as the nearest support at the moment.
Very short-term outlook: mixed with bearish bias
Short-term outlook: mixed
MT outlook: mixed
LT outlook: mixed
Trading position (short-term; our opinion): No positions are justified from the risk/reward perspective. We will keep you informed should anything change, or should we see a confirmation/invalidation of the above.
USD/CAD
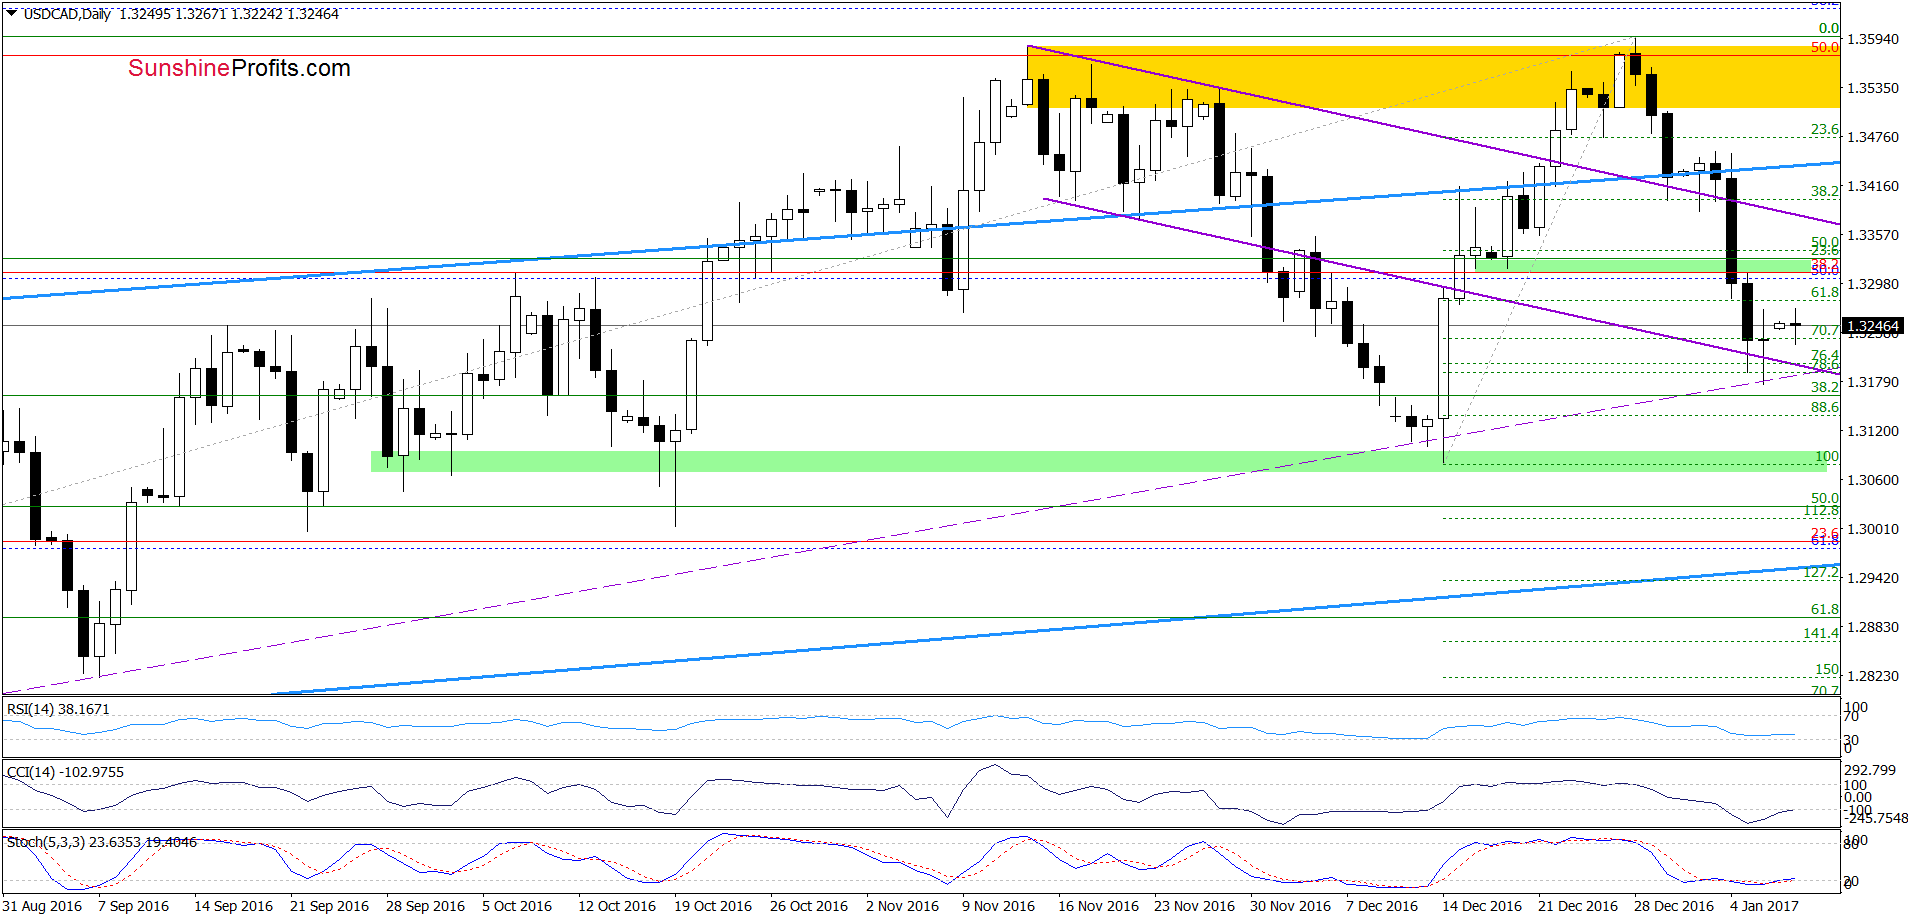
On January 4, we wrote the following:
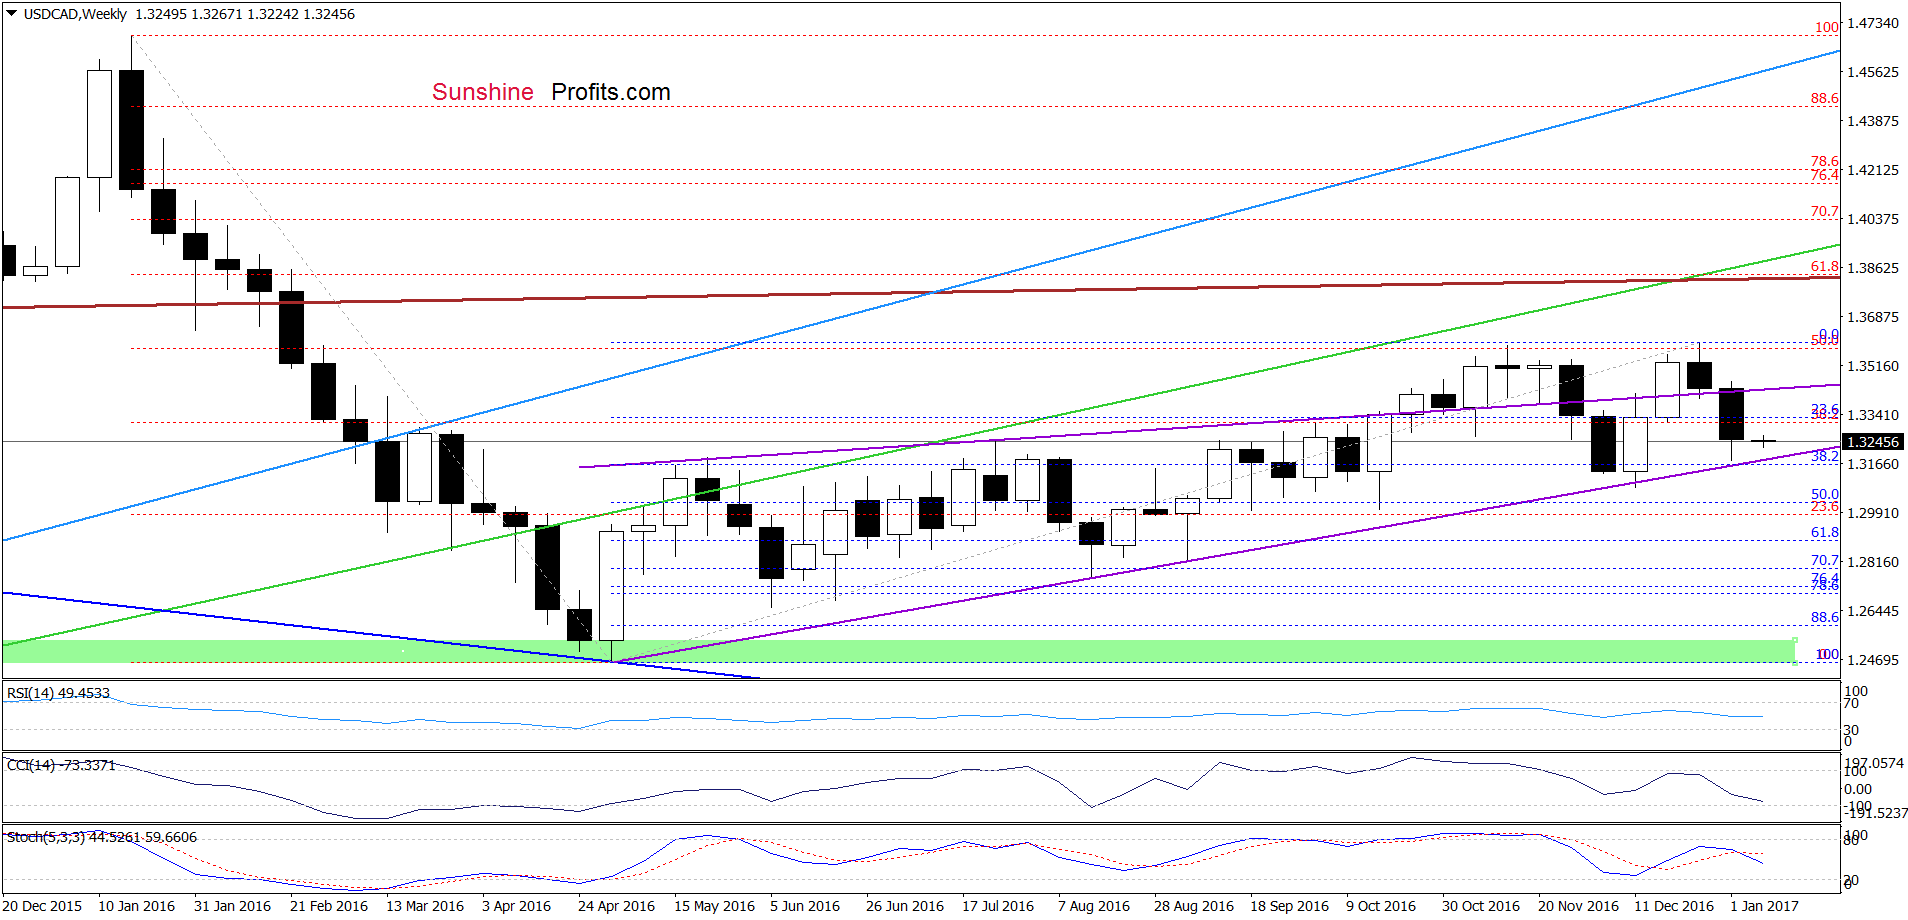
(…) USD/CAD dropped under the upper border of the purple rising trend channel (marked on the weekly chart) and the upper line of the purple declining trend channel (seen on the daily chart), which triggered a sharp decline earlier today. Thanks to this drop, the exchange rate reached the green support zone created by the 50% Fibonacci retracement (based on the December upward move) and the mid-December lows (…) if USD/CAD drops under this support zone, the next downside target will be around 1.3217, where the lower border of the purple declining trend channel is.
Looking at the daily chart, we see that the situation developed in line with the above scenario and the exchange rate slipped to our downside target in the previous week. With this drop USD/CAD also reached the support area created by the 76.4% and 78.6% Fibonacci retracements and approached the lower border of the purple rising trend channel (marked on the weekly chart), which together can encourage currency bulls to act in the coming week. Nevertheless, as long as there are no buy signals generated by the indicators, another test of the lower borders of the both purple declining trend channels is likely and opening positions is not are justified from the risk/reward perspective.
Very short-term outlook: mixed
Short-term outlook: mixed
MT outlook: mixed
LT outlook: mixed
Trading position (short-term; our opinion): No positions are justified from the risk/reward perspective. We will keep you informed should anything change, or should we see a confirmation/invalidation of the above.
USD/CHF
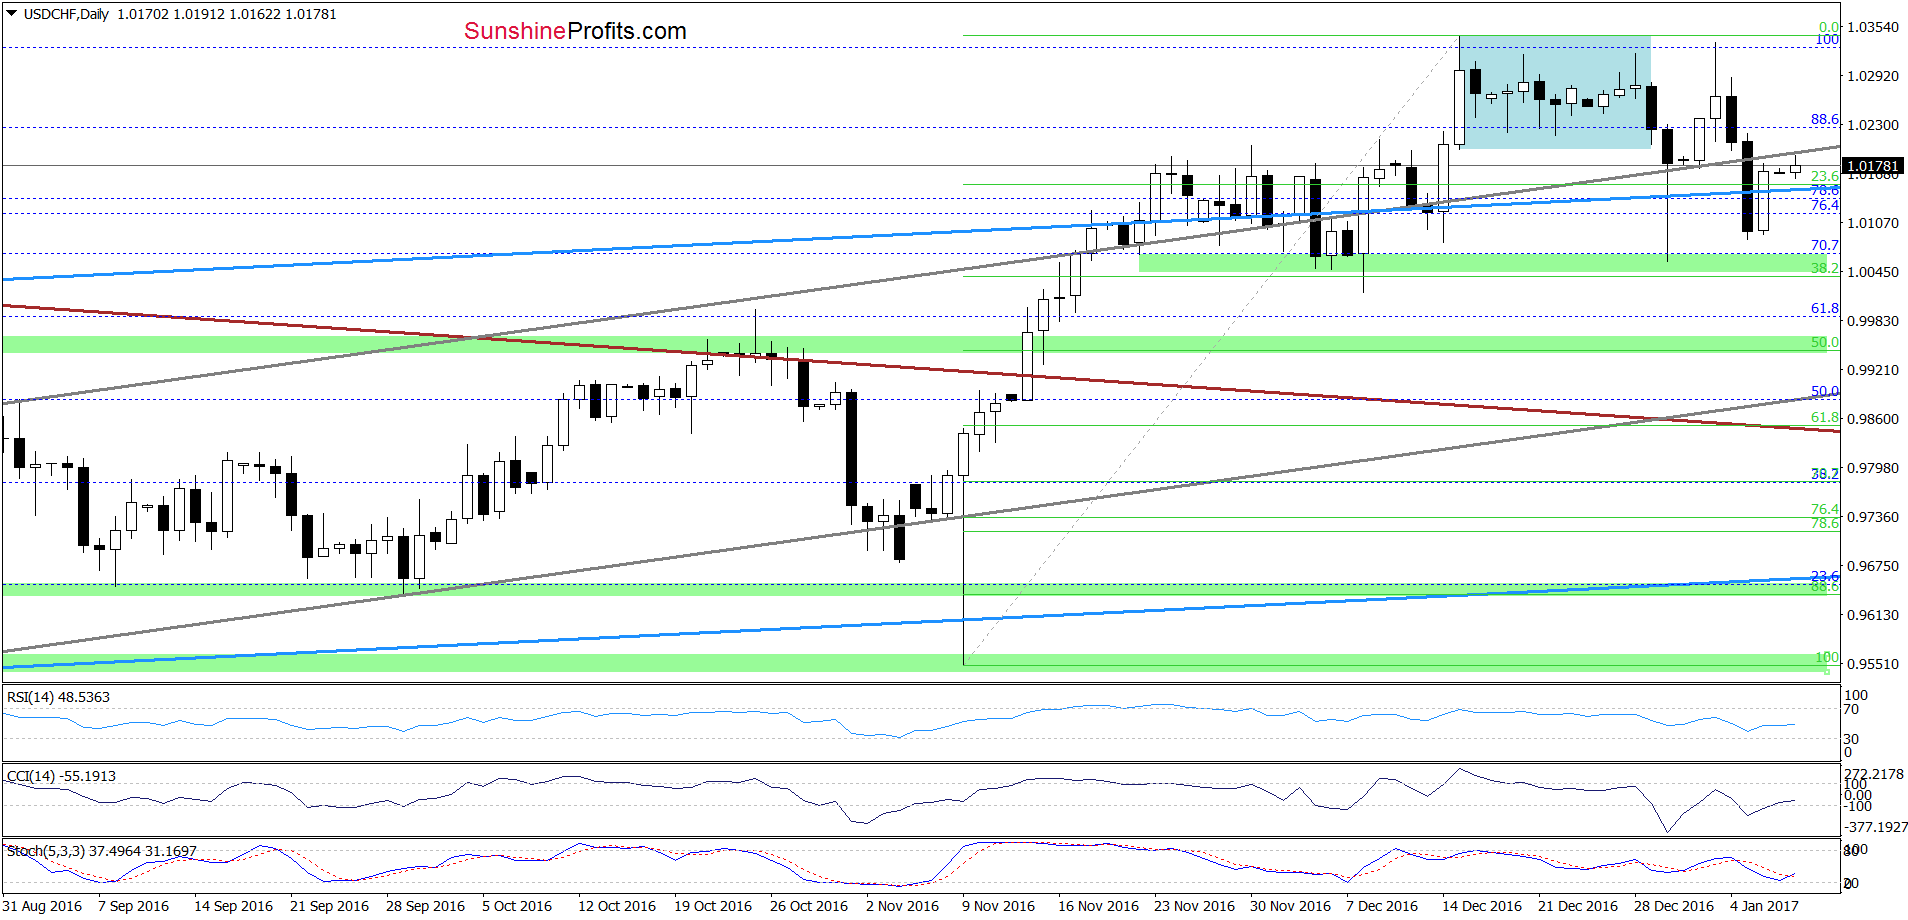
On the daily chart, we see that although USD/CHF broke below the upper borders of the grey and blue rising trend channels in the previous week, the pair reversed and invalidated the breakdown under the blue support line on Friday. Earlier today, the CCI and Stochastic Oscillator generated buy signals, which increases the probability of further improvement in the coming week. However, in our opinion, such action would be more likely if the exchange rate invalidated also the breakdown below the grey support/resistance line. In this case, USD/CHF would likely re-test the recent highs.
Very short-term outlook: mixed
Short-term outlook: mixed
MT outlook: mixed
LT outlook: mixed
Trading position (short-term; our opinion): No positions are justified from the risk/reward perspective. We will keep you informed should anything change, or should we see a confirmation/invalidation of the above.
AUD/USD
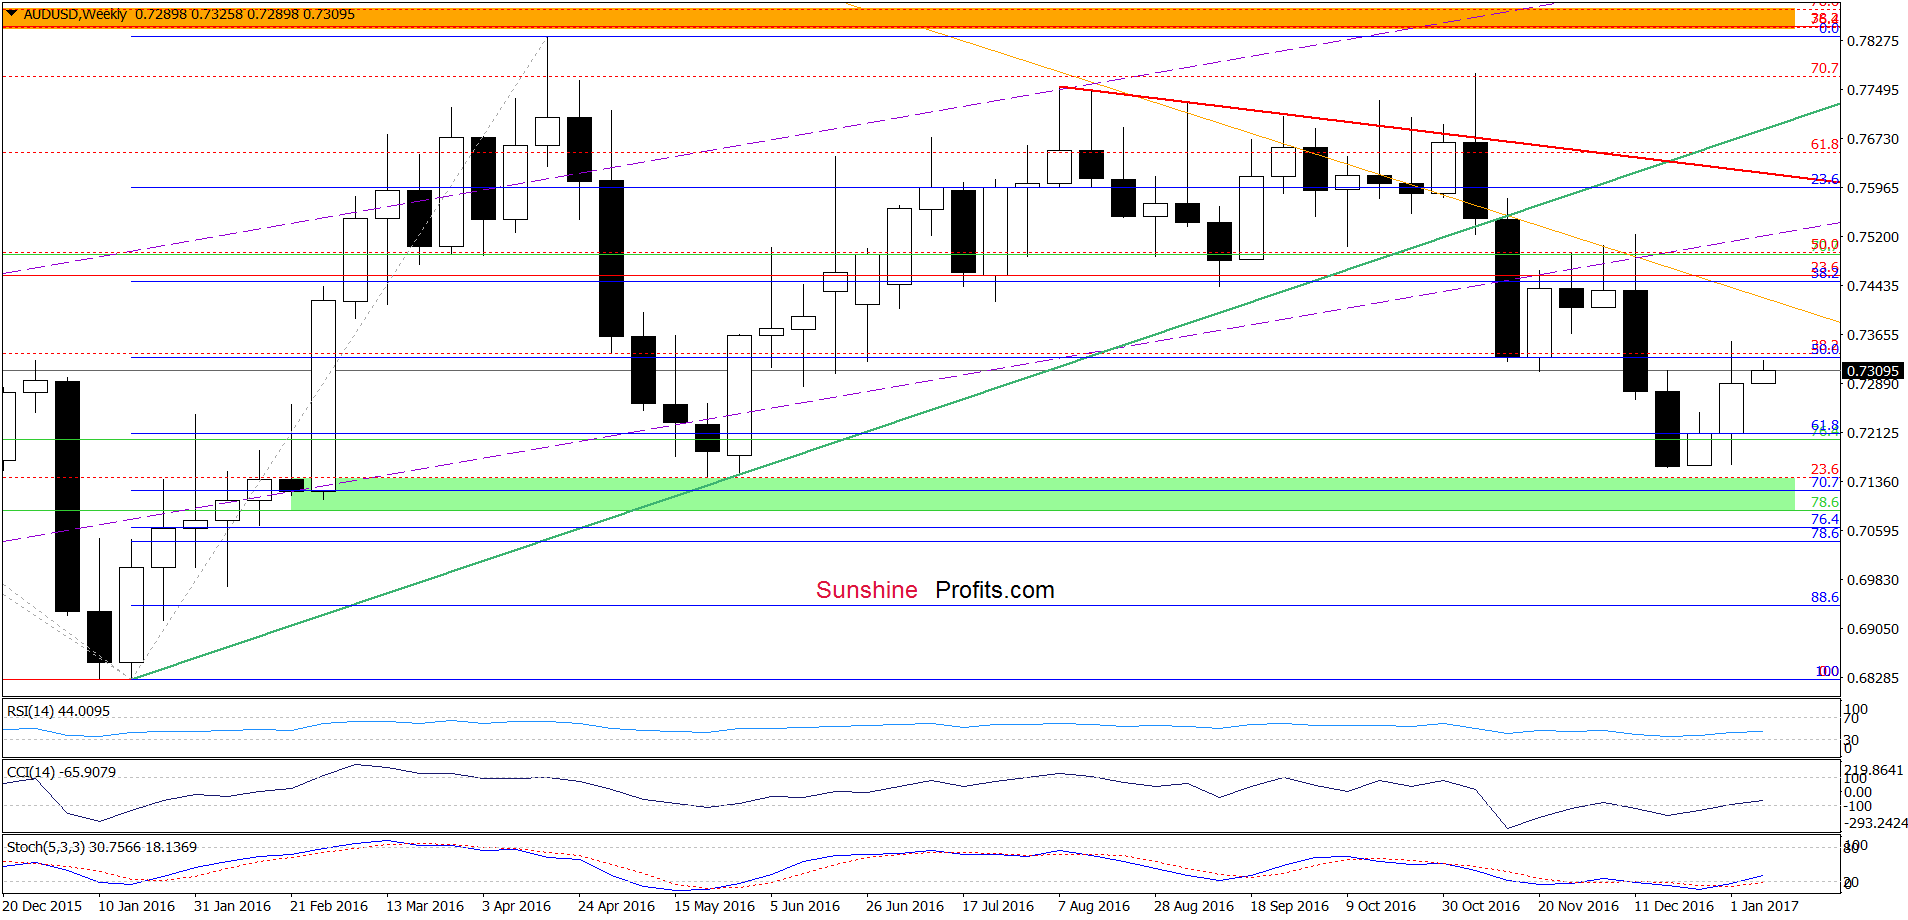
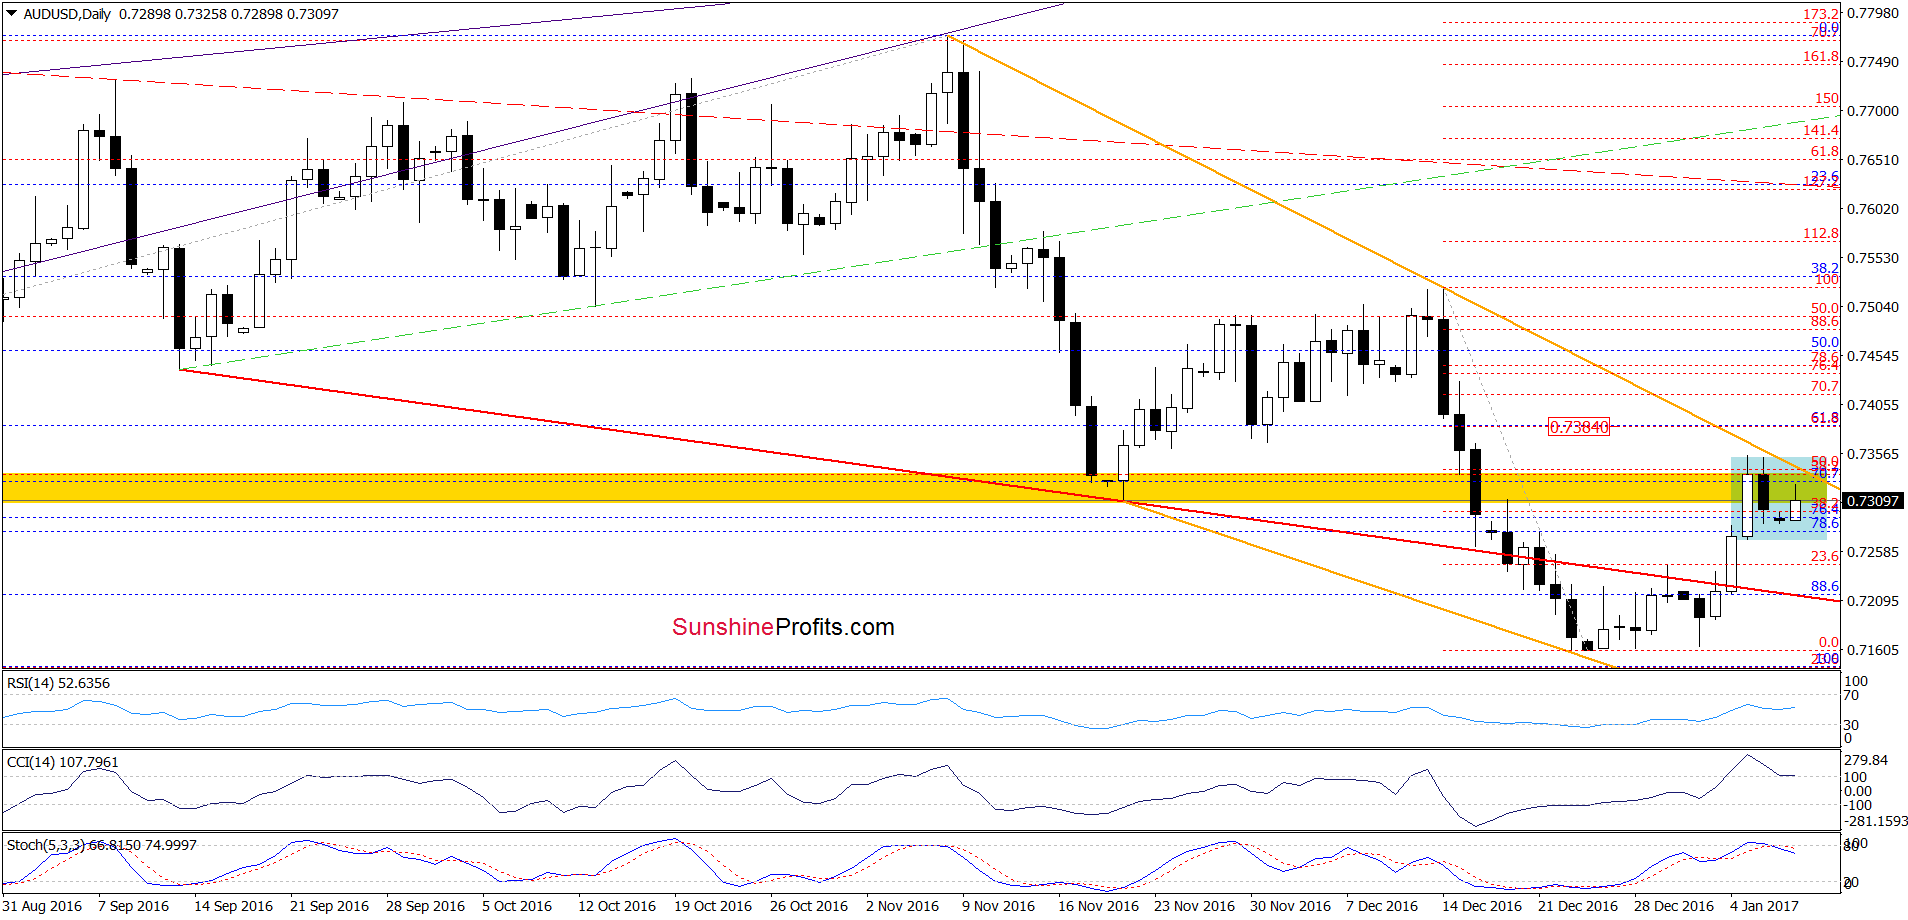
From today’s point of view, we see that the overall situation hasn’t changed much as AUD/USD is consolidating under the yellow resistance zone. Therefore, what we wrote on Friday remains up-to-date also today:
(…) the pair also climbed to the orange declining resistance line based on the November and December highs, which together with the yellow resistance zone could trigger a reversal and a decline in the coming week. However, this scenario would be more likely if the CCI and Stochastic Oscillator generated sell signals. In this case, currency bears could push AUD/USD even to the previously-broken red support line based on the September and November lows (currently around 0.7219).
Very short-term outlook: mixed with bearish bias
Short-term outlook: mixed
MT outlook: mixed
LT outlook: mixed
Trading position (short-term; our opinion): No positions are justified from the risk/reward perspective. We will keep you informed should anything change, or should we see a confirmation/invalidation of the above.
Thank you.
Nadia Simmons
Forex & Oil Trading Strategist
Przemyslaw Radomski, CFA
Founder, Editor-in-chief, Gold & Silver Fund Manager
Gold & Silver Trading Alerts
Forex Trading Alerts
Oil Investment Updates
Oil Trading Alerts

