

Earlier today, the USD Index extended gains and climbed to its highest level since Feb. How did this increase affect our six currency pairs?
In our opinion the following forex trading positions are justified - summary:
- EUR/USD: none
- GBP/USD: none
- USD/JPY: short (a stop-loss order at 104.84; initial downside target at 101.02)
- USD/CAD: none
- USD/CHF: short (a stop-loss order at 1.0000; initial downside target at 0.9841)
- AUD/USD: short (a stop-loss order at 0.7769; initial downside target at 0.7542)
EUR/USD
On Friday, we wrote the following:
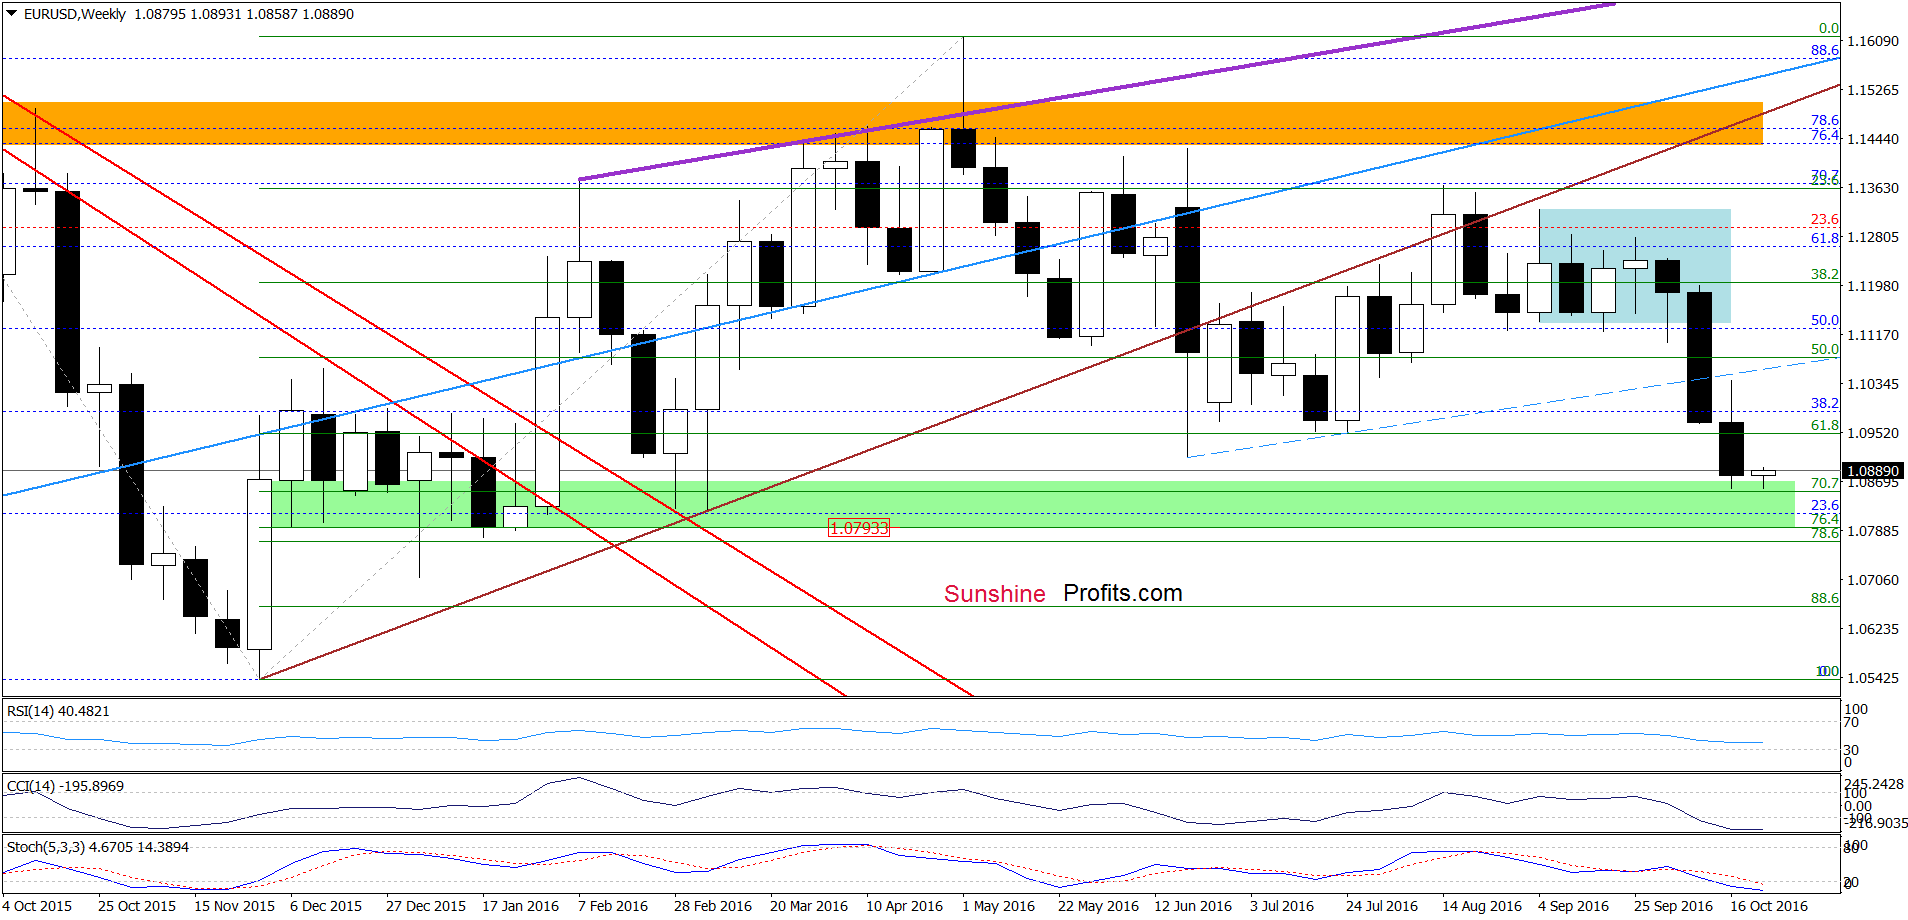
(…) EUR/USD extended losses and slipped under Jul lows, which is a negative signal that suggests further deterioration and a test of the green support zone (maybe even the lower border of this area) created by the 76.4% Fibonacci retracement (based on the Nov 2015-May 2016 upward move), mid-Dec, mid-Jan and Feb lows (around 1.0793-1.0871) in the coming week.
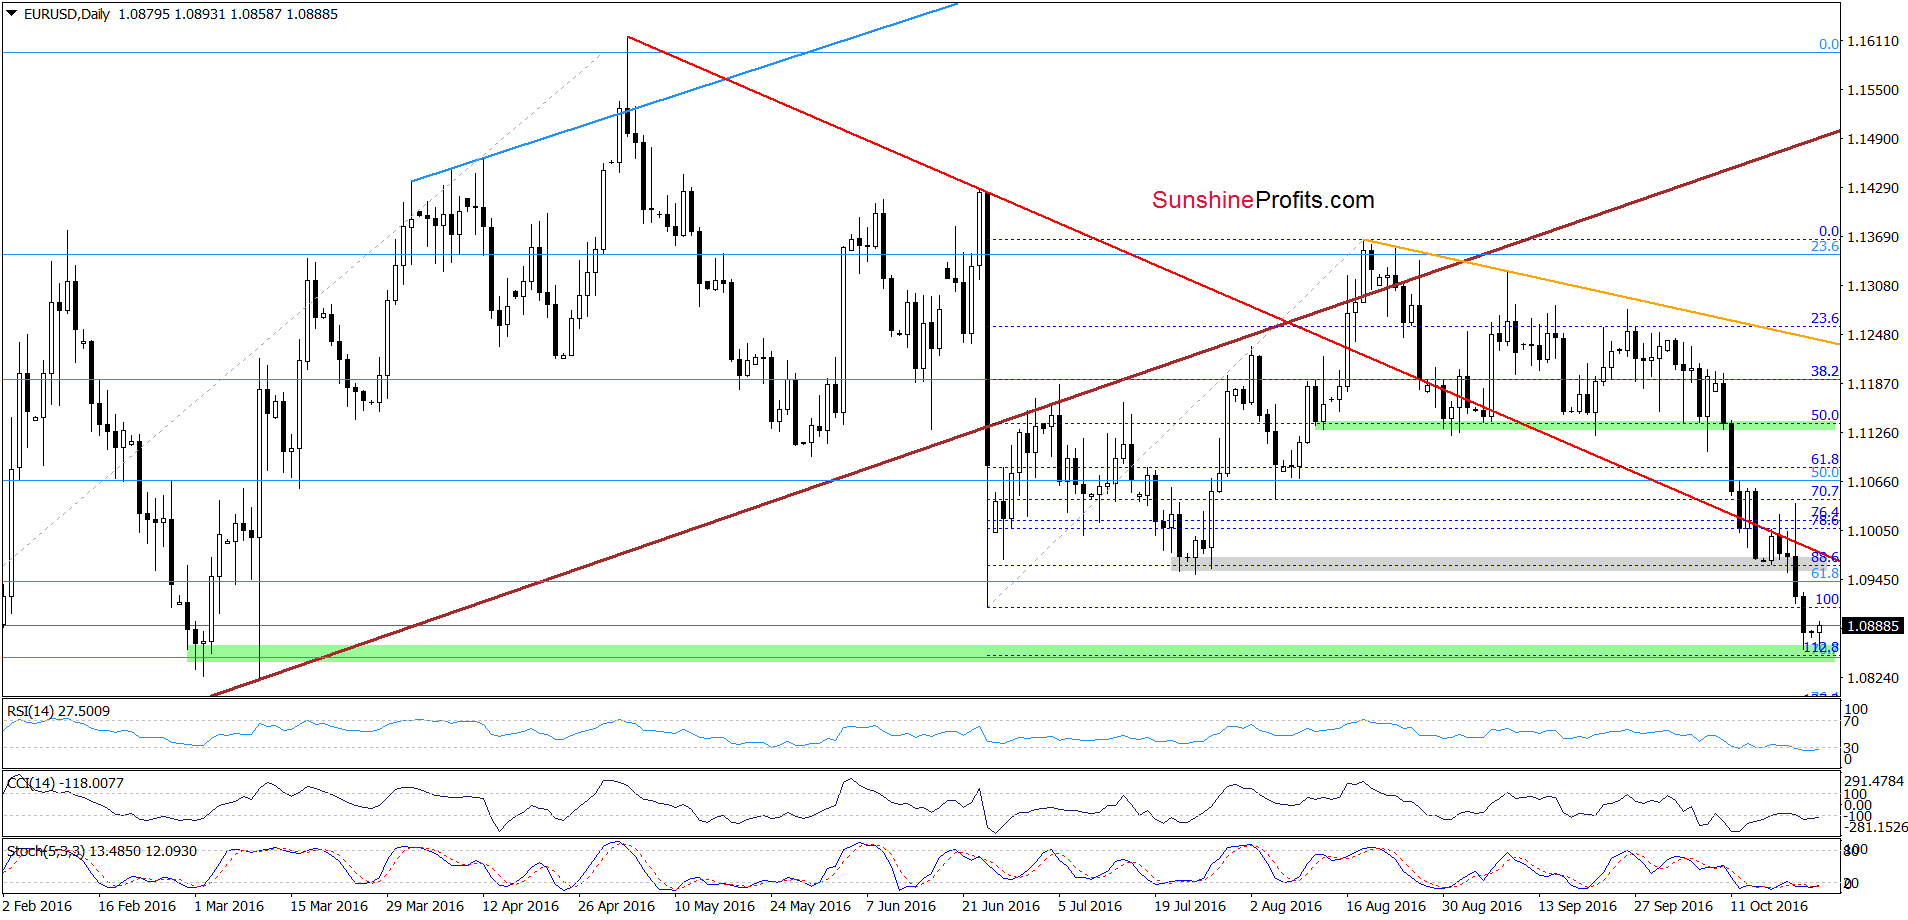
From today’s point of view, we see that the situation developed in line with the above scenario and EUR/USD slipped to the upper line of the green support zone. As you see this area triggered a rebound earlier today, which in combination with the current position of the indicators (they are very close to generating buy signals) suggests that further improvement is just around the corner.
Nevertheless, as long as the exchange rate is trading under the grey zone (marked on the daily chart, which serves as the nearest resistance) another attempt to move lower and a re-test of the green zone can’t be ruled out (especially when we factor in the fact that there are no buy signals at the moment of writing these words).
Finishing today’s commentary on this currency pair, please keep in mind what could happen if the green zone is broken:
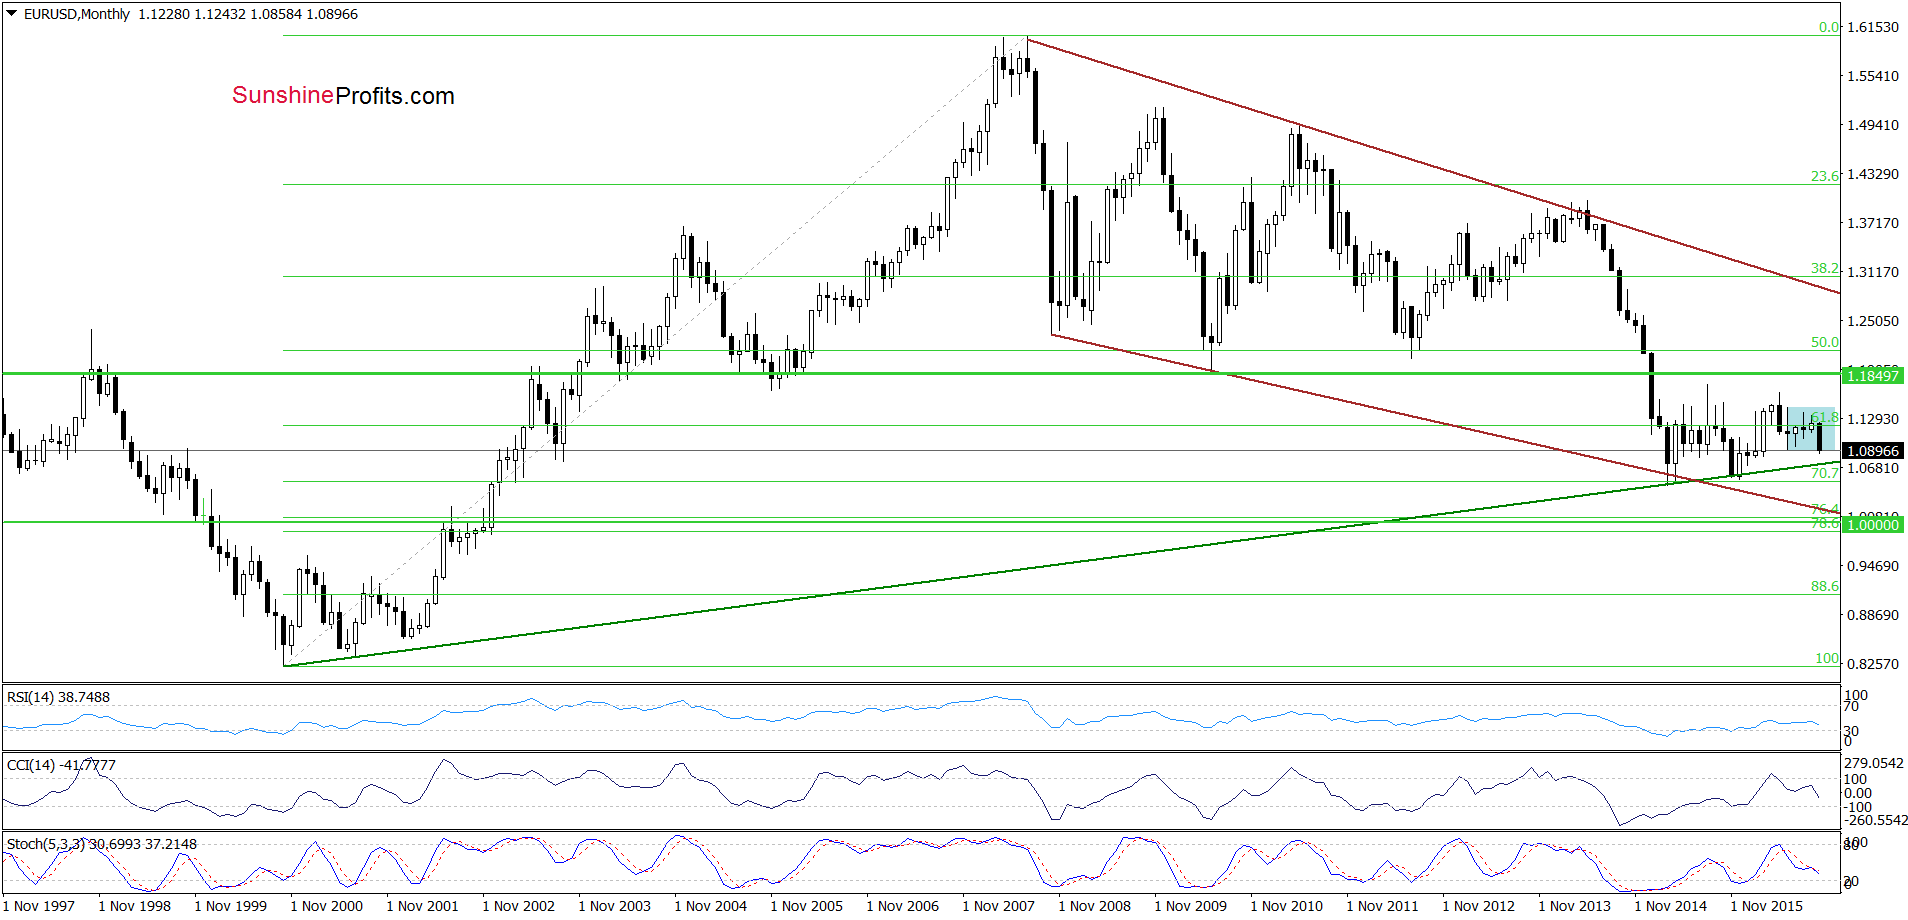
(…) EUR/USD will likely re-test the strength of the long-term green support line (…) this key support line was strong enough to stop currency bears in Mar, Apr, Nov and Dec 2015, which suggests that we may see similar price action in the coming week.
Very short-term outlook: mixed
Short-term outlook: mixed
MT outlook: mixed
LT outlook: mixed
Trading position (short-term; our opinion): No positions are justified from the risk/reward perspective. We will keep you informed should anything change, or should we see a confirmation/invalidation of the above.
GBP/USD
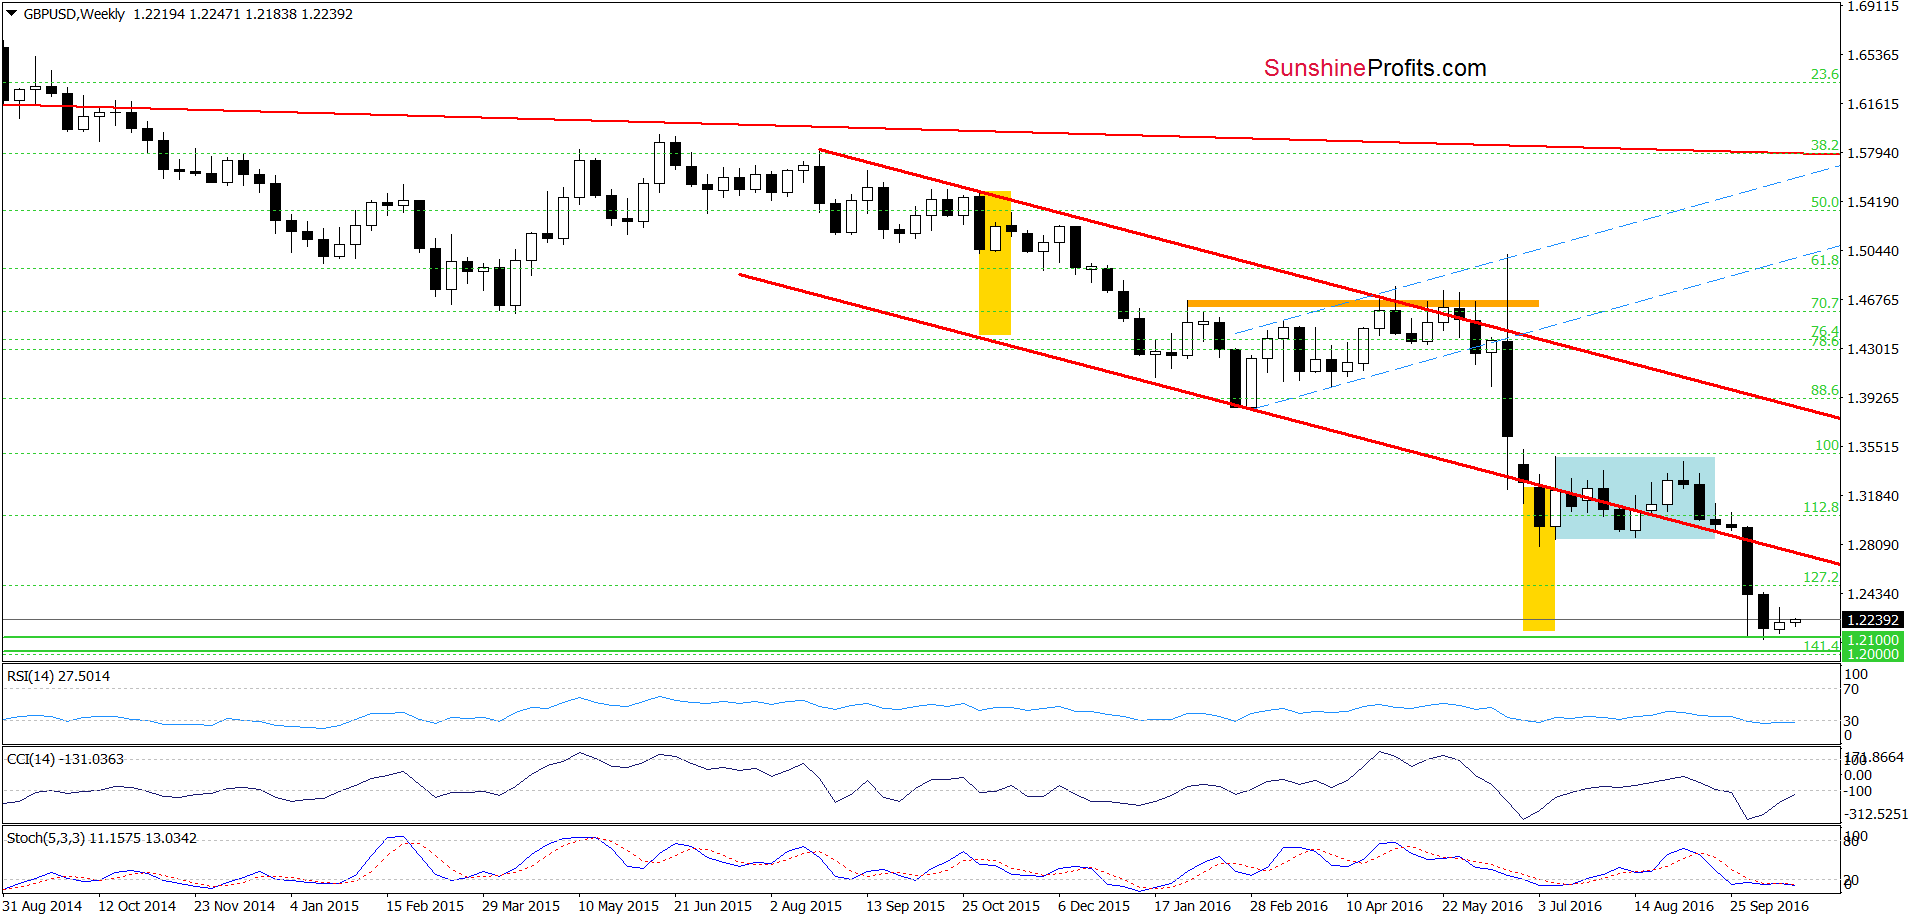
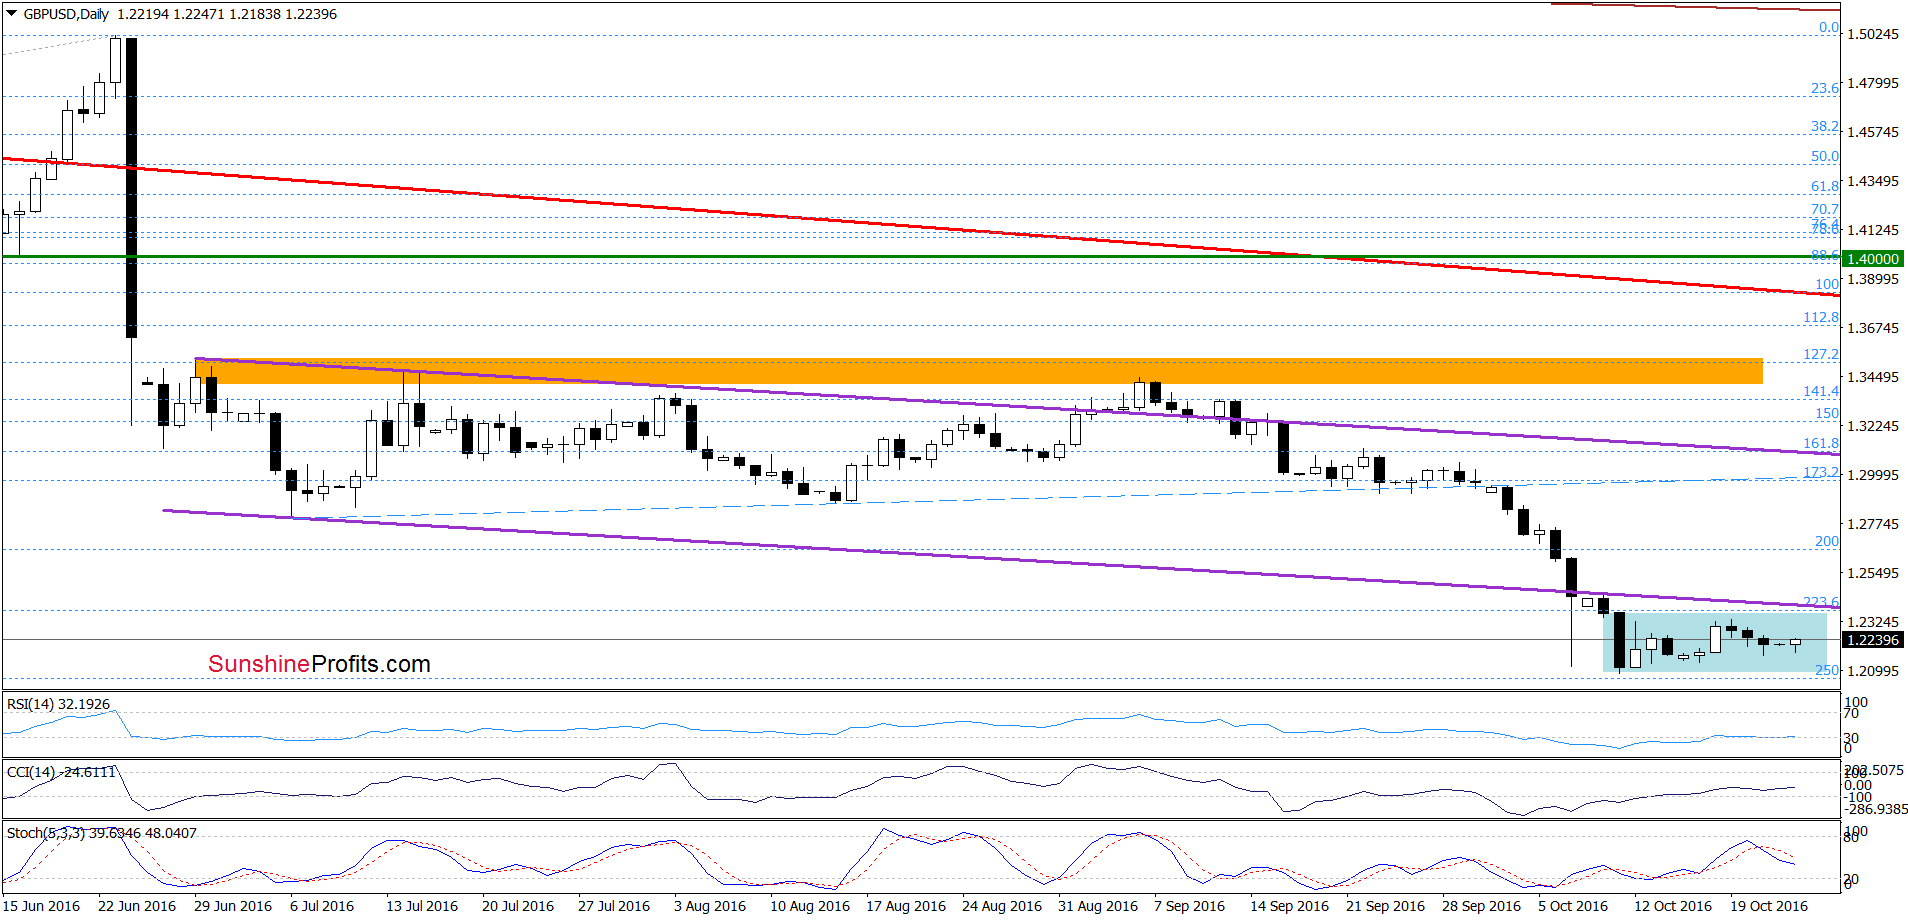
Looking at the above charts, we see that although GBP/USD moved little higher earlier today, a sell signal generated by the Stochastic Oscillator remain in play, supporting currency bears. Additionally, the exchange rate is still trading in a blue consolidation under the previously-broken lower border of the purple declining trend channel, which means that as long as there won’t be a breakout above the upper line of the formation o a breakdown under the lower line, another bigger move is not likely to be seen and short-lived moves in both directions should not surprise us.
Very short-term outlook: mixed
Short-term outlook: mixed
MT outlook: mixed
LT outlook: bearish
Trading position (short-term; our opinion): No positions are justified from the risk/reward perspective. We will keep you informed should anything change, or should we see a confirmation/invalidation of the above.
USD/JPY
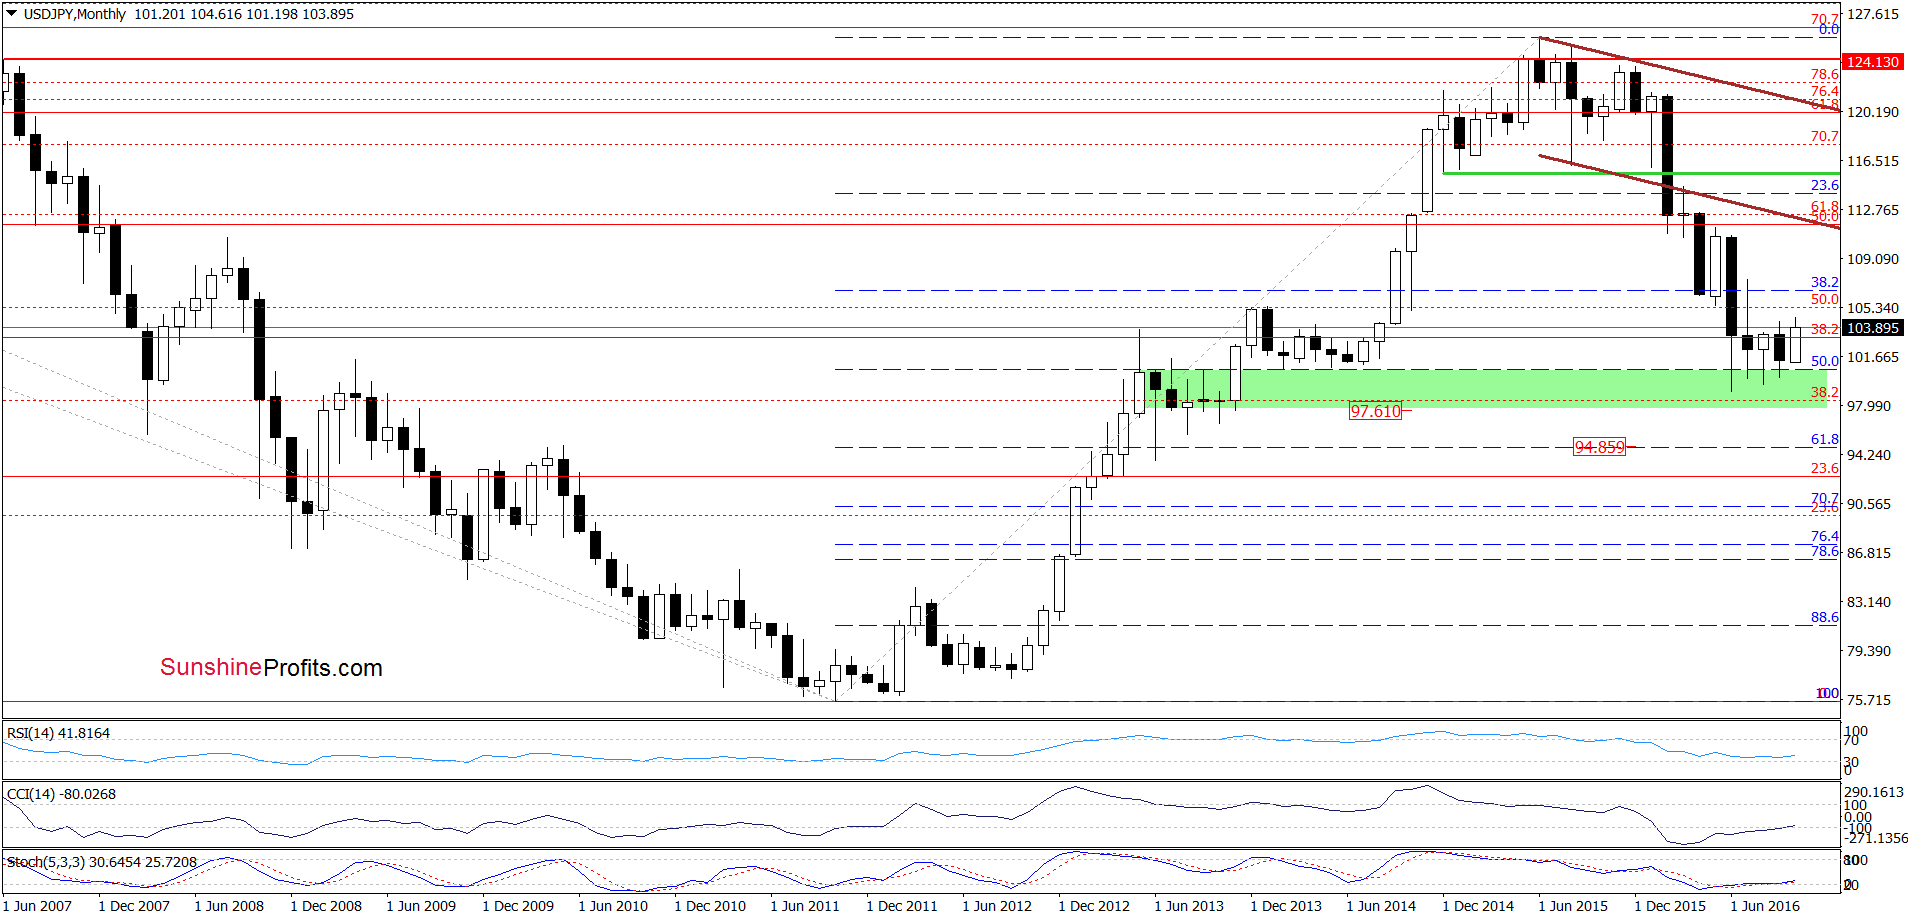
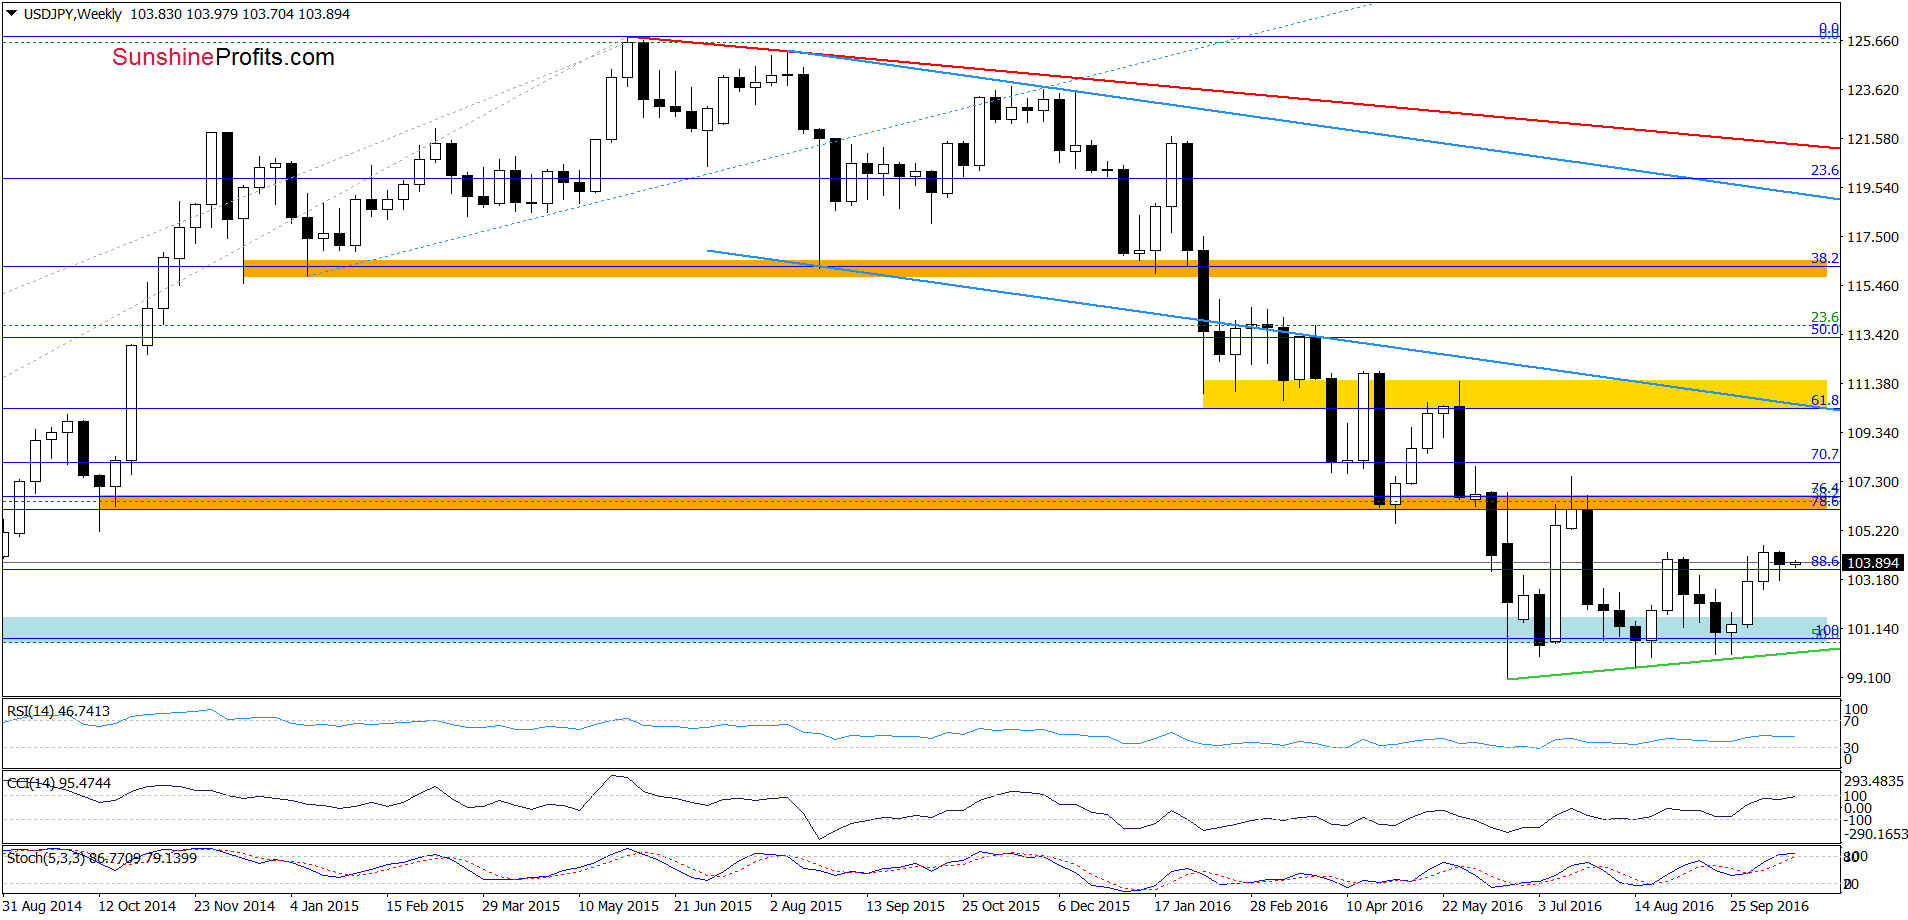
The situation in the long- and medium term hasn’t changed much as the exchange rate remains above the green support zone and the green support line based on the Jun and Aug lows. Today, we’ll focus on the very short-term changes.
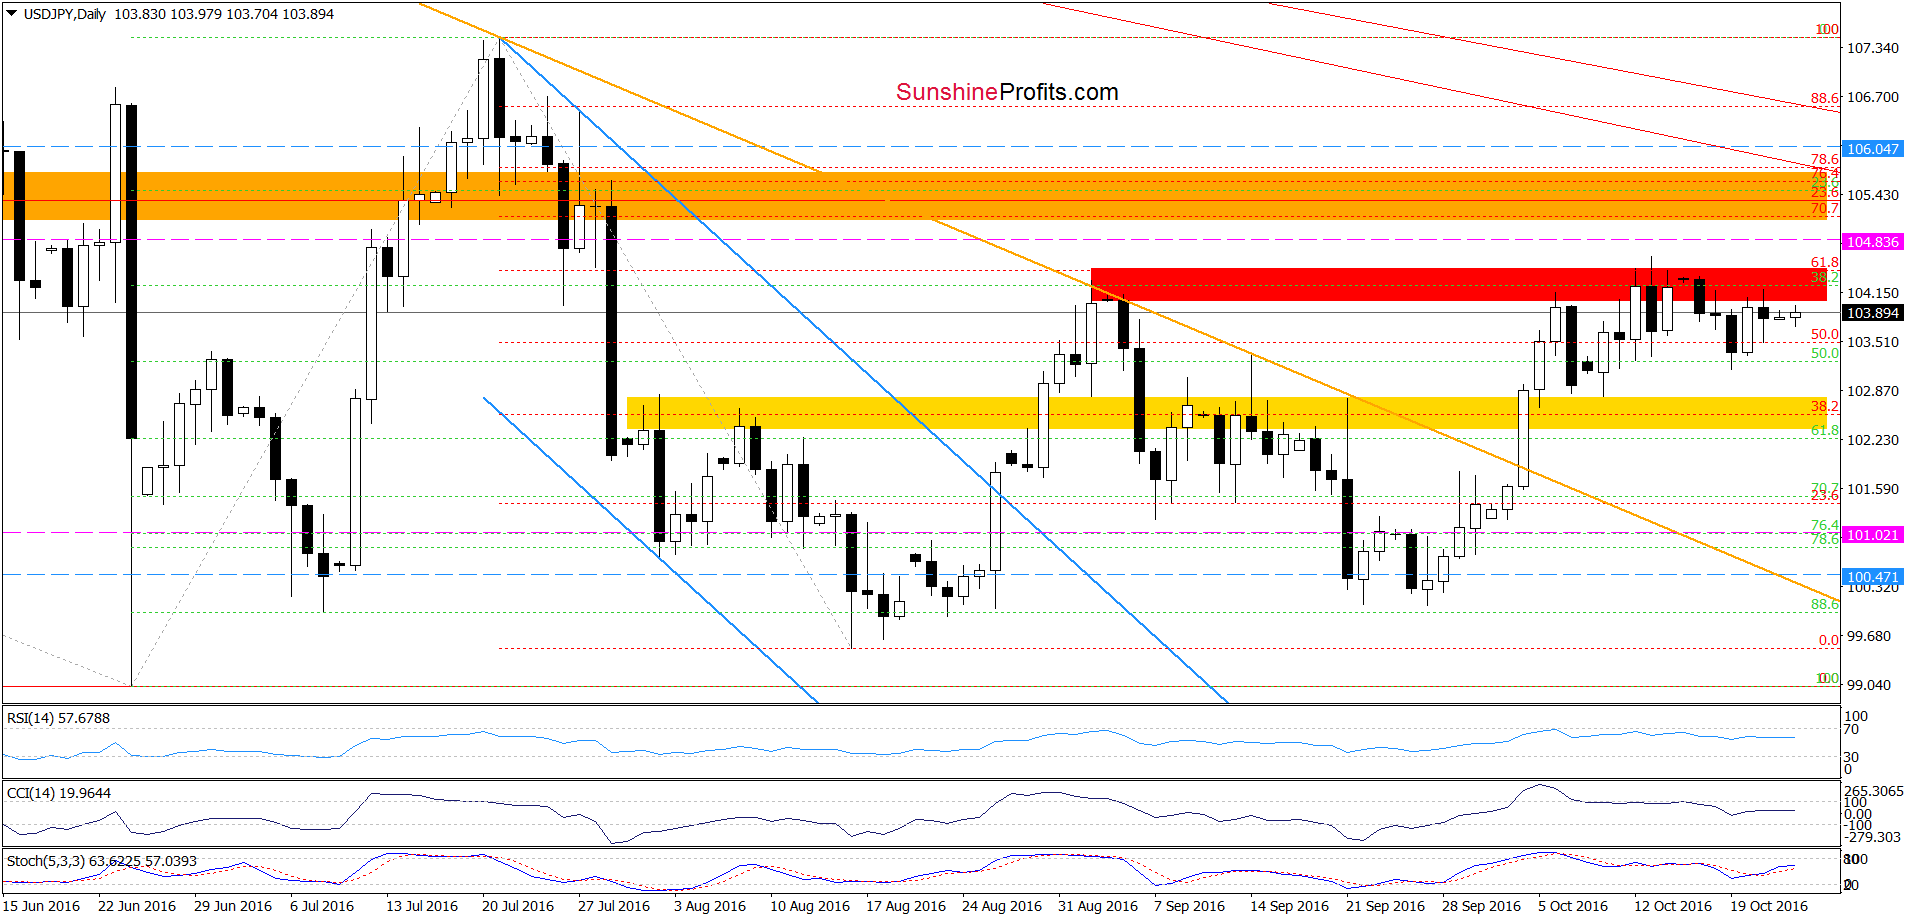
On the daily chart, we see that although USD/JPY moved little higher earlier today, the red resistance zone continues to keep gains in check, which suggests that another downswing and a test of the yellow zone is very likely. However if this area is broken, USD/JPY may test the late Sp lows and the previously-broken orange declining line, which serves now as another support.
Very short-term outlook: bearish
Short-term outlook: mixed with bearish bias
MT outlook: mixed
LT outlook: mixed
Trading position (short-term; our opinion): Short positions (with a stop-loss order at 104.84 and initial downside target at 101.02) are justified from the risk/reward perspective. We will keep you informed should anything change, or should we see a confirmation/invalidation of the above.
USD/CAD
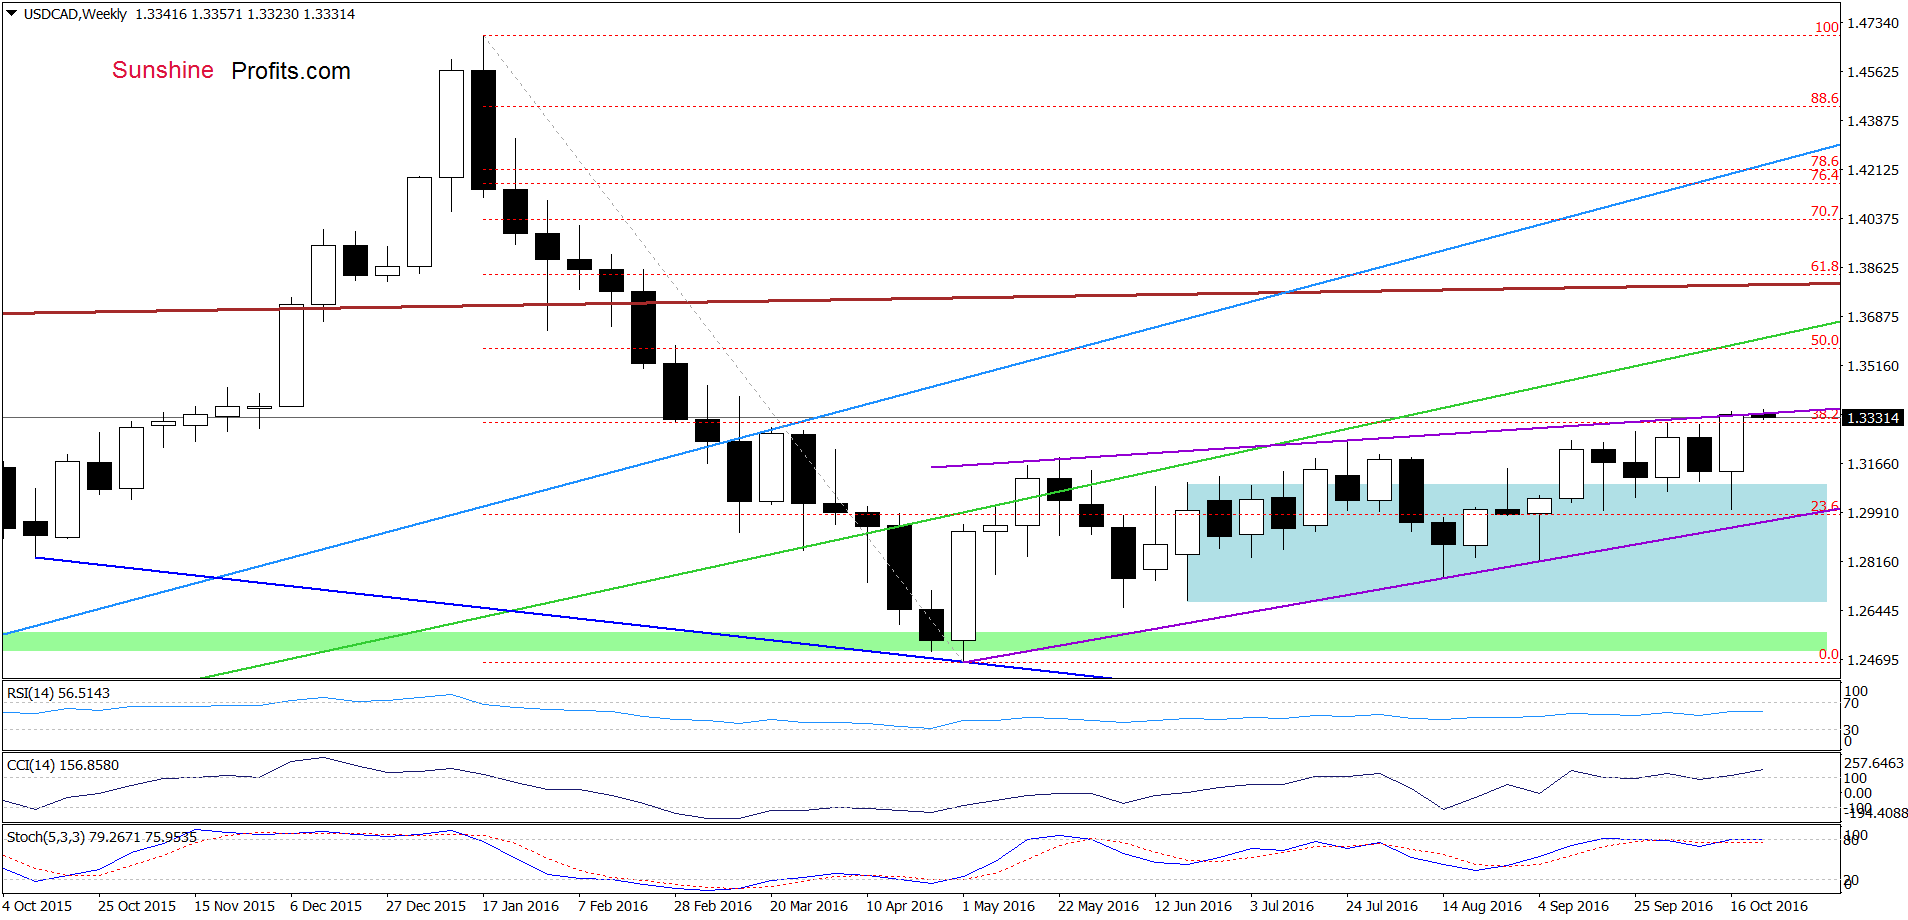
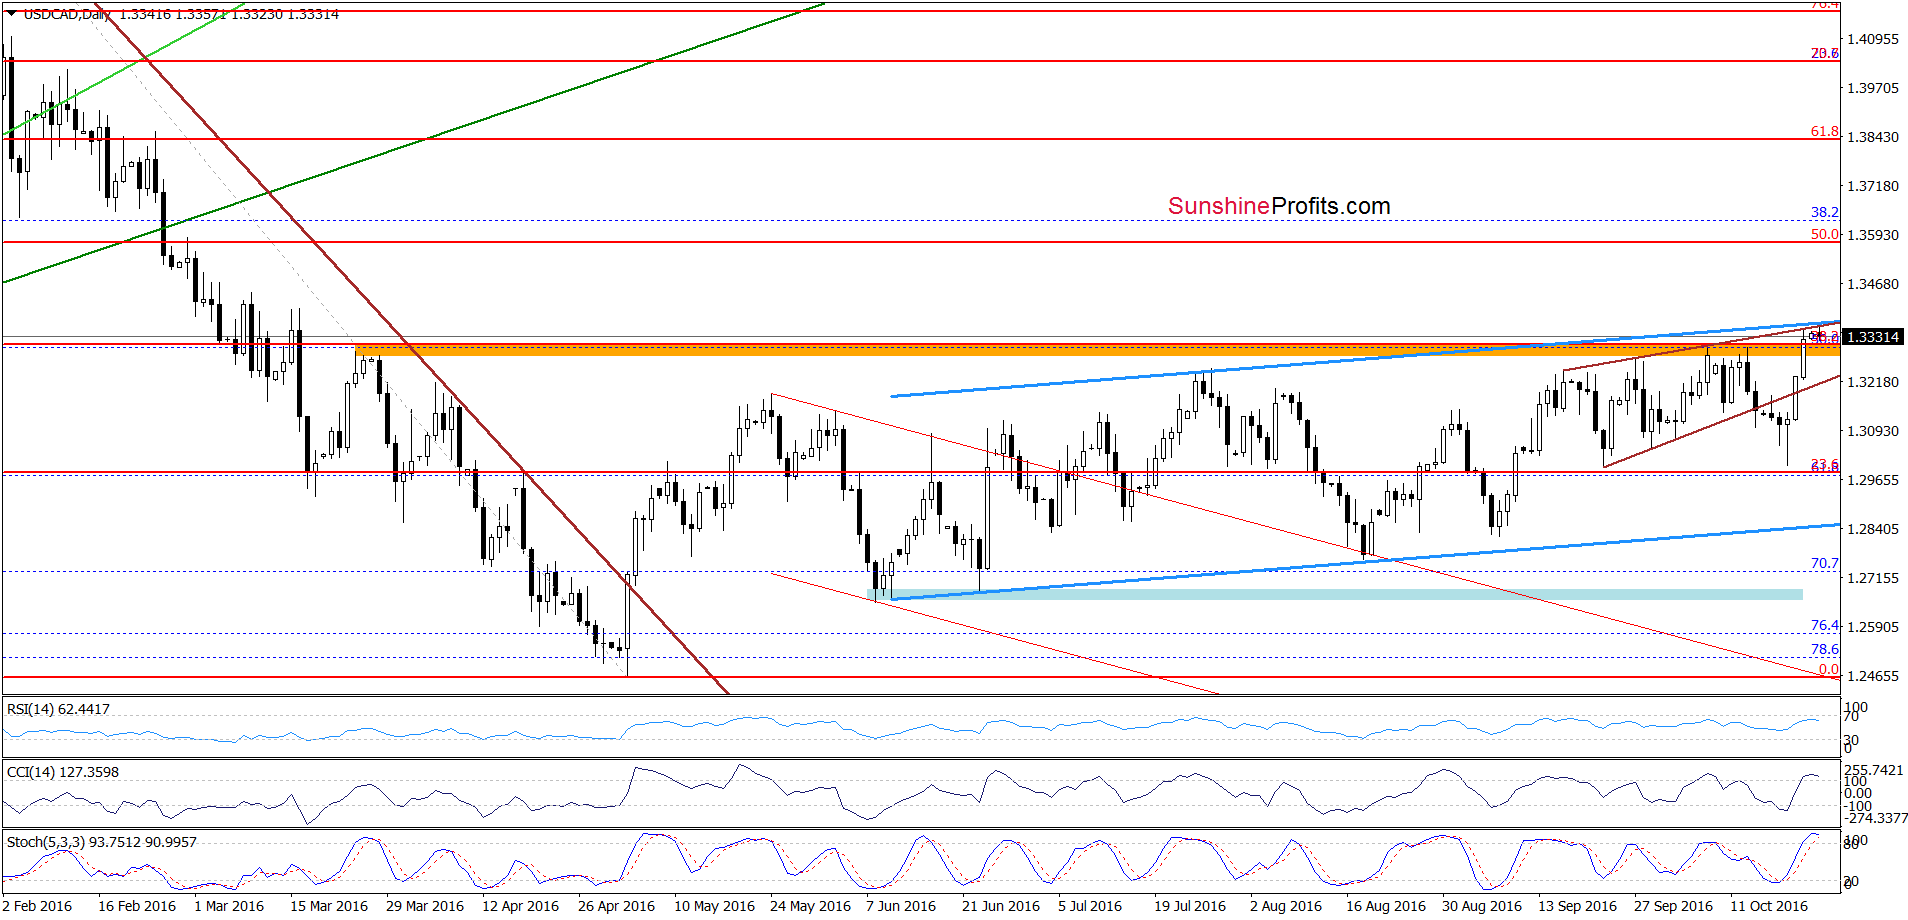
Looking at the above charts, we see that although USD/CAD broke above the orange resistance area, the pair reached a strong resistance zone created by the upper border of the purple rising wedge (marked on the weekly chart), the upper line of the blue rising trend channel (seen on the daily chart) and the 38.2% Fibonacci retracement based on the entire Jan-May downward move. Taking this fact into account and combining it with the current position of the weekly and daily indicators (in both cases, the CCI and Stochastic Oscillator are already overbought), we think that reversal and lower values of the exchange rate are just around the corner. If this is the case, and the pair declines from current levels, the initial downside target would be around 1.3127, where the 38.2% Fibonacci retracement (based on the mid-Aug – Oct upward move) currently is.
Very short-term outlook: mixed with bearish bias
Short-term outlook: mixed with bearish bias
MT outlook: mixed
LT outlook: mixed
Trading position (short-term; our opinion): No positions are justified from the risk/reward perspective. Nevertheless, if we see more bearish developments (like an invalidation of the breakout above the orange zone), we’ll consider re-opening short positions. We will keep you informed should anything change, or should we see a confirmation/invalidation of the above.
USD/CHF
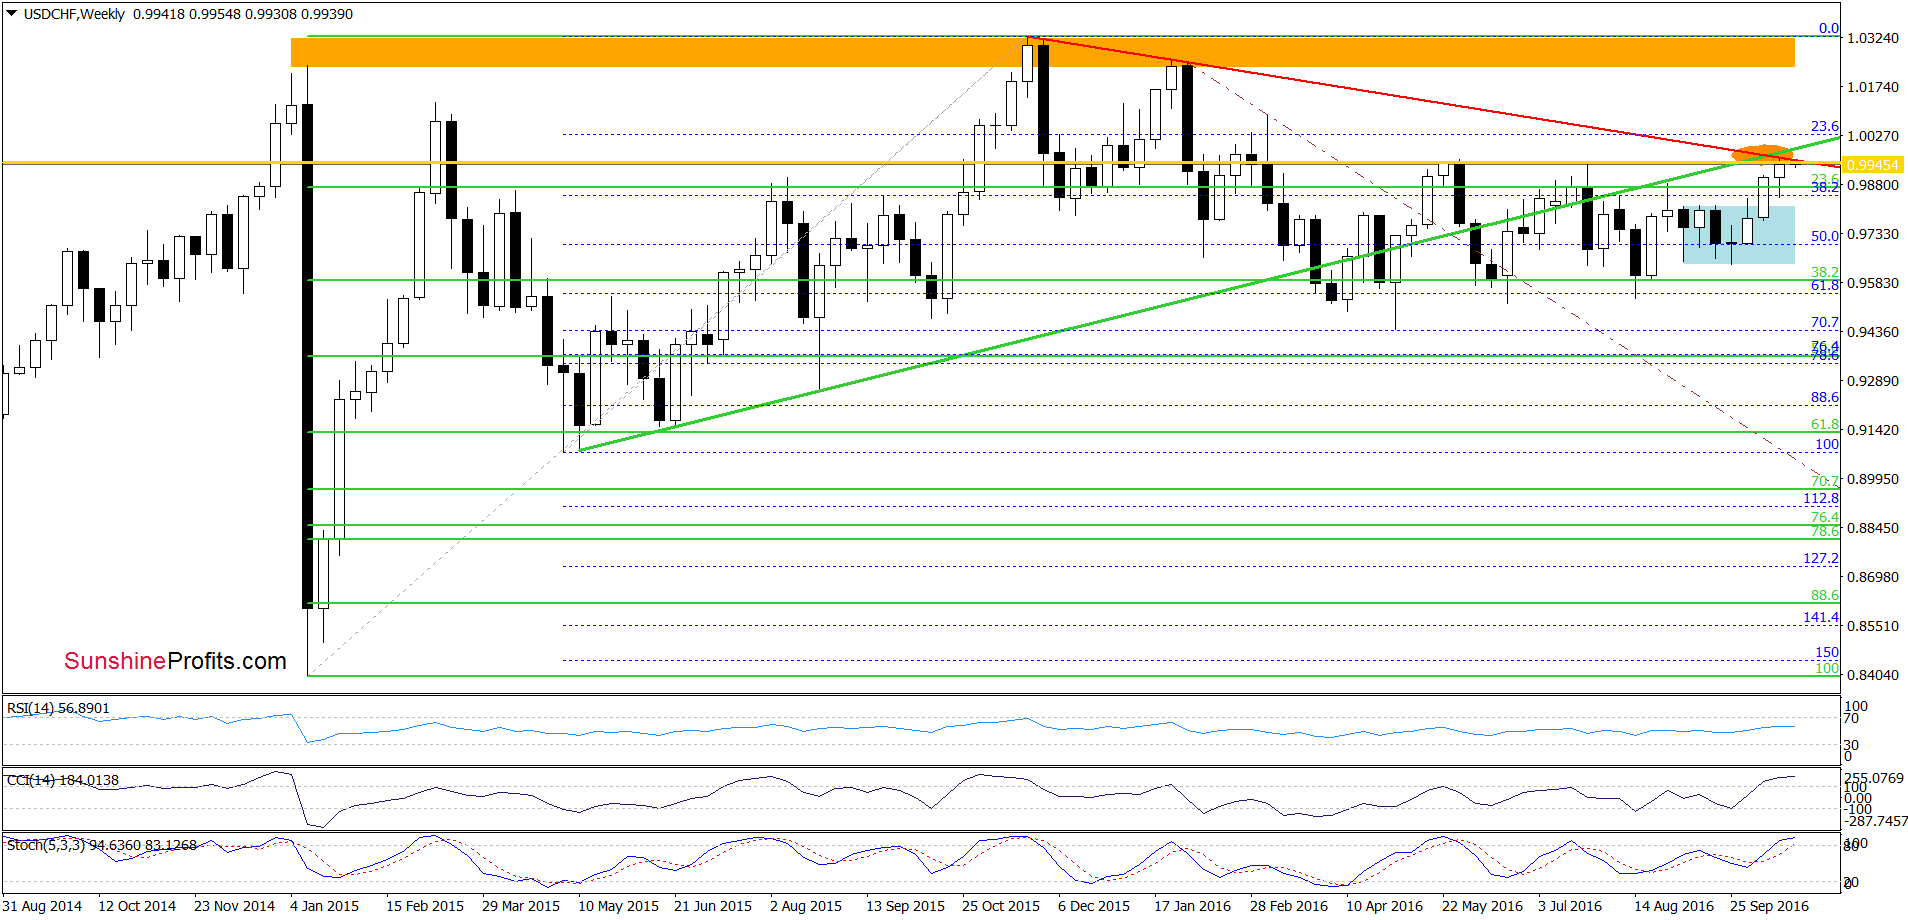
Looking at the weekly chart, we see that USD/CHF extended gains and reached the key resistance zone created by the long-term red declining resistance line based on the Nov and Feb highs, the green rising line based on the May and Aug 2015 lows and May and Jul highs (marked with orange ellipse). How did this move affect the very short-term picture? Let’s check.
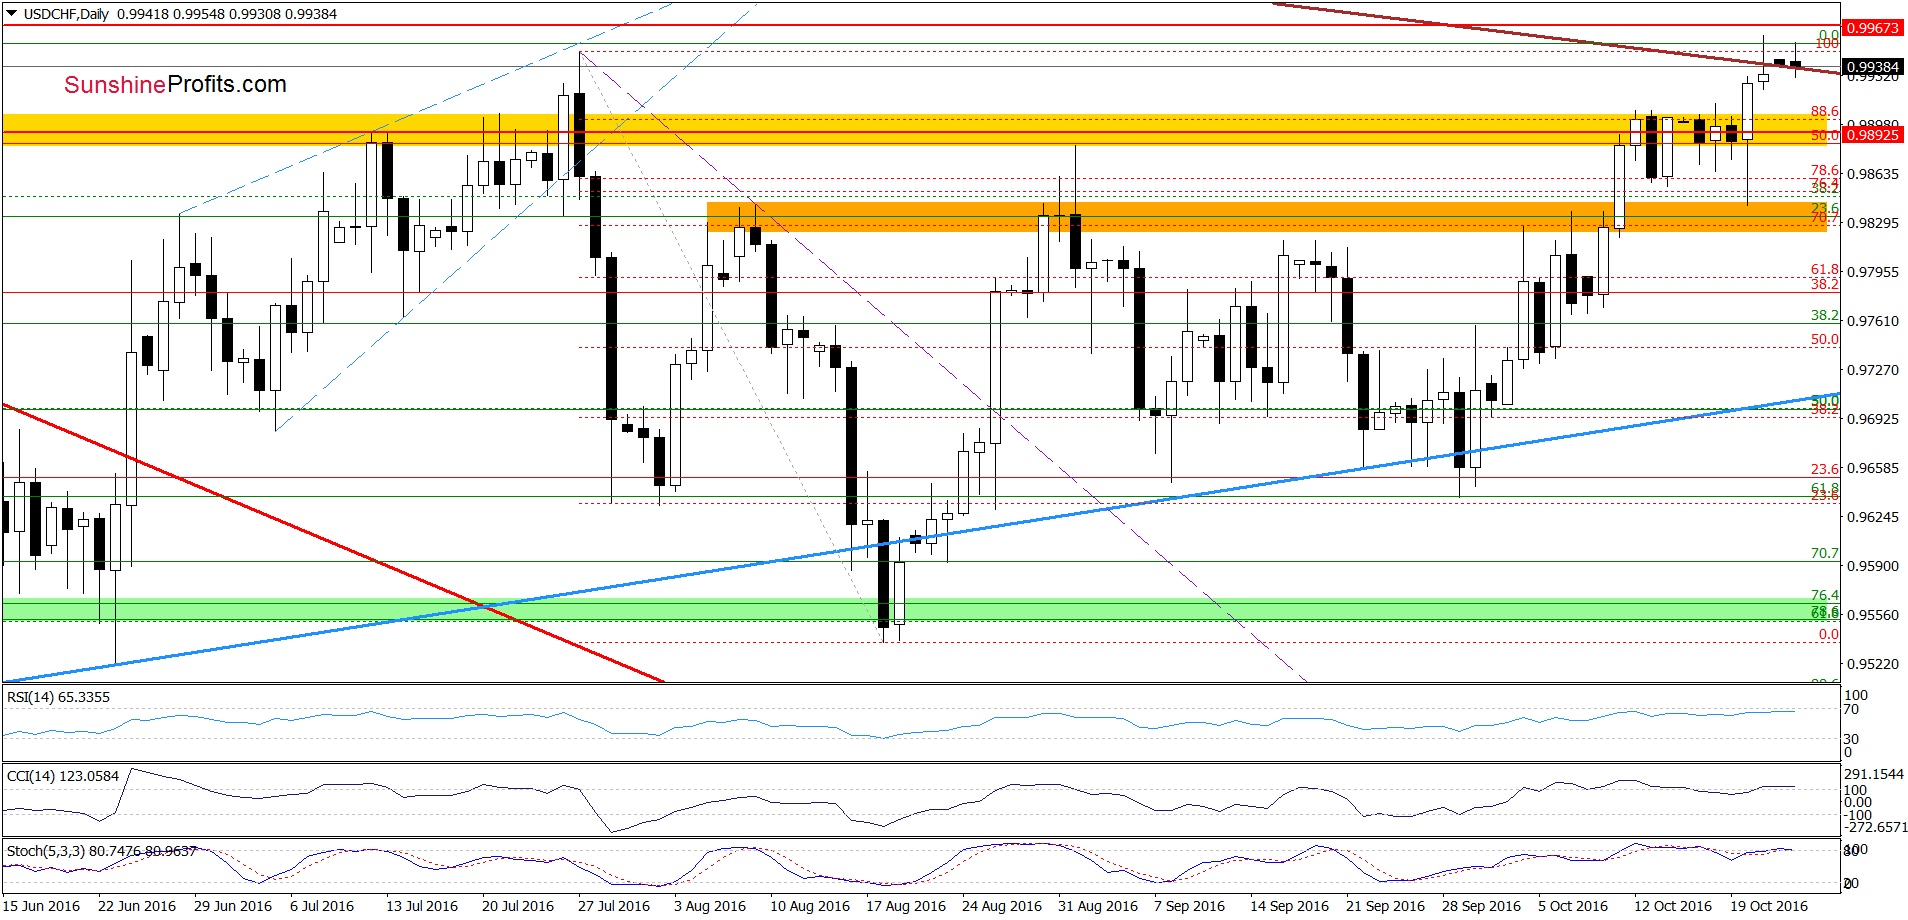
Looking at the daily chart, we see that USD/CHF broke above the yellow resistance zone and climbed slightly above the Jul high. Despite this improvement, currency bulls didn’t manage to hold gained levels, which resulted in a pullback that invalidated this breakout. Earlier today, we saw similar price action, which doesn’t bode well for the exchange rate. Additionally, the CCI and Stochastic Oscillator are very close to generating sell signals, which in combination with the above and the medium-term picture suggests further deterioration in the coming week. Therefore, if the pair moves lower from current levels the initial downside target would be around 0.9841, where the Thursday’s low is.
Very short-term outlook: bearish
Short-term outlook: mixed with bearish bias
MT outlook: mixed
LT outlook: mixed
Trading position (short-term; our opinion): Short positions (with a stop-loss order at 1.0000 and initial downside target at 0.9841) are justified from the risk/reward perspective. However, if we see another unsuccessful attempt to break above the yellow resistance zone, we’ll consider opening short positions. We will keep you informed should anything change, or should we see a confirmation/invalidation of the above.
AUD/USD
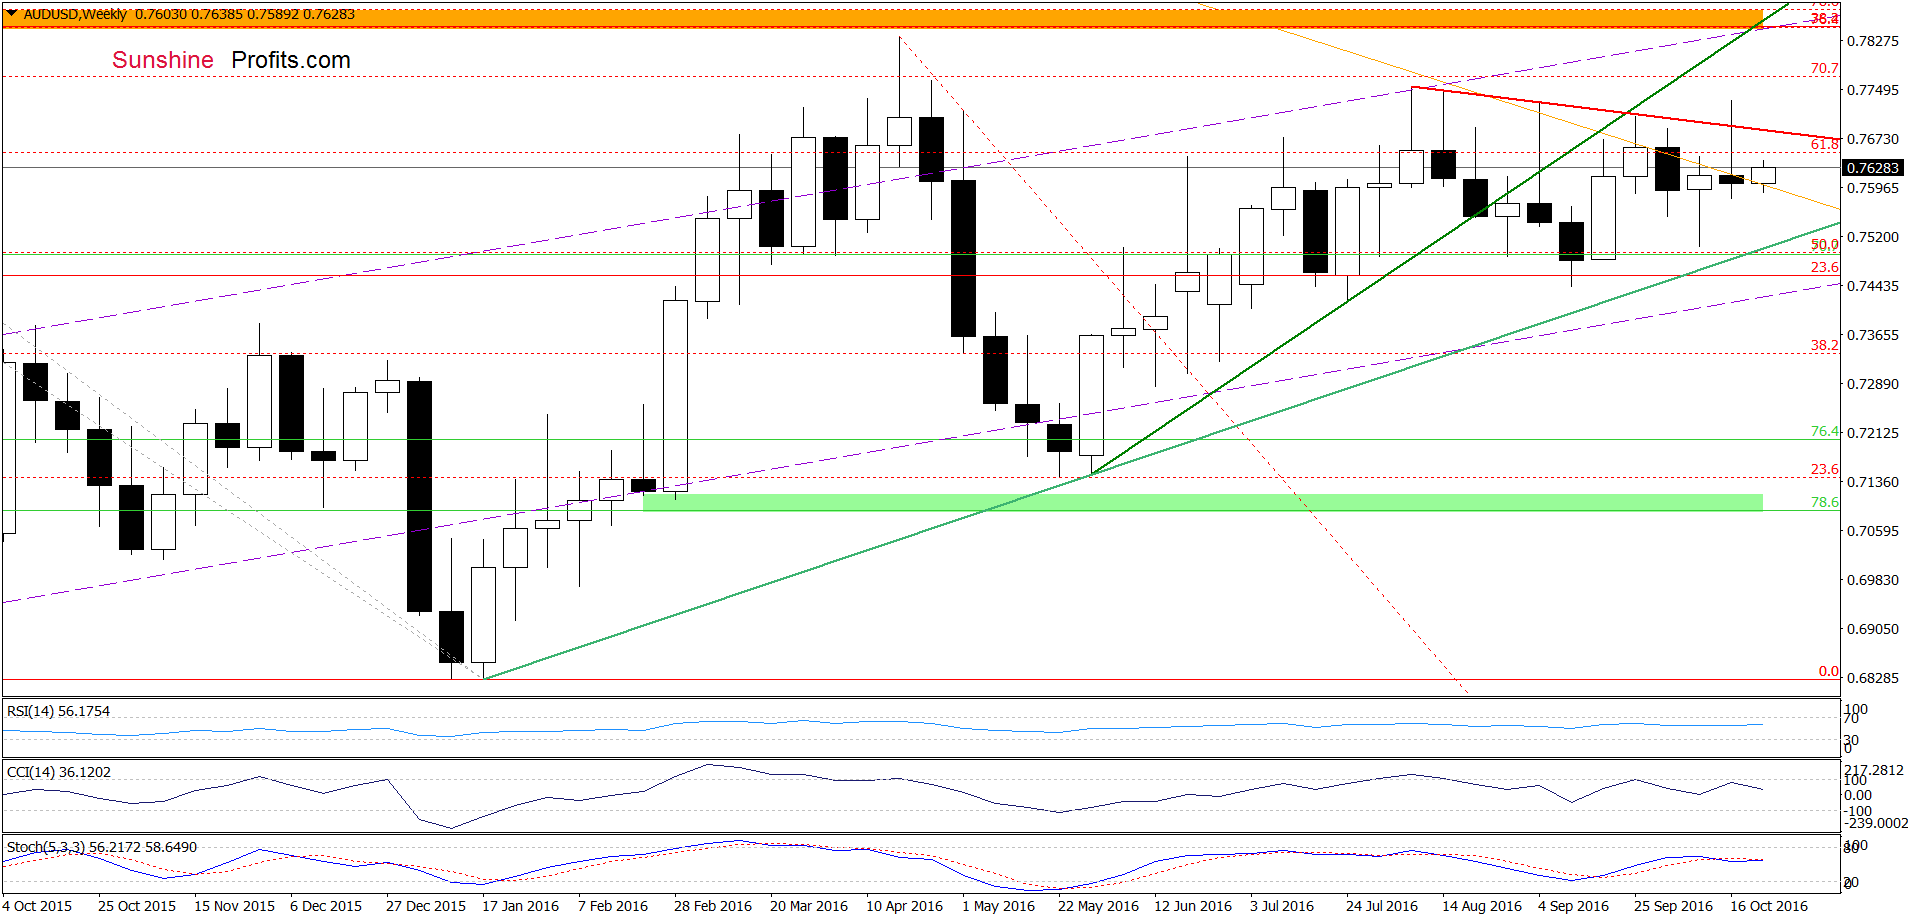
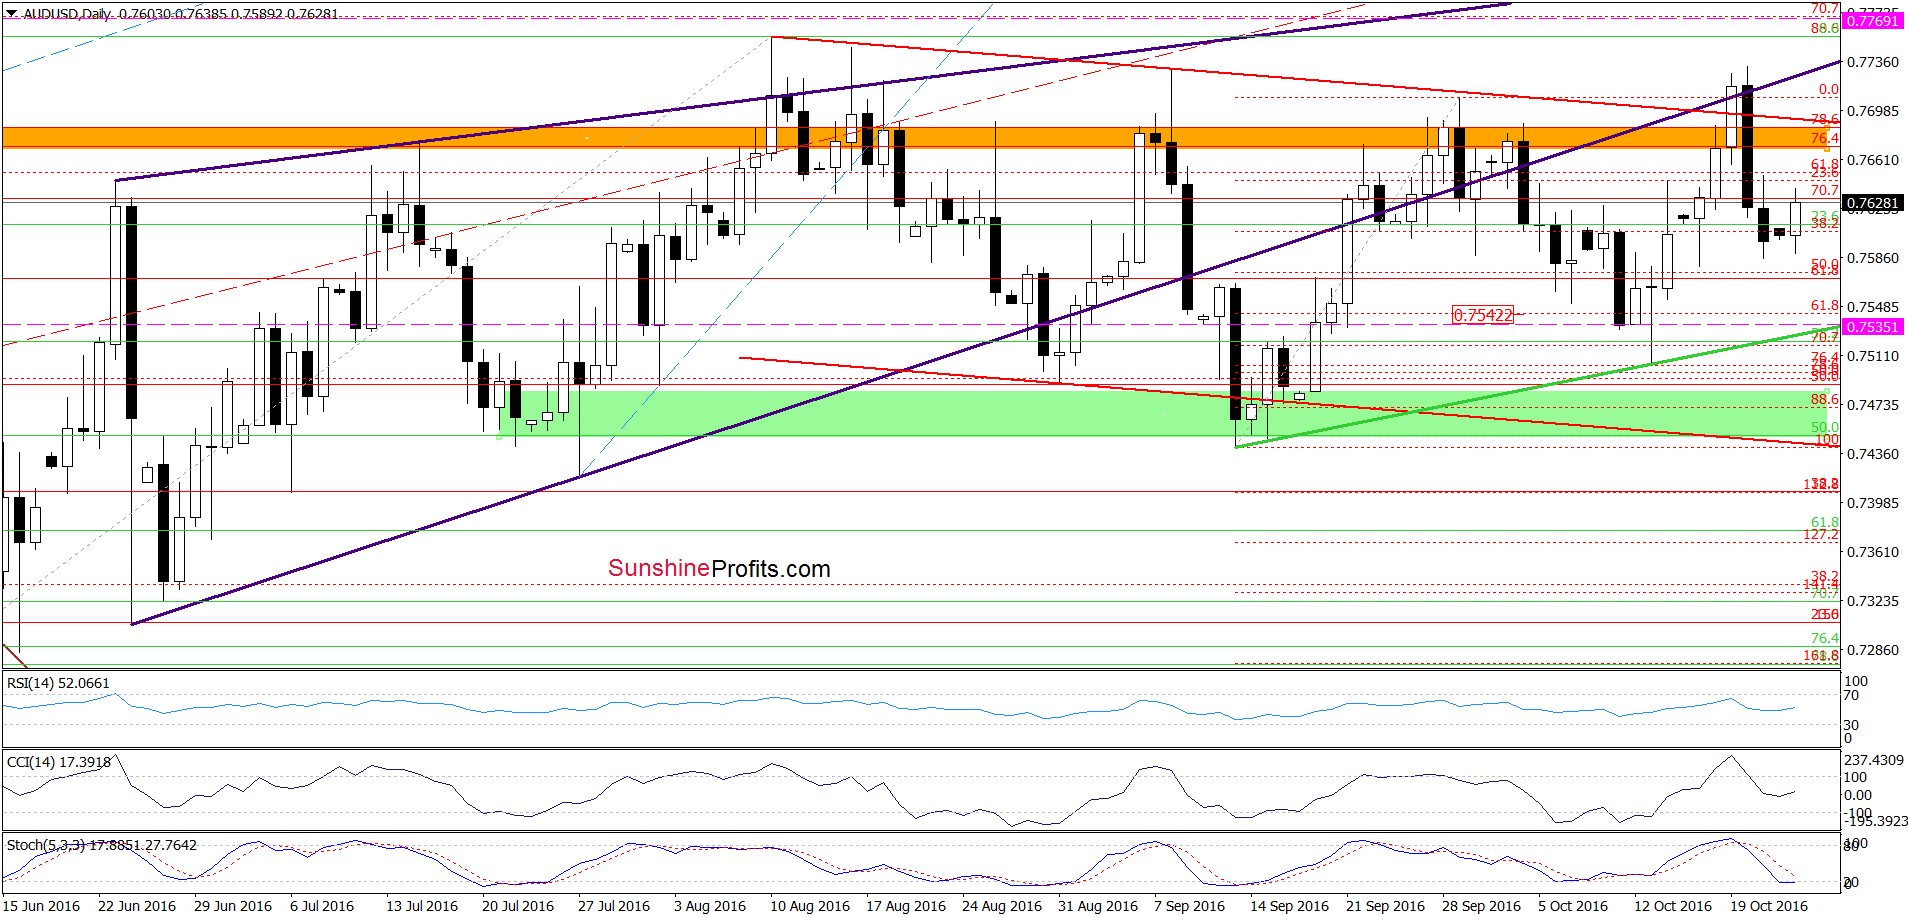
Looking at the above charts, we see that although AUD/USD moved little higher earlier today, the pair is trading under the orange resistance zone, the red declining resistance line and well below the lower border of the rising purple wedge. Additionally, sell signals generated by the indicators remain in place, supporting further deterioration in the coming days. If his is the case and AUD/USD moves lower from here, the initial downside target would be around 0.7542, where the 61.8% Fibonacci retracement (based on the recent upward move) is.
Very short-term outlook: bearish
Short-term outlook: mixed with bearish bias
MT outlook: mixed
LT outlook: mixed
Trading position (short-term; our opinion): Short positions (with a stop-loss order at 0.7769 and initial downside target at 0.7542) are justified from the risk/reward perspective. We will keep you informed should anything change, or should we see a confirmation/invalidation of the above.
Thank you.
Nadia Simmons
Forex & Oil Trading Strategist
Przemyslaw Radomski, CFA
Founder, Editor-in-chief, Gold & Silver Fund Manager
Gold & Silver Trading Alerts
Forex Trading Alerts
Oil Investment Updates
Oil Trading Alerts

