

Earlier today, the U.S. currency erased some of yesterday’s losses against other major currencies as investors turned their attention to the upcoming nonfarm payrolls report. Before we know today’s data let’s focus on the technical picture of our six currency pairs. What are they saying about greenback’s future moves?
In our opinion the following forex trading positions are justified - summary:
- EUR/USD: long (stop-loss at 1.1056; initial upside target at 1.1304)
- GBP/USD: short (a stop-loss at 1.3579; initial downside target at 1.2519)
- USD/JPY: short (stop-loss at 106.04; initial downside target at 100.47)
- USD/CAD: short (stop-loss at 1.3237; initial downside target at 1.2877)
- USD/CHF: short (stop-loss at 0.9935; initial downside target at 0.9630)
- AUD/USD: none
EUR/USD
Quoting our yesterday’s alert:
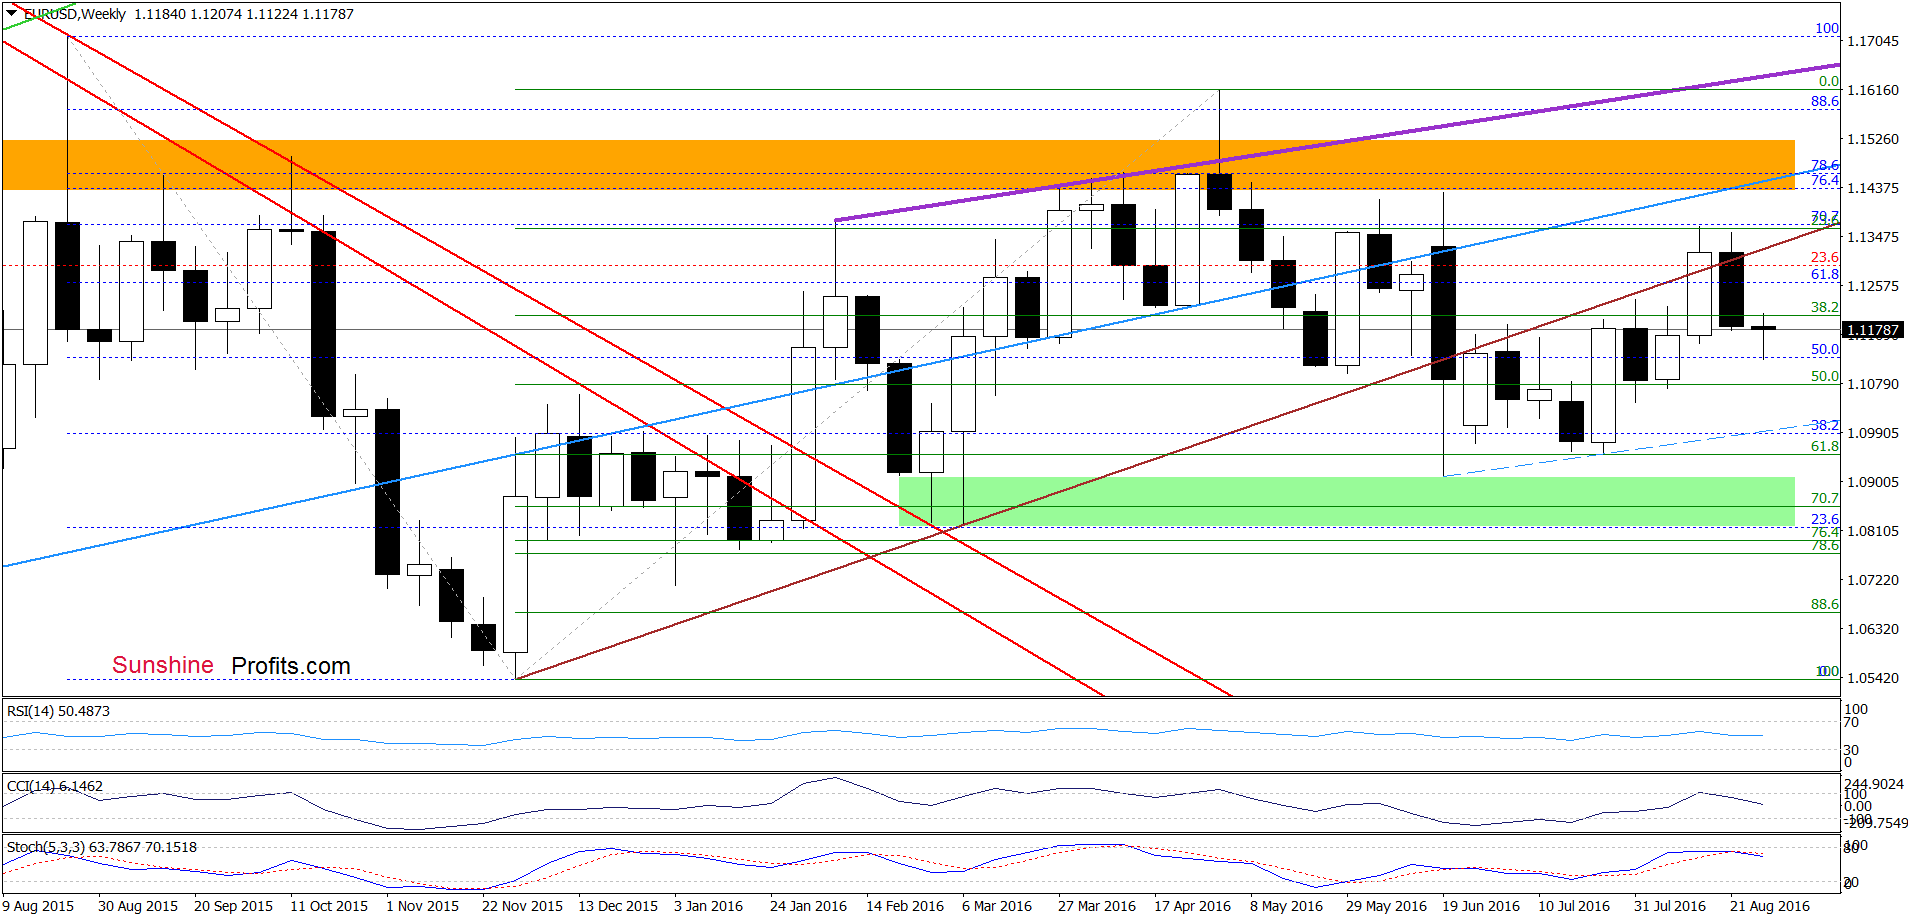
(…) EUR/USD is still trading in a narrow range under the previously-broken upper border of the red declining trend channel. Although such breakdown is a negative signal, currency bulls do not give up and keep the exchange rate around the 50% Fibonacci retracement (based on the entire Jun-Aug upward move). Additionally, the CCI and Stochastic Oscillator are oversold, which suggests that the space for declines may be limited and reversal in the coming days (quite possible tomorrow) should not surprise us.
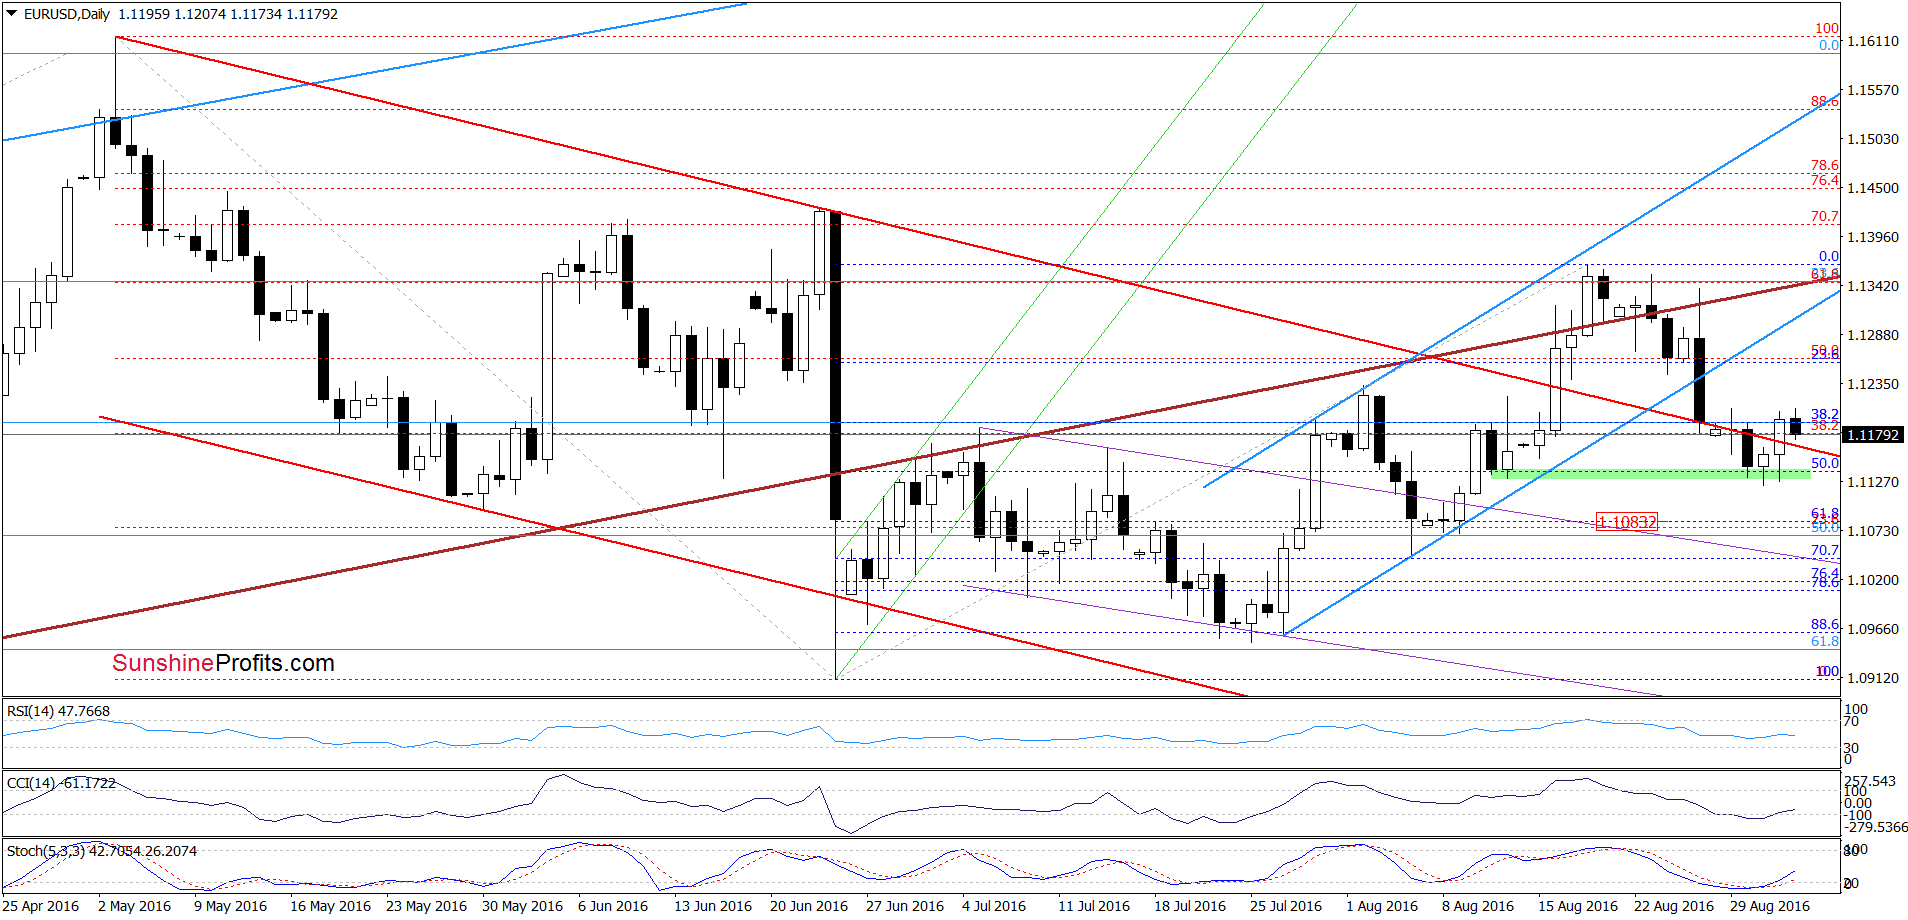
From today’s point of view, we see that currency bulls came back and pushed EUR/USD higher as we had expected. With yesterday’s increase the exchange rate increased above the previously-broken upper border of the red declining trend channel, invalidating earlier breakdown. This is a positive even, which in combination with buy signals generated by the CCI and Stochastic Oscillator suggests further improvement in the coming days. If this is the case, and the pair extends gains, the first upside target would be around 1.1304, where the previously-broken lower border of the blue rising trend channel currently is. If it is broken, we’ll see a test of the brown resistance line in the following days (currently at 1.1337).
Very short-term outlook: bullish
Short-term outlook: mixed with bullish bias
MT outlook: mixed
LT outlook: mixed
Trading position (short-term; our opinion): Long positions (with a stop-loss order at 1.1056 and initial upside target at 1.1304) are justified from the risk/reward perspective. We will keep you informed should anything change, or should we see a confirmation/invalidation of the above.
GBP/USD
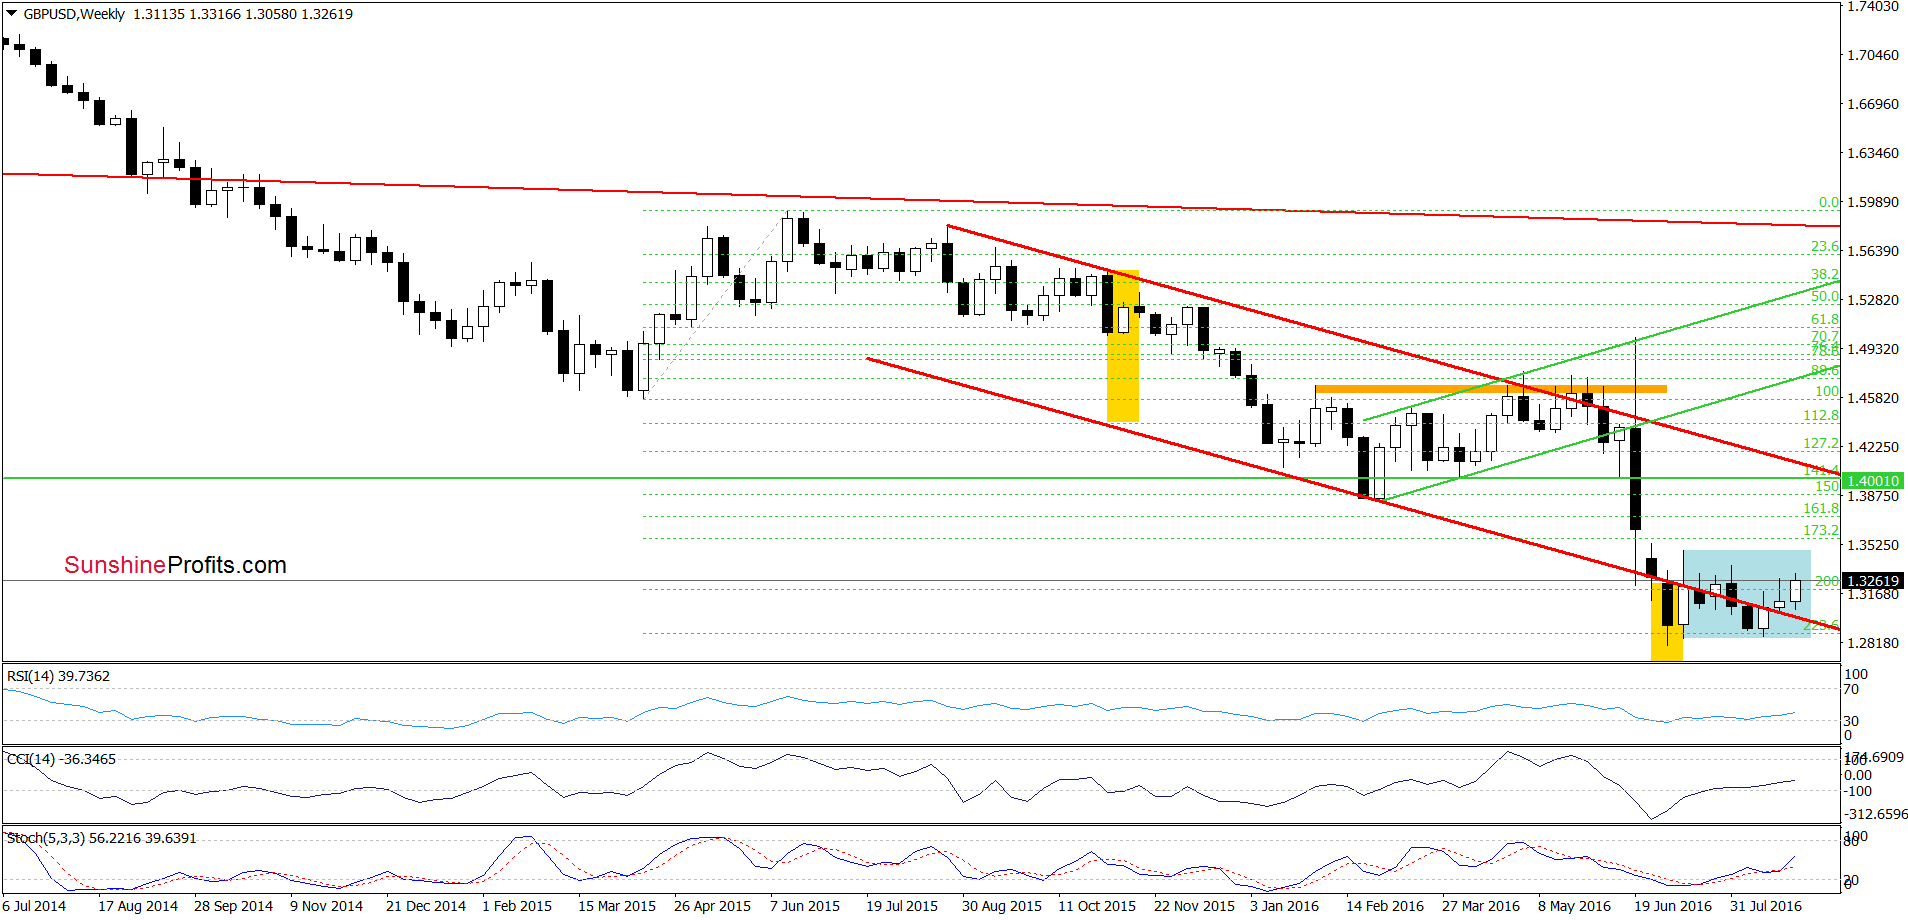
From the medium-term perspective, we see that although GBP/USD moved higher earlier this week, the overall situation hasn’t changed much as the exchange rate remains in the blue consolidation.
Where will the pair head next? Let’s examine the charts below and find out.
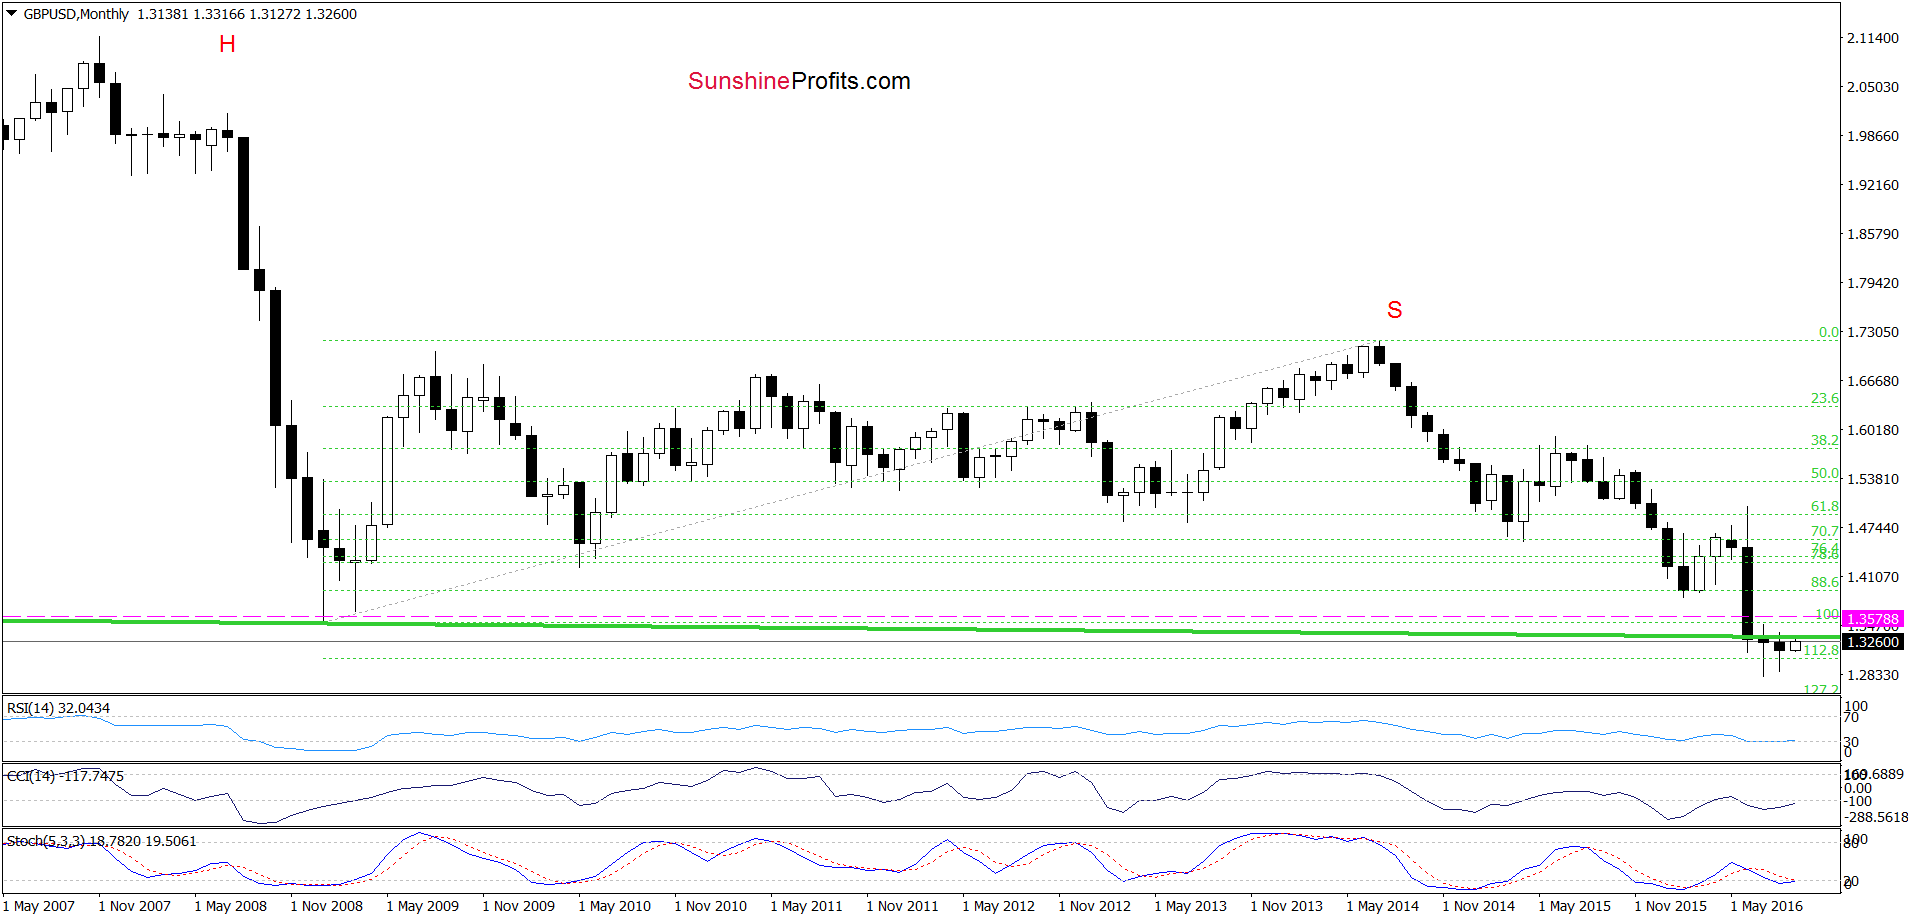
Looking at the monthly chart, we see that the long-term picture also hasn’t changed much, because although GBP/USD increased, the previusly-broken neck line of the head and shoulders formation continues to keep gains in check. With the recent upswing, the pair also reached the upper border of the purple declining trend channel marked on the chart below.
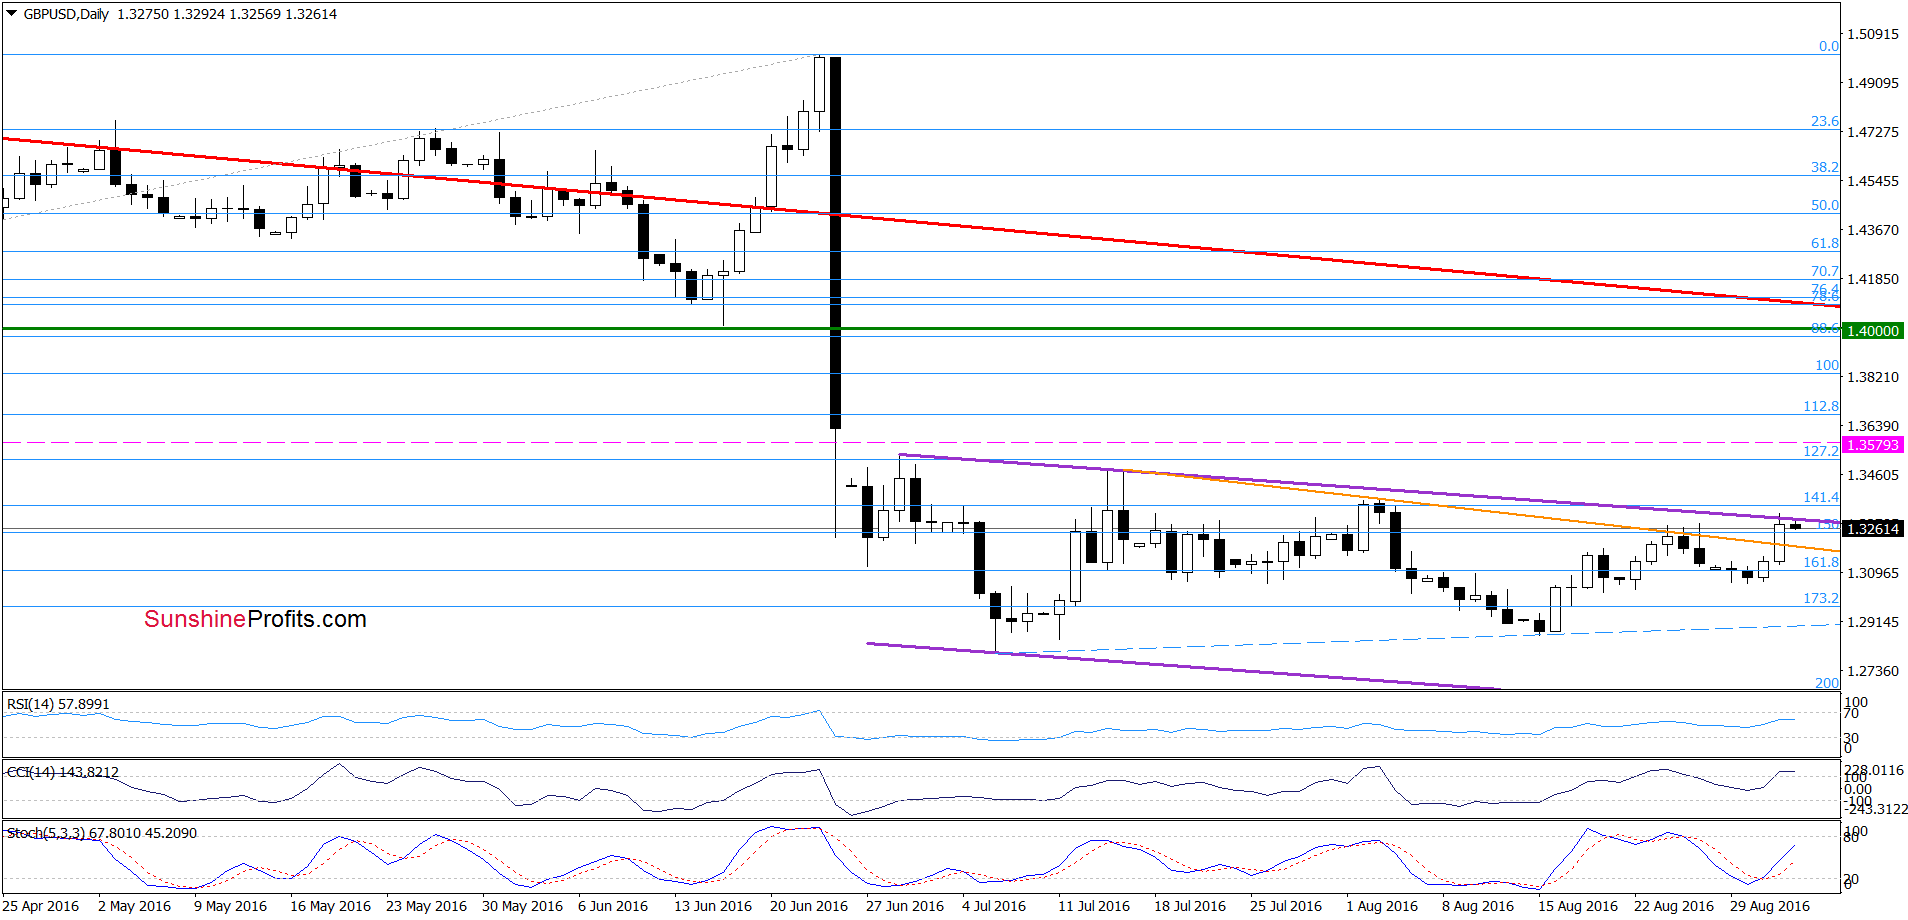
As you see, we saw similar situation several times in recent weeks. Back then, the proximity to this important resistance was enugh to encourage currency bears to act. Therefore, in our opinion, as long as there won’t be invalidation of the breakdown belw the neck line of the head and shoulders formation and confirmed breakout above the upper line of the above-mentioned trend channel another attempt to move lower is very likely. If this is the case and the pair declines from current levels, we’ll see a drop to around 1.2877, where the mid-Aug lows are.
Very short-term outlook: bearish
Short-term outlook: bearish
MT outlook: bearish
LT outlook: bearish
Trading position (short-term; our opinion): Short positions (with a stop-loss at 1.3579 and the initial downside target at 1.2519) are justified from the risk/reward perspective at the moment. We will keep you informed should anything change, or should we see a confirmation/invalidation of the above.
USD/JPY
The situation in the long- and medium-term persective hasn’t changed since our previous ommentery was posted. Today, we’ll focus on the very short-term picture.
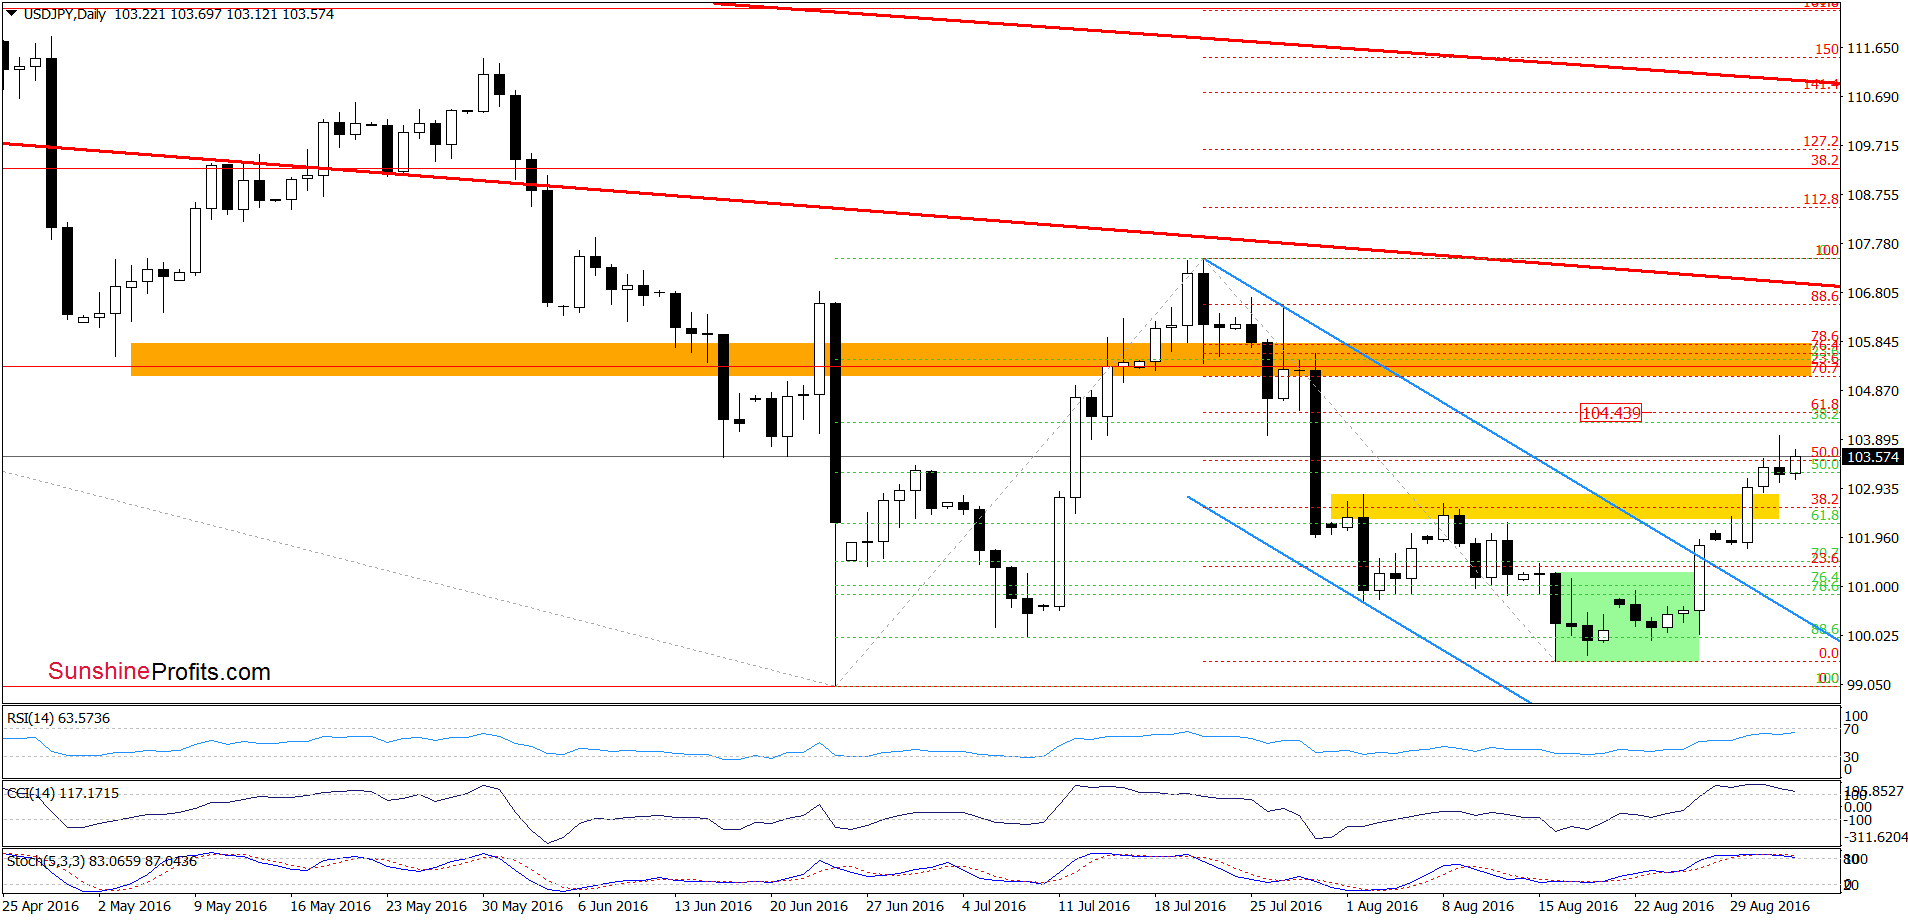
From today’s point of view, we see that USD/JPY is currently trading around yesterday’s levels, which means that our last commentary on this currency pair is up-to-date:
(…) USD/JPY broke not only above the yellow resistance zone, but also above the 50% Fibonacci retracement, which is a positive signal that suggests a climb to the next retracement around 104.44 or even to the orange resistance zone in the coming days. Nevertheless, we should keep in mind that the CCI and Stochastic Oscillator are overbought and very close to generating sell signals. Additionally, the RSI approached the level of 70, which suggests that reversal may be just around the corner.
Very short-term outlook: bearish
Short-term outlook: mixed with bearish bias
MT outlook: mixed
LT outlook: mixed
Trading position (short-term; our opinion): Short positions (with a stop-loss at 106.04 and the initial downside target at 100.47) are justified from the risk/reward perspective at the moment. We will keep you informed should anything change, or should we see a confirmation/invalidation of the above.
USD/CAD
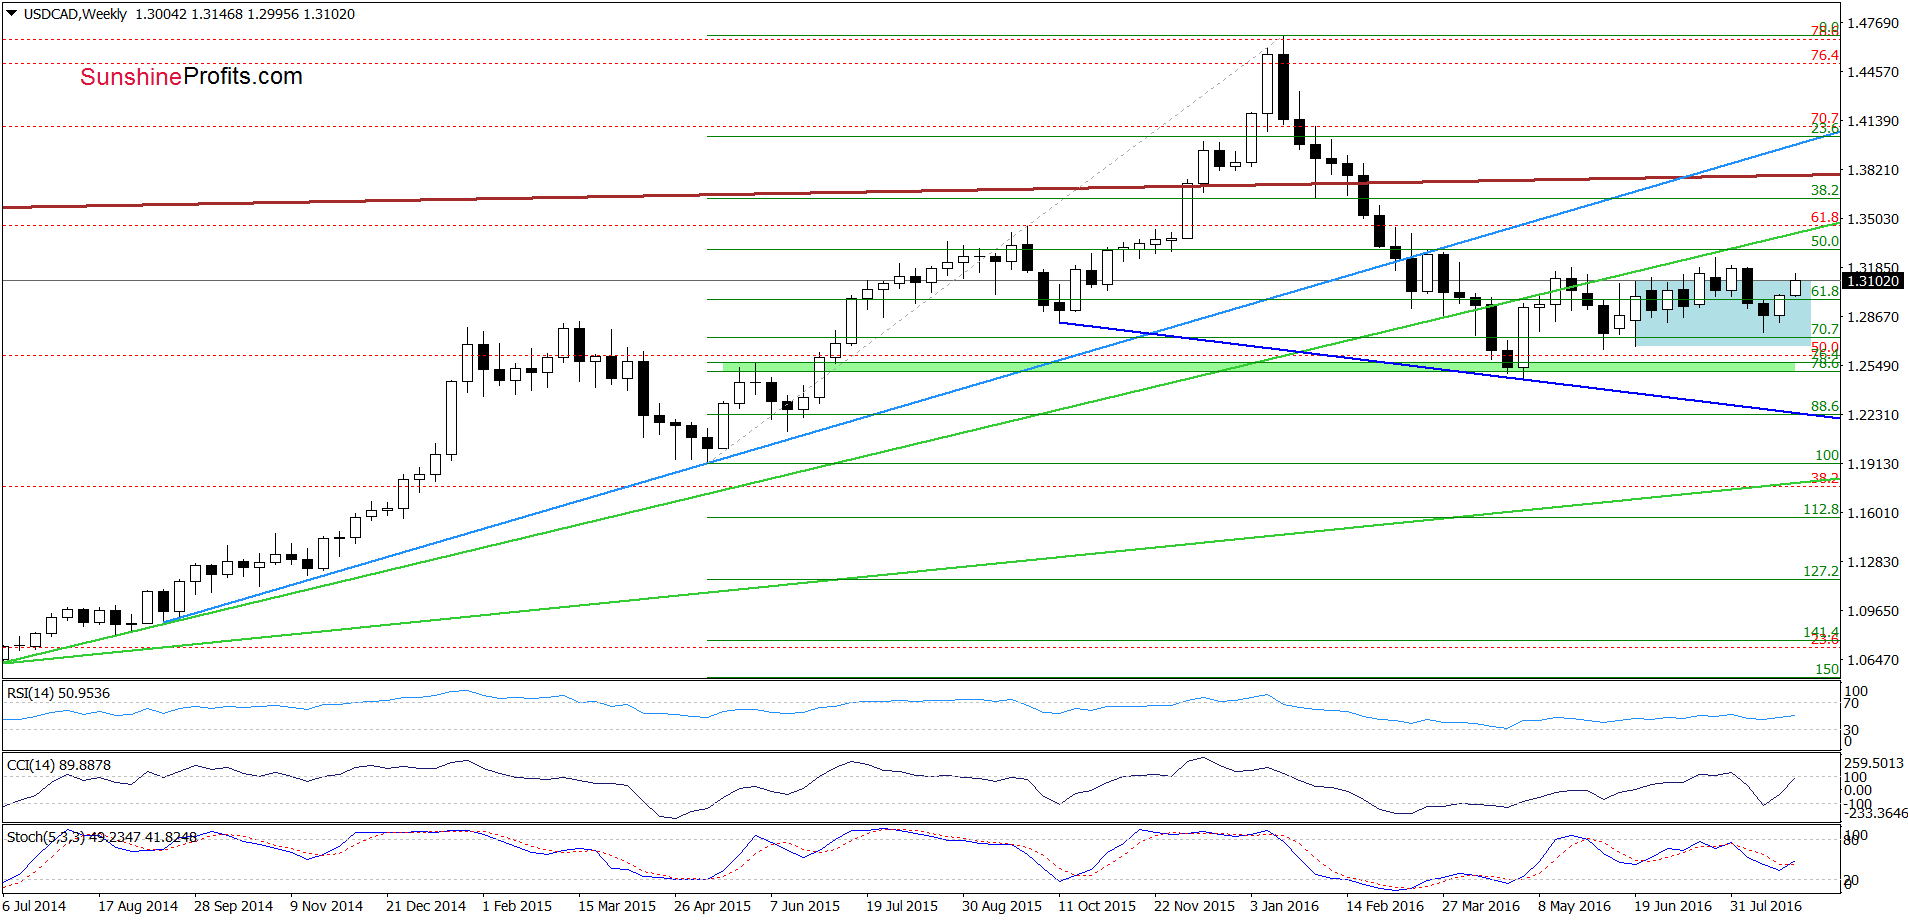
On the weekly chart, we see that USD/CAD gave up some gains and slipped to the upper border of the blue consolidation, which means that what we wrote yesterday remains valid:
(…) breakout above the upper border of the blue consolidation. Although this is a positive signal, we saw similar price action at the end of Jul. Back then, the proximity to the long-term green rising resistance line was enough to trigger a reversal and decline. Therefore, in our opinion, as long as there won’t be invalidation of the breakdown under this line another sizable move is not likely to be seen. Nevertheless, buy signal generated by the Stochastic Oscillator suggests that currency bulls will likely try to push the pair higher in the coming week(s). But will we see such improvement before a pullback?
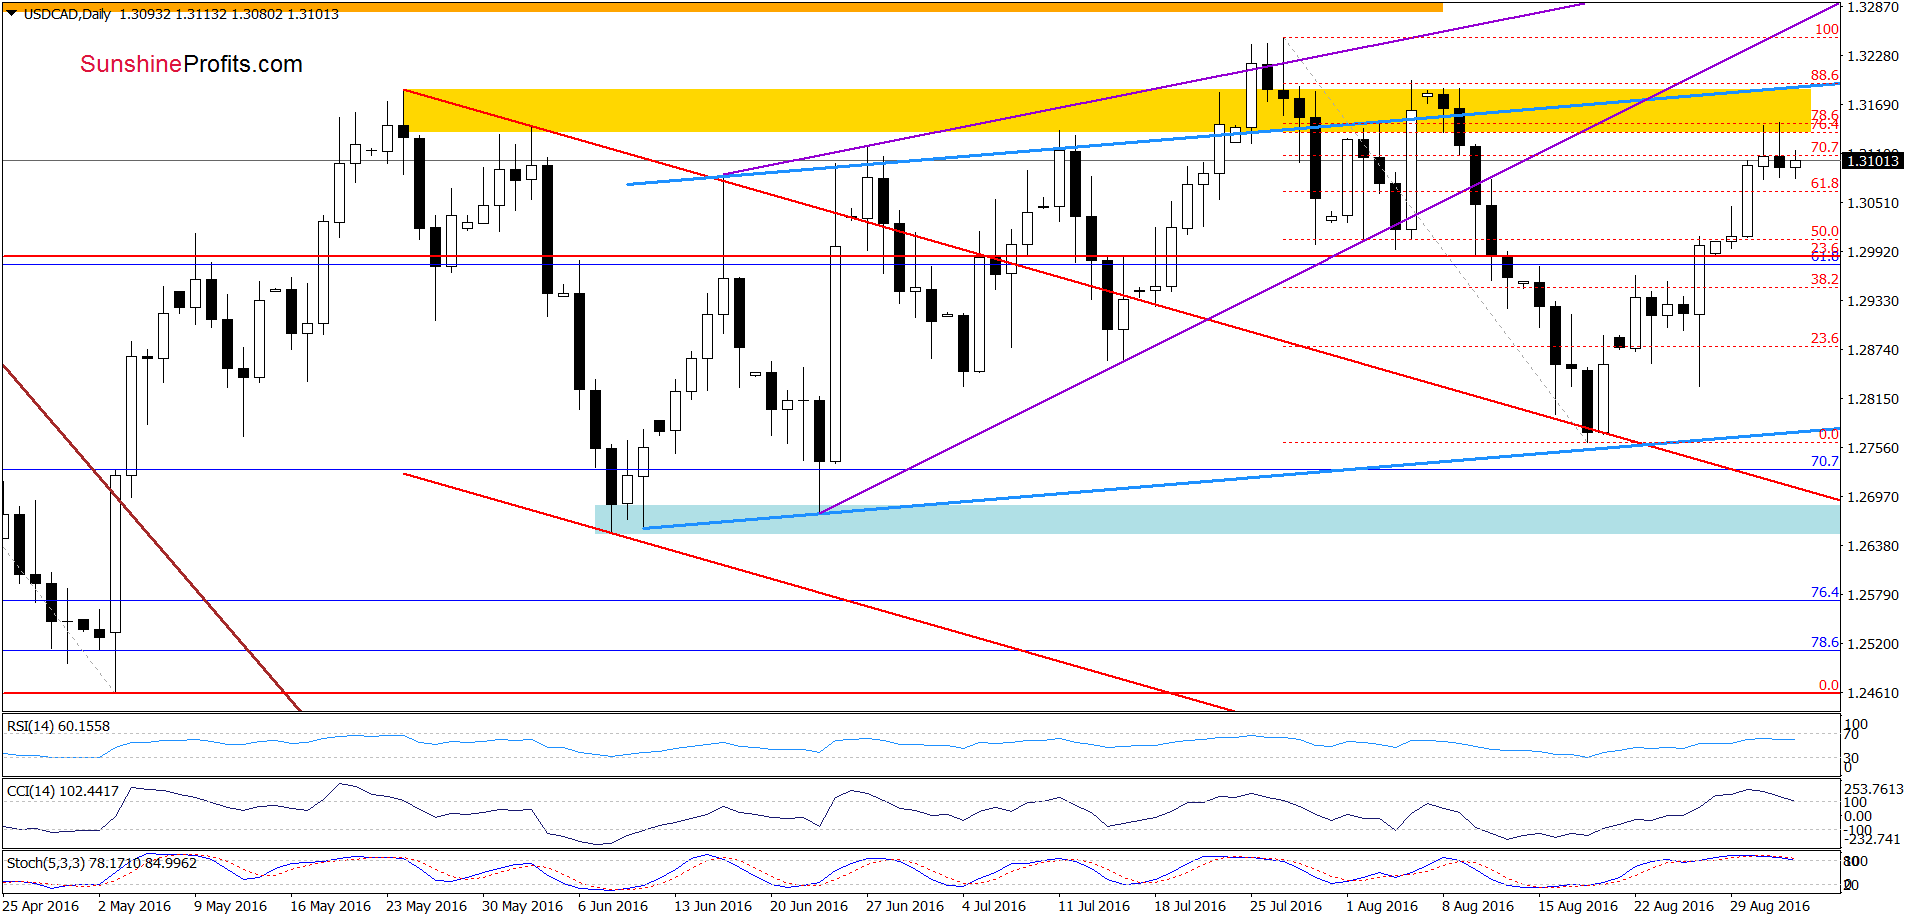
Not likely, because, USD/CAD extended gains and reached the yellow resistance zone once again. As you see on the daily chat, this area stopped currency bulls at the beginning of Aug, which suggests that we may see similar price action in the coming days – especially when we factor in the current position of the daily indicators (the CCI and Stochastic Oscillator are very close to generating sell signals, which increases the probability of reversal in very near future - maybe even tomorrow).
Very short-term outlook: bearish
Short-term outlook: mixed with bearish bias
MT outlook: mixed
LT outlook: mixed
Trading position (short-term; our opinion): Short positions (with a stop-loss at 1.3237 and the initial downside target at 1.2877) are justified from the risk/reward perspective. We will keep you informed should anything change, or should we see a confirmation/invalidation of the above.
USD/CHF
On Wednesday, we wrote the following:
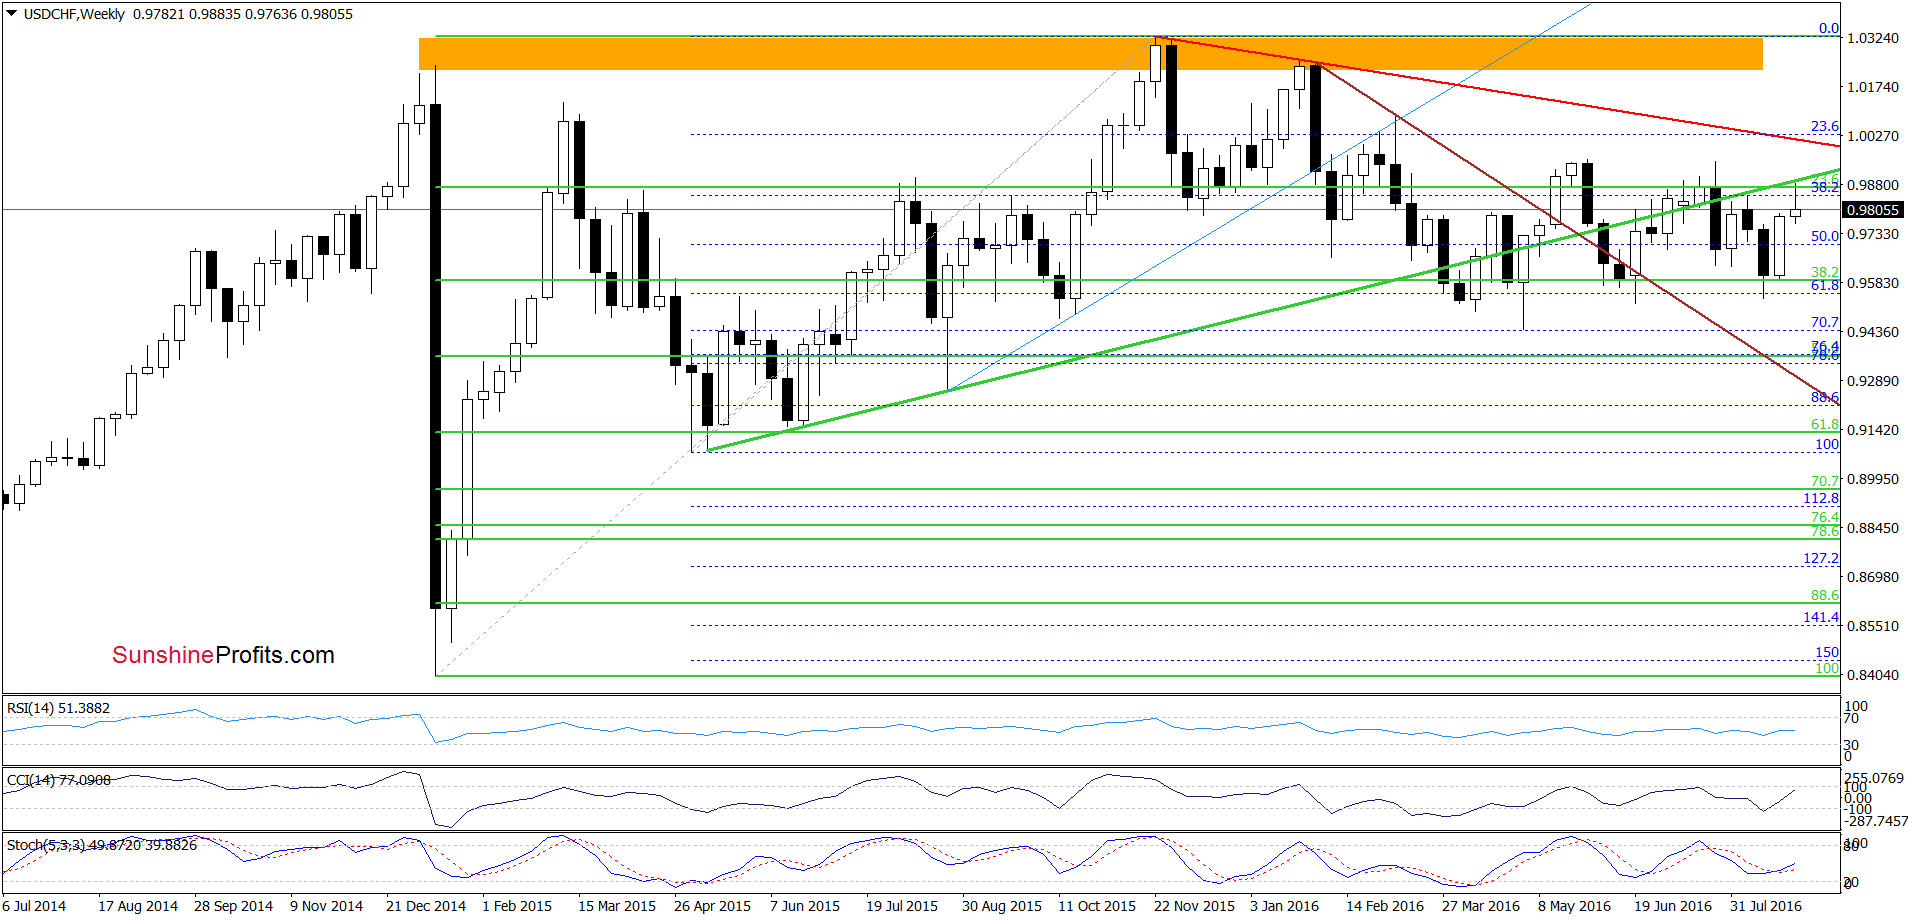
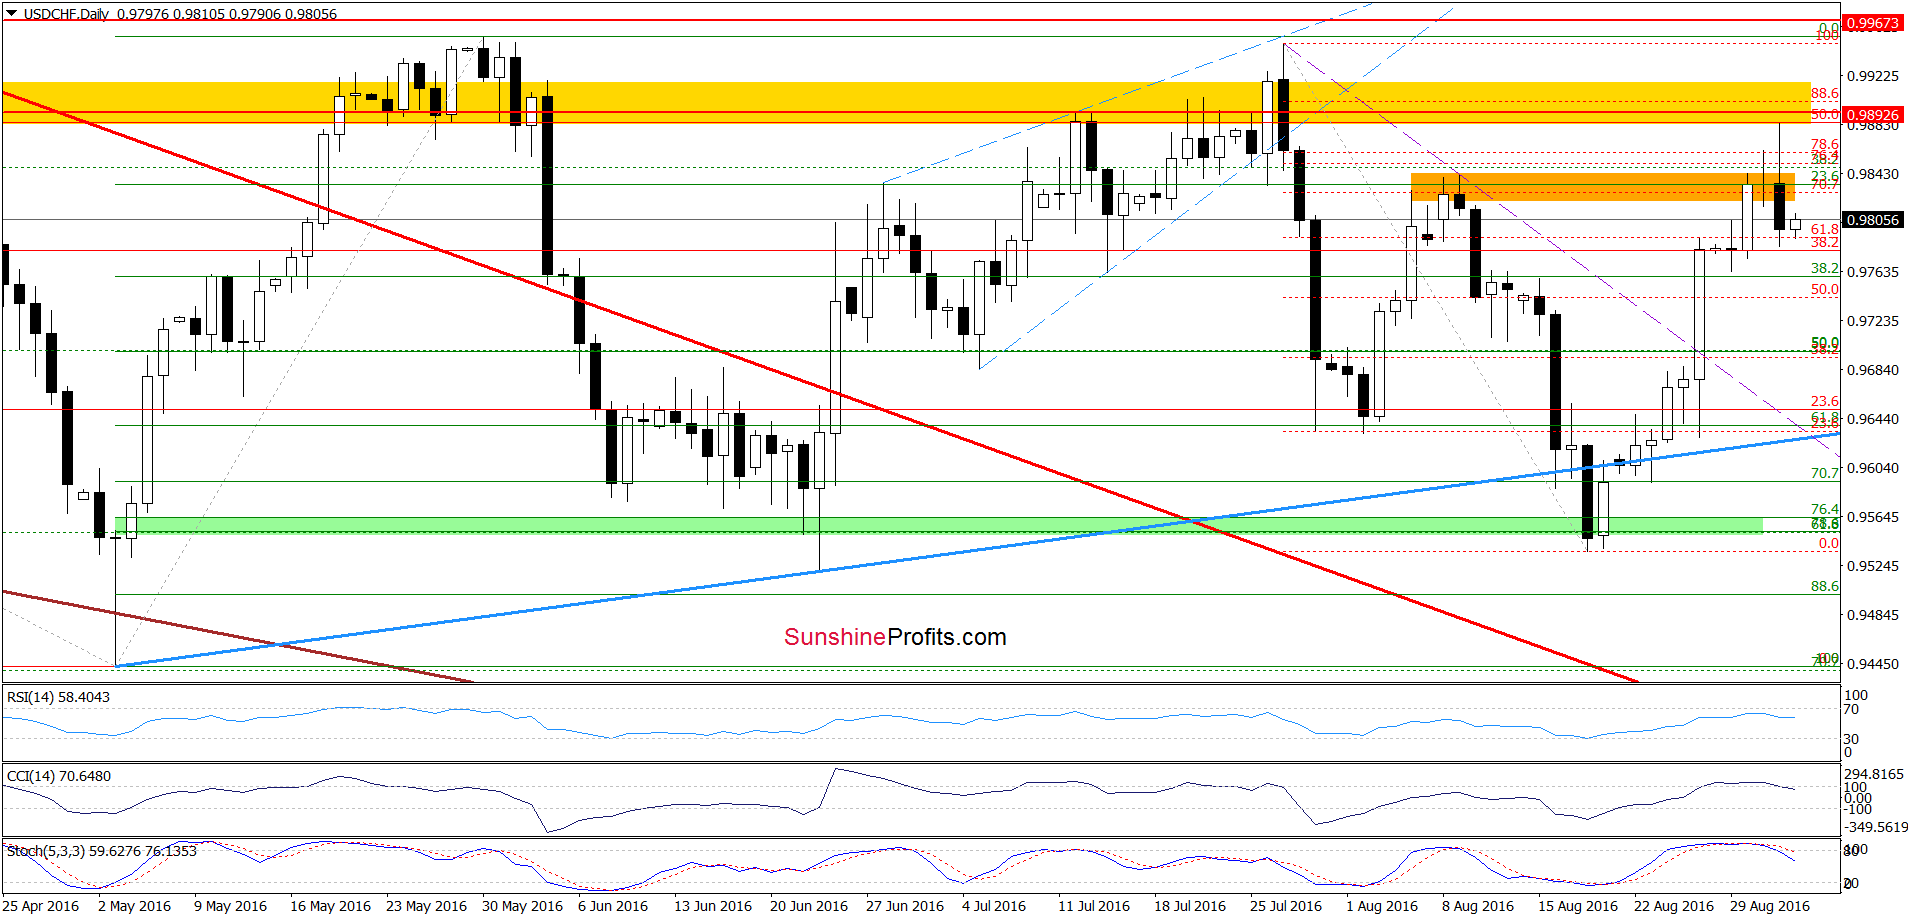
(…) USD/CHF extended gains and climbed to the orange resistance zone created by the Aug highs. Although this area may stop further improvement, we think that as long as there won’t be sell signals generated by the CCI and Stochastic Oscillator another attempt to move higher can’t be ruled out. Therefore, if the pair increases from current levels (…), the next upside target would be around 0.9893, where the previously-broken green resistance line (marked on the weekly chart) and the yellow resistance zone are.
From today’s point of view, we see that the situation developed in line with the above scenario and USD/CHF declined sharply after an increase to our upside target. With this downswing, the exchange rate invalidated earlier breakdown under the orange zone, which in combination with sell signals generated by the indicators suggests further deterioration in the coming days. If this is the case, the first downside target would be around 0.9710, where the 50% Fibonacci retracement based on the recent upward move currently is.
Very short-term outlook: bearish
Short-term outlook: mixed with bearish bias
MT outlook: mixed
LT outlook: mixed
Trading position (short-term; our opinion): Short positions (with a stop-loss at 0.9935 and the initial downside target at 0.9630) are justified from the risk/reward perspective at the moment. We will keep you informed should anything change, or should we see a confirmation/invalidation of the above.
AUD/USD
Quoting Wednesday’s alert:
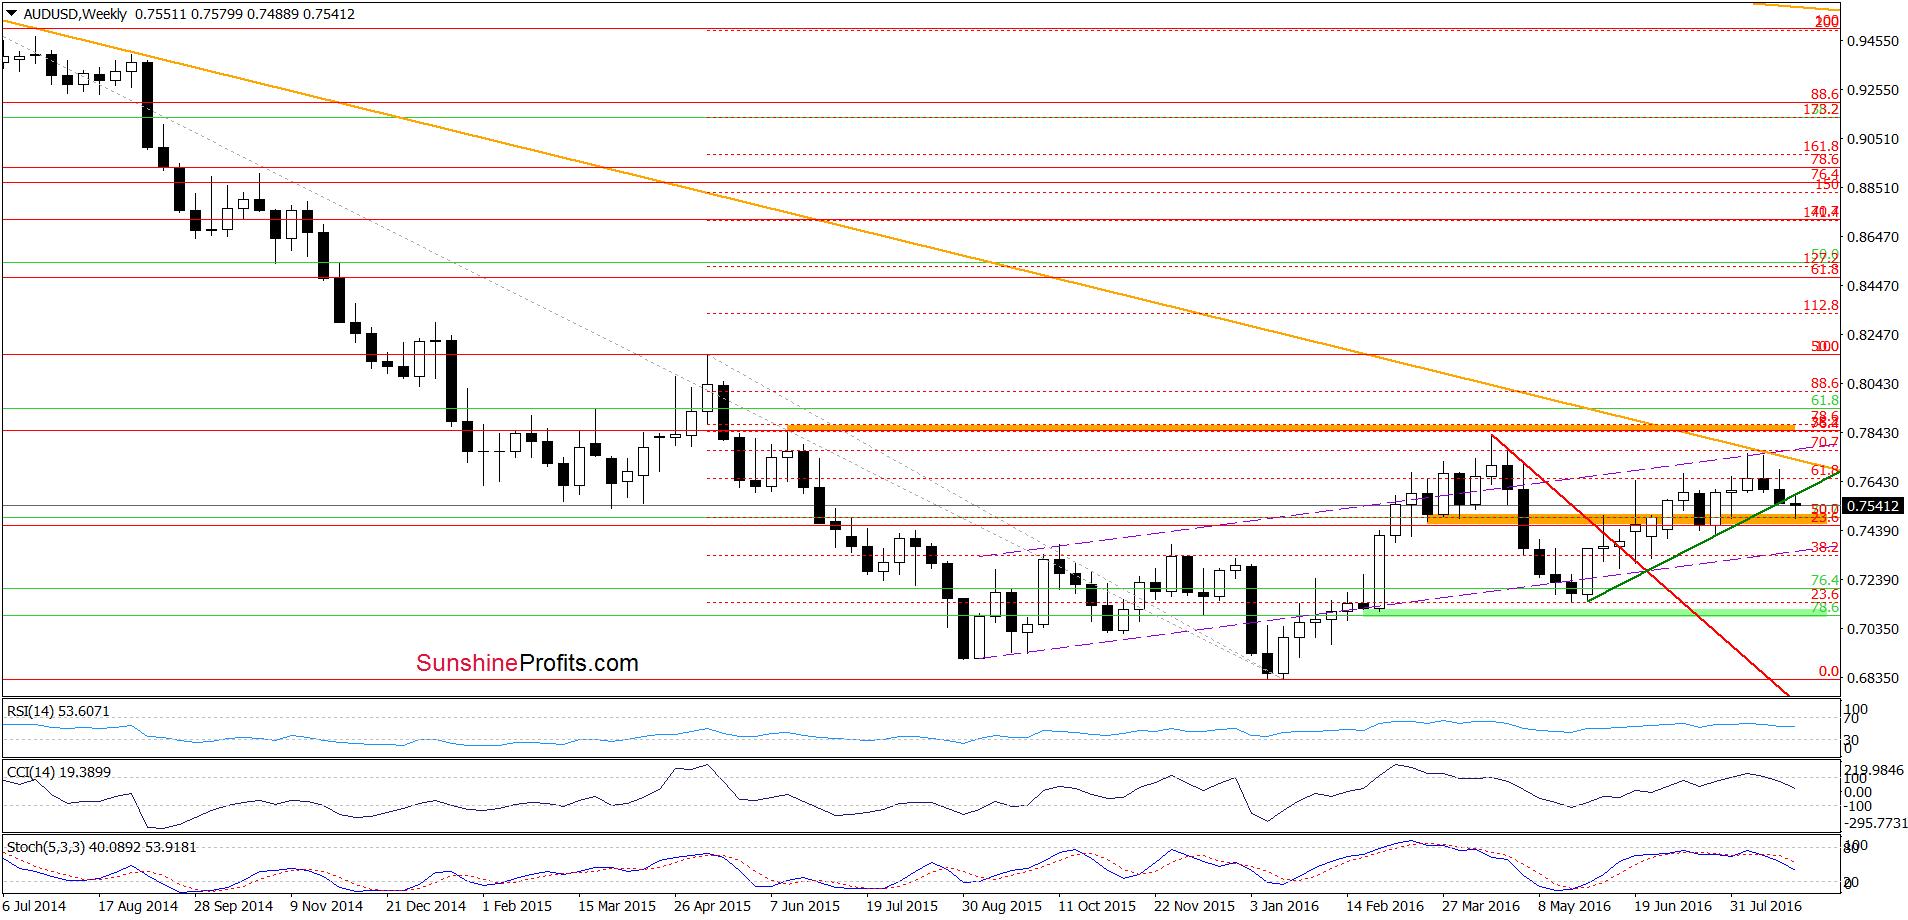
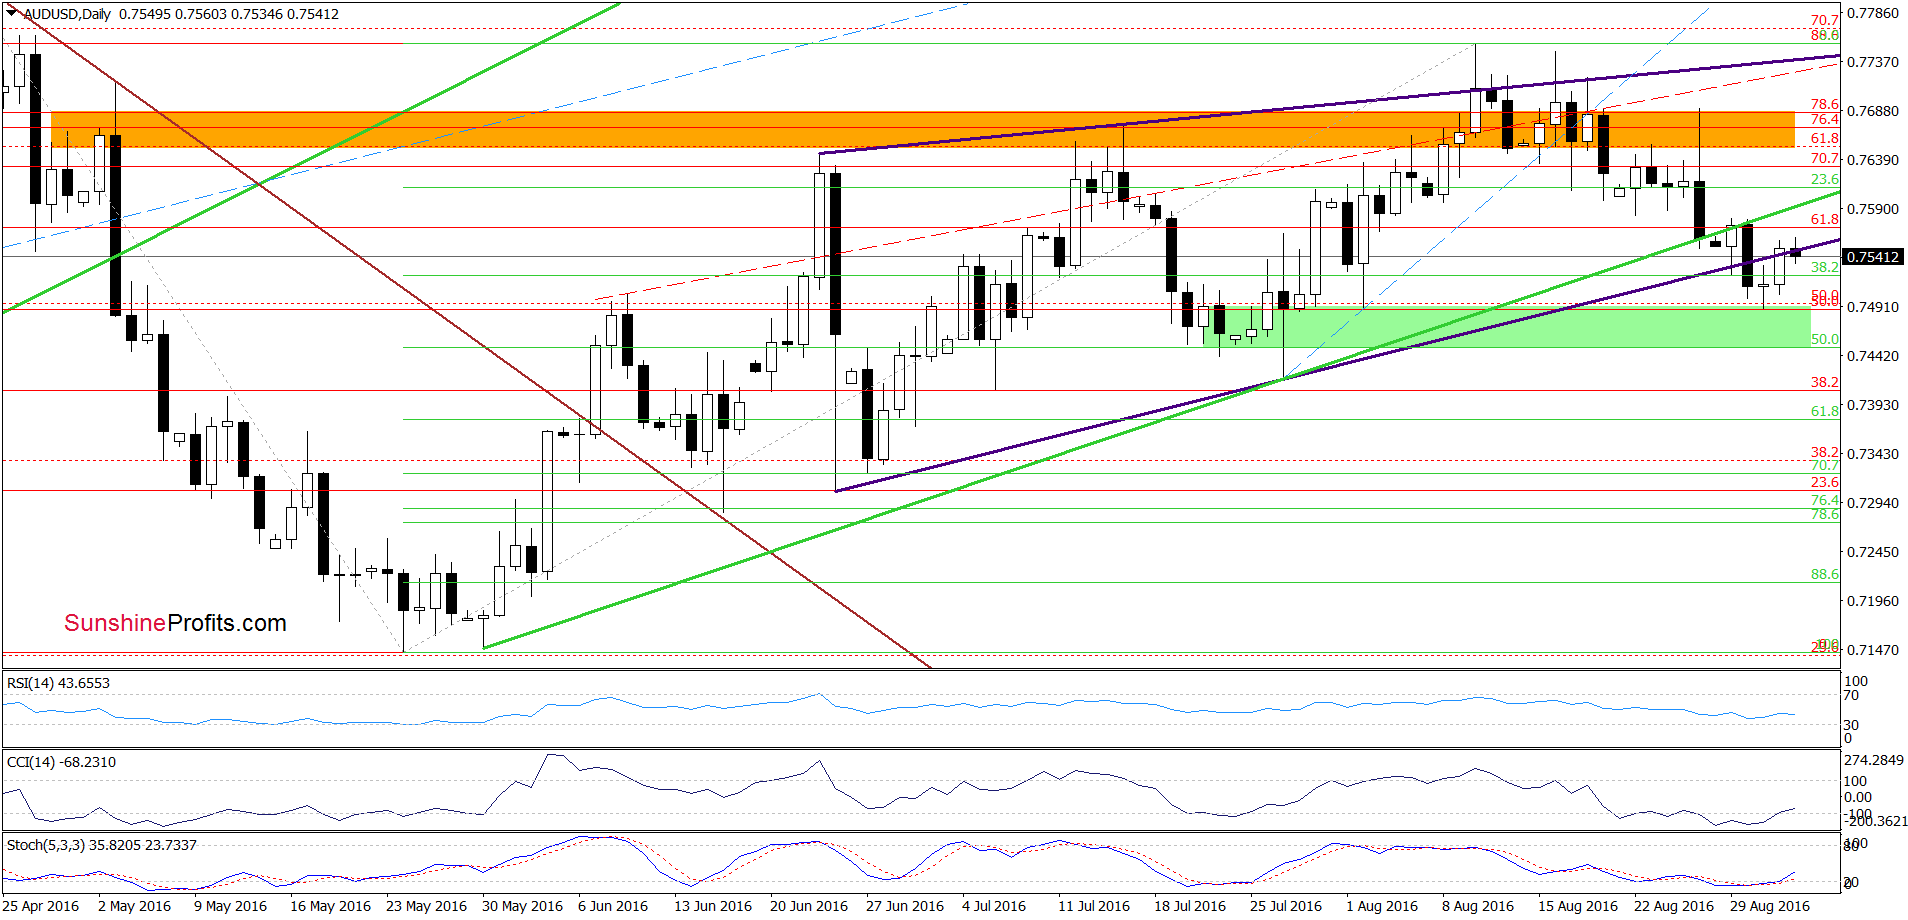
(…) the CCI and Stochastic Oscillator are extremely oversold, which suggests that the space for declines may be limited and reversal in near future should not surprise us – especially when we factor in the proximity to the green support zone.
Looking at the daily chart, we see that currency bulls pushed the pair higher yesterday, which resulted in invalidation of the breakdown under the lower border of the purple rising wedge. Taking this positive fact into account and combining it with buy signals generated by the CCI and Stochastic Oscillator we think that further improvement is just around the corner. Nevertheless, in our opinion, another bigger move will be more likely and reliable if the pair invalidates the breakdown under the medium-term green resistance line. If we see such price action, the next upside target would be the orange resistance zone (around 0.7648-0.7687).
Very short-term outlook: mixed with bullish bias
Short-term outlook: mixed
MT outlook: mixed
LT outlook: mixed
Trading position (short-term; our opinion): No positions are justified from the risk/reward perspective. We will keep you informed should anything change, or should we see a confirmation/invalidation of the above.
Thank you.
Nadia Simmons
Forex & Oil Trading Strategist
Przemyslaw Radomski, CFA
Founder, Editor-in-chief, Gold & Silver Fund Manager
Gold & Silver Trading Alerts
Forex Trading Alerts
Oil Investment Updates
Oil Trading Alerts

