

Earlier today, the USD Index wavered between small gains and losses as investors remain focus on a Janet Yellen's speech later in the day. Before we know how this event will affect the currency market, let’s check what the technical picture of our six currency pairs currently is.
In our opinion the following forex trading positions are justified - summary:
- EUR/USD: none
- GBP/USD: short (a stop-loss at 1.3579; initial downside target at 1.2519)
- USD/JPY: none
- USD/CAD: none
- USD/CHF: none
- AUD/USD: none
EUR/USD
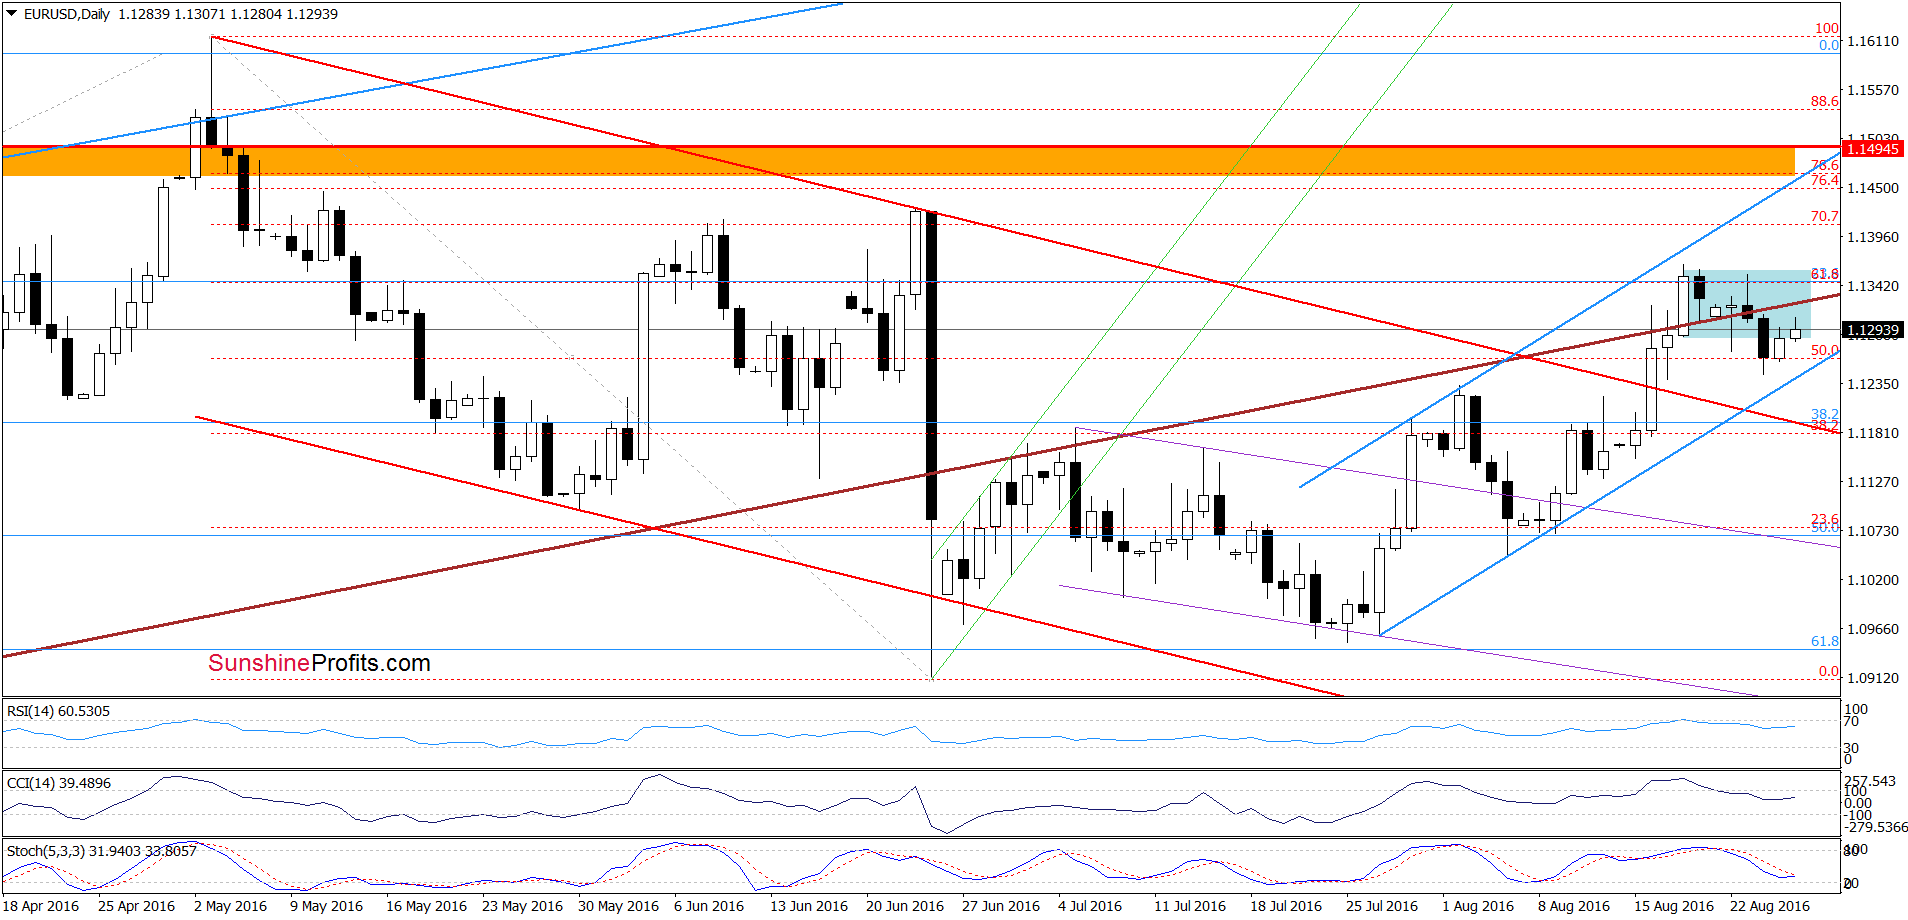
On the daily chart, we see that although EUR/USD moved little higher earlier today, the pair remains under the medium-term brown resistance line. Additionally, sell signals generated by the indicators are still in play, suggesting lower values of the exchange rate and a test of the lower border of the blue rising trend channel in the coming day(s).
Very short-term outlook: mixed
Short-term outlook: mixed
MT outlook: mixed
LT outlook: mixed
Trading position (short-term; our opinion): No positions are justified from the risk/reward perspective. We will keep you informed should anything change, or should we see a confirmation/invalidation of the above.
GBP/USD
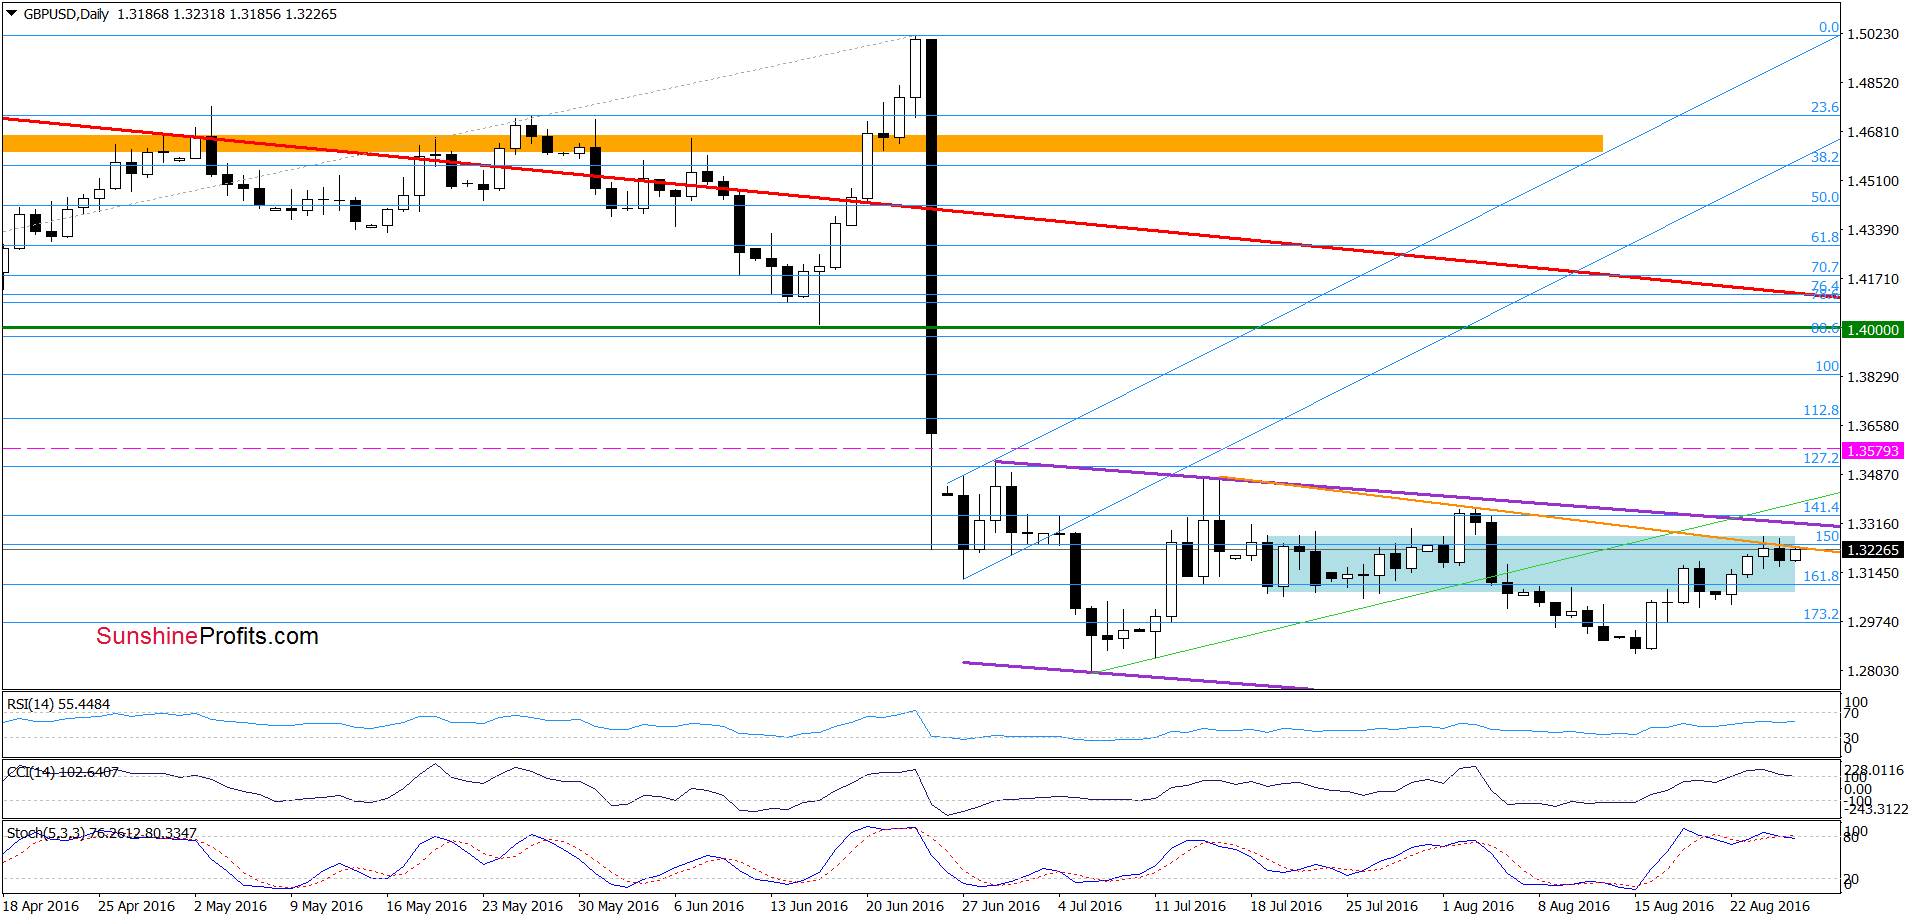
From today’s point of view, we see that although GBP/USD increased slightly earlier today, the pair remains under the orange resistance line based on recent highs. Additionally, the CCI and Stochastic Oscillator generated sell signals, which suggests that lower values of GBP/USD are still ahead us. If this is the case, and the pair declines from here, we’ll see (at least) a test of the last week’s lows.
Therefore, our previous commentary on the long-term picure remains unchanged:
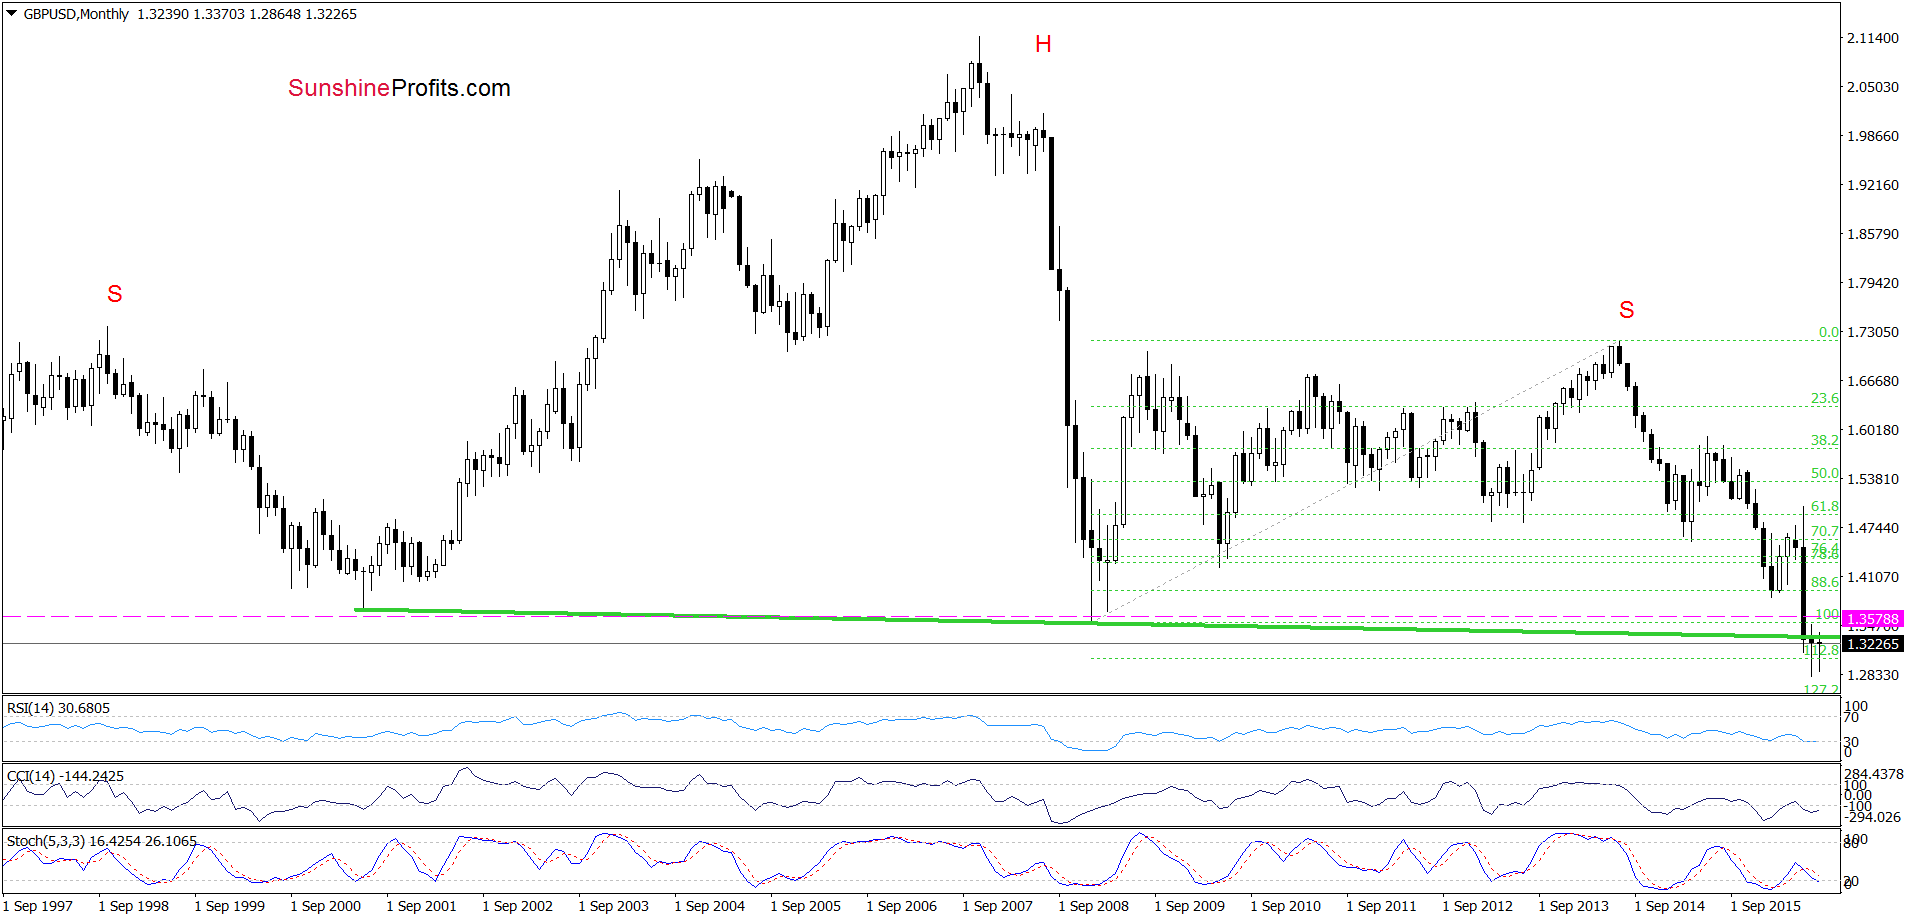
On the monthly chart, we see that although GBP/USD extended gains, the long-term picture hasn’t changed much and remains bearish as the exchange rate remains under the previusly-broken neck line of the head and shoulders formation. This means that as long as there won’t be invalidation of the breakdown belw this key line another attempt to move lower is more likely than not.
Very short-term outlook: bearish
Short-term outlook: bearish
MT outlook: bearish
LT outlook: bearish
Trading position (short-term; our opinion): Short positions (with a stop-loss at 1.3579 and the initial downside target at 1.2519) are justified from the risk/reward perspective at the moment. We will keep you informed should anything change, or should we see a confirmation/invalidation of the above.
USD/JPY
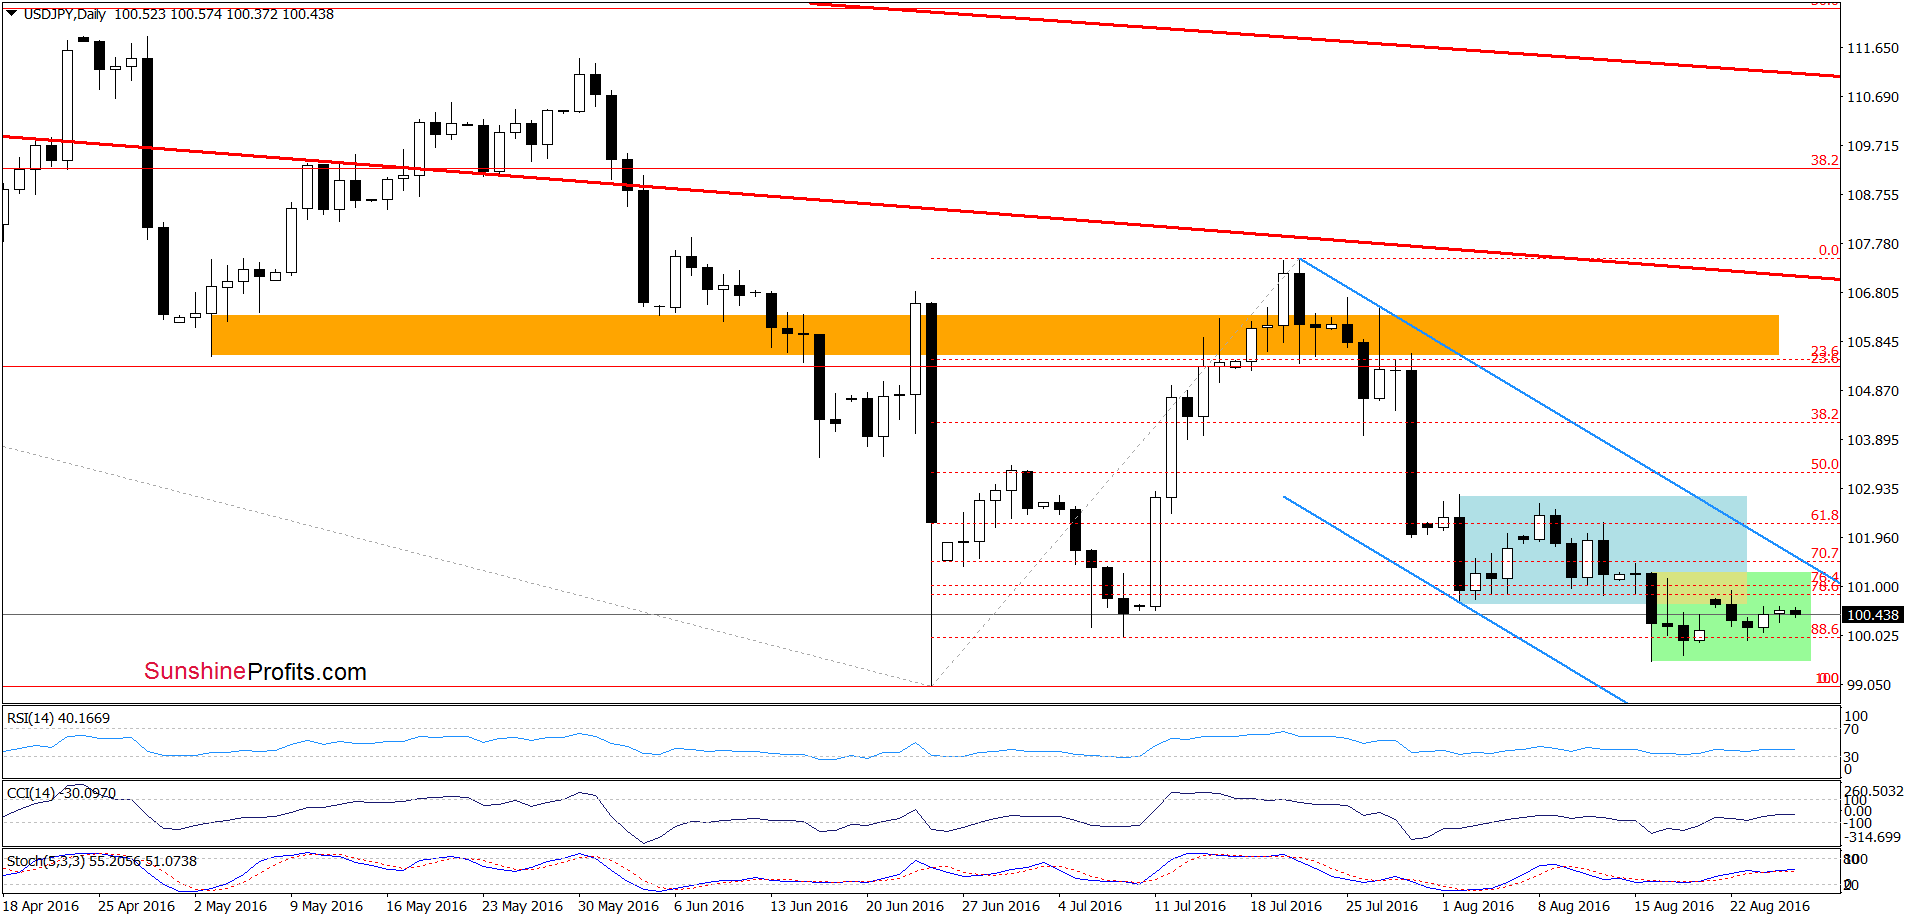
From the very short-term perspective, we see that the overall situation in the very short term hasn’t changed much as USD/JPY remains in a consolidation around the 88.6% Fibonacci retracement based on the Jun-Jul upward move. Therefore, what we wrote on Tuesday remains up-to-date also today:
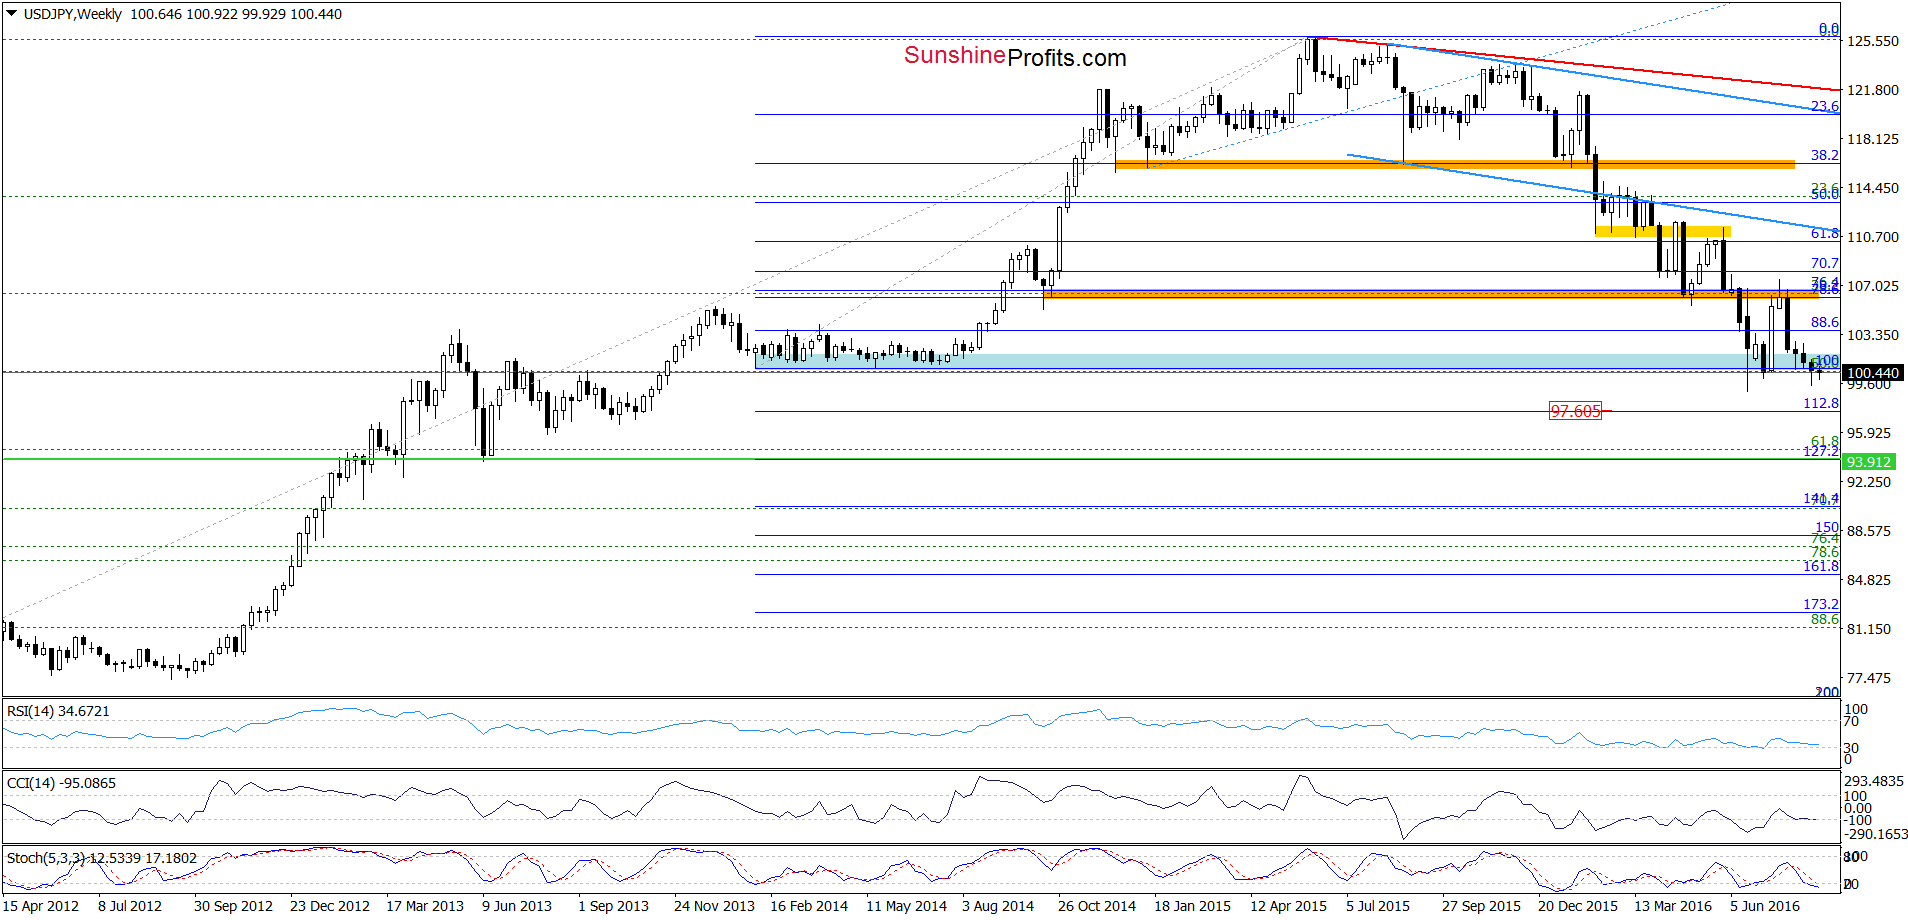
(…) USD/JPY slipped under the blue support zone earlier this week. Although this is a negative signal, we saw similar price action in Jun and Jul, which suggests that the pair may reverse in the coming week – especially, when we factor in the proximity to the green support zone marked on the long-term chart below.
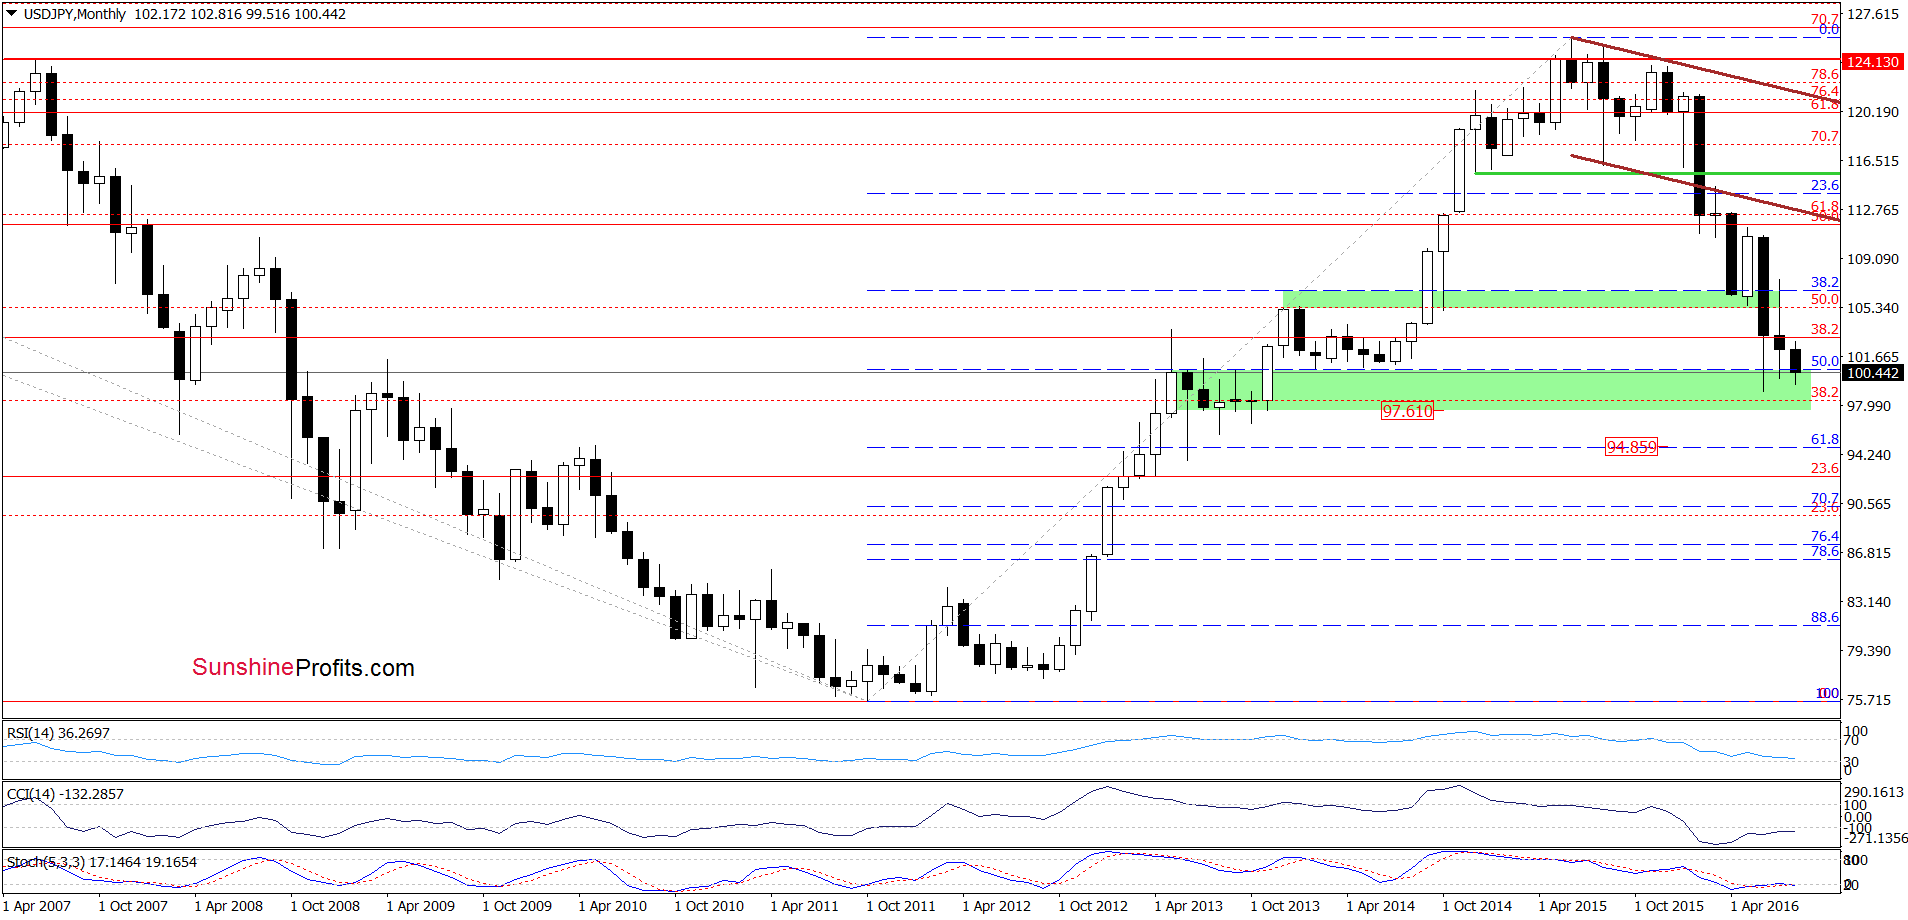
From this perspective, we see that even if the exchange rate moves lower from current levels, the space for declines seems limited as the lower border of the green zone and the 112.8% Fibonacci extension (around 97.60) are quite close. Nevertheless, as long as the barrier of 100 keeps declines in check, another attempt to move higher from this area is likely.
Very short-term outlook: mixed
Short-term outlook: mixed
MT outlook: mixed
LT outlook: mixed
Trading position (short-term; our opinion): No positions are justified from the risk/reward perspective at the moment. We will keep you informed should anything change, or should we see a confirmation/invalidation of the above.
USD/CAD
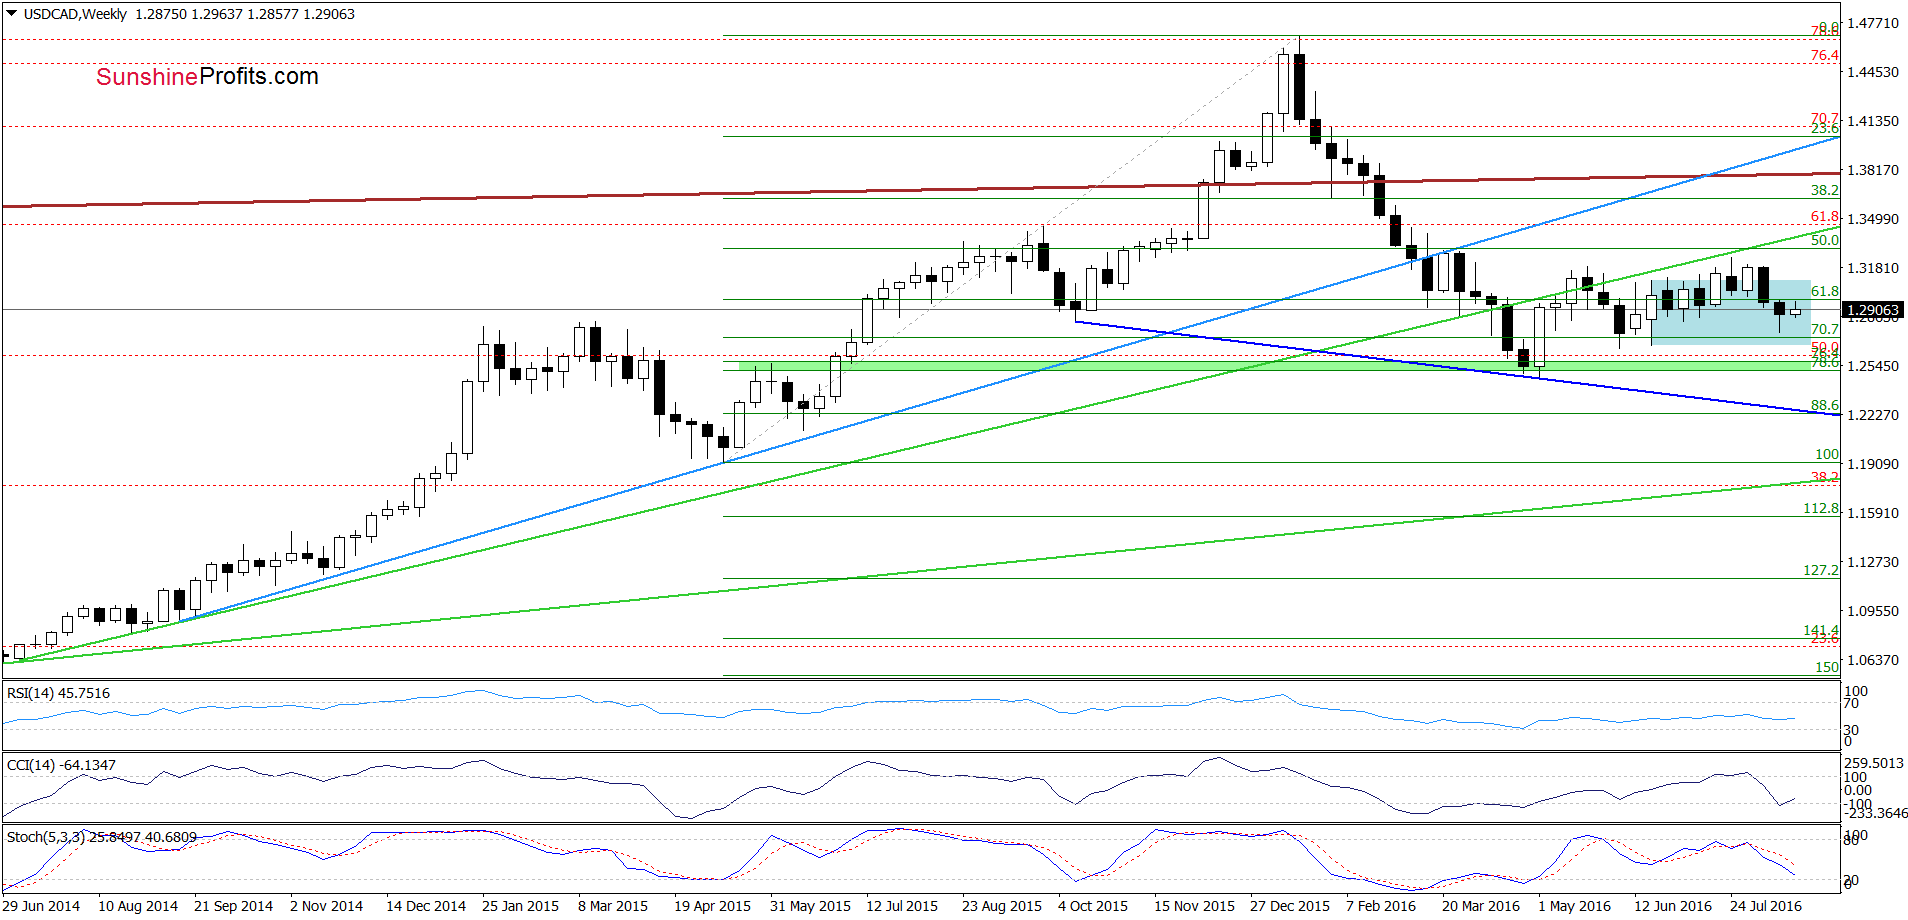
The medium-term picture hasn’t changed much, because USD/CAD is still trading in the blue consolidation.
Will the very short-term chart give us more clues about future moves?
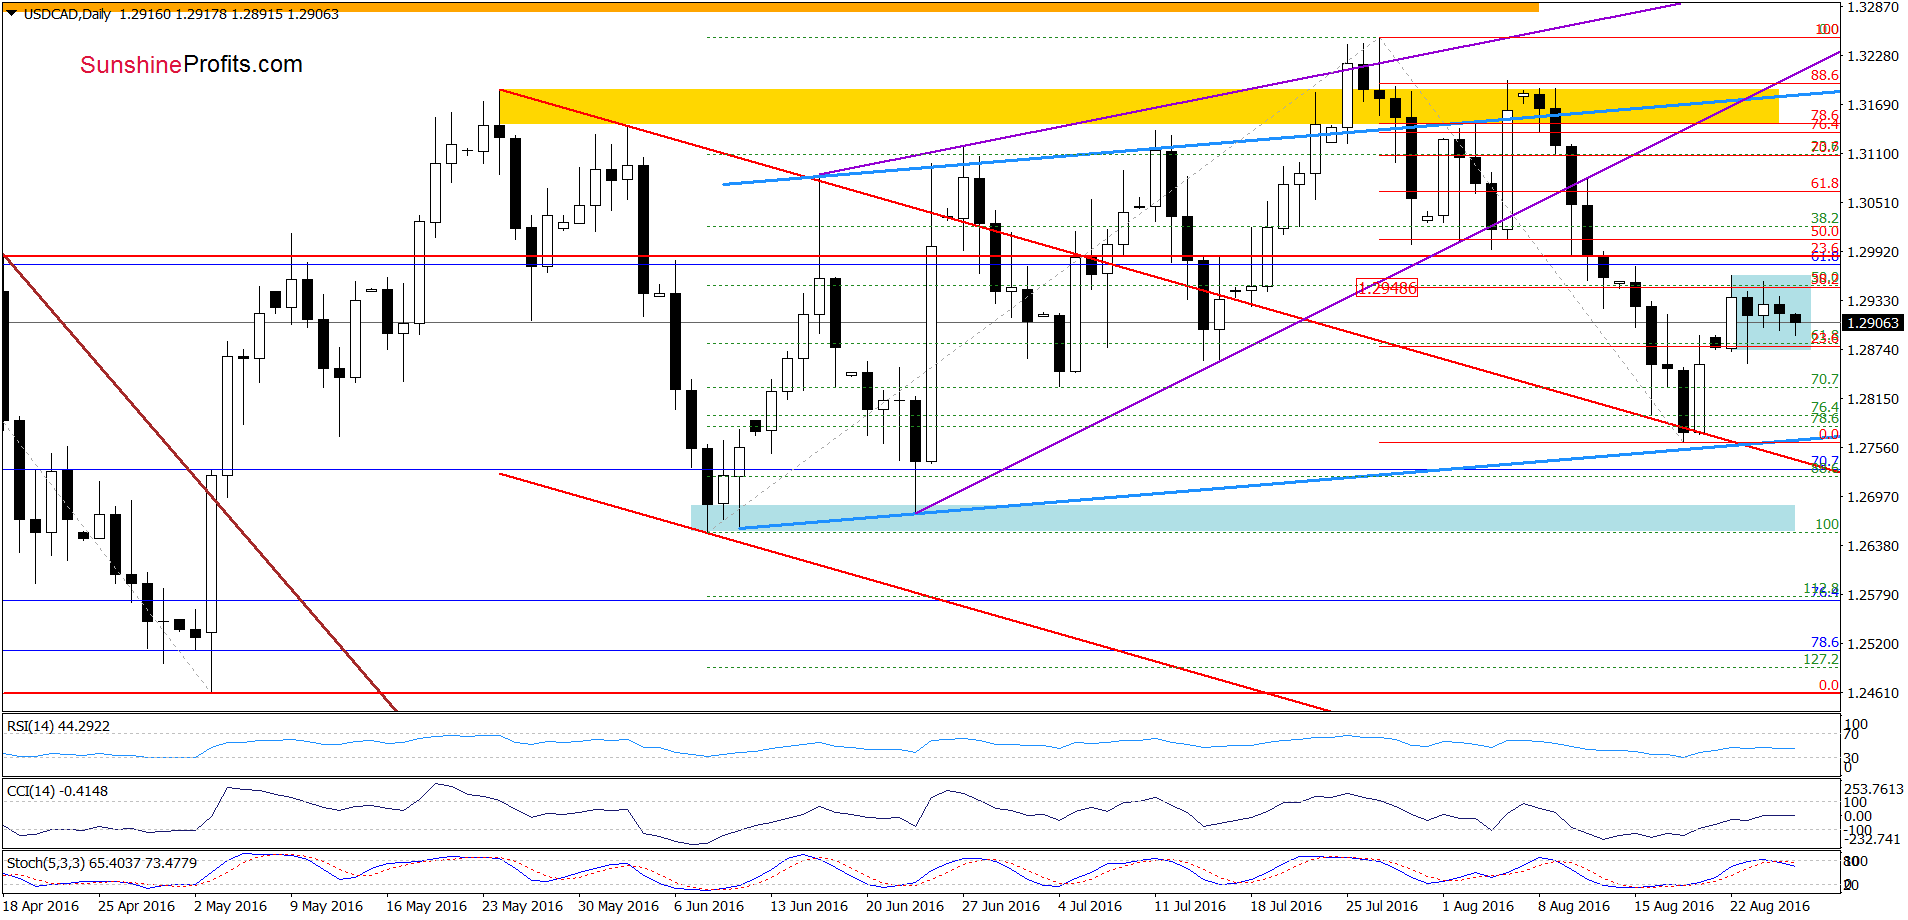
Not really, because as you see on the daily chart, USD/CAD remains in a blue consolidation under the 38.2% Fibonacci retracement. Taking this fact into account, and combining it with a sell signal generated by the Stochastic Oscillator, we think that another bigger move will be more likely only if the exchange rate breaks below the lower line of the formation. In this case, we’ll likely see a test of the blue support line based on the Jun lows in the following days.
Very short-term outlook: mixed with bearish bias
Short-term outlook: mixed
MT outlook: mixed
LT outlook: mixed
Trading position (short-term; our opinion): No positions are justified from the risk/reward perspective. We will keep you informed should anything change, or should we see a confirmation/invalidation of the above.
USD/CHF
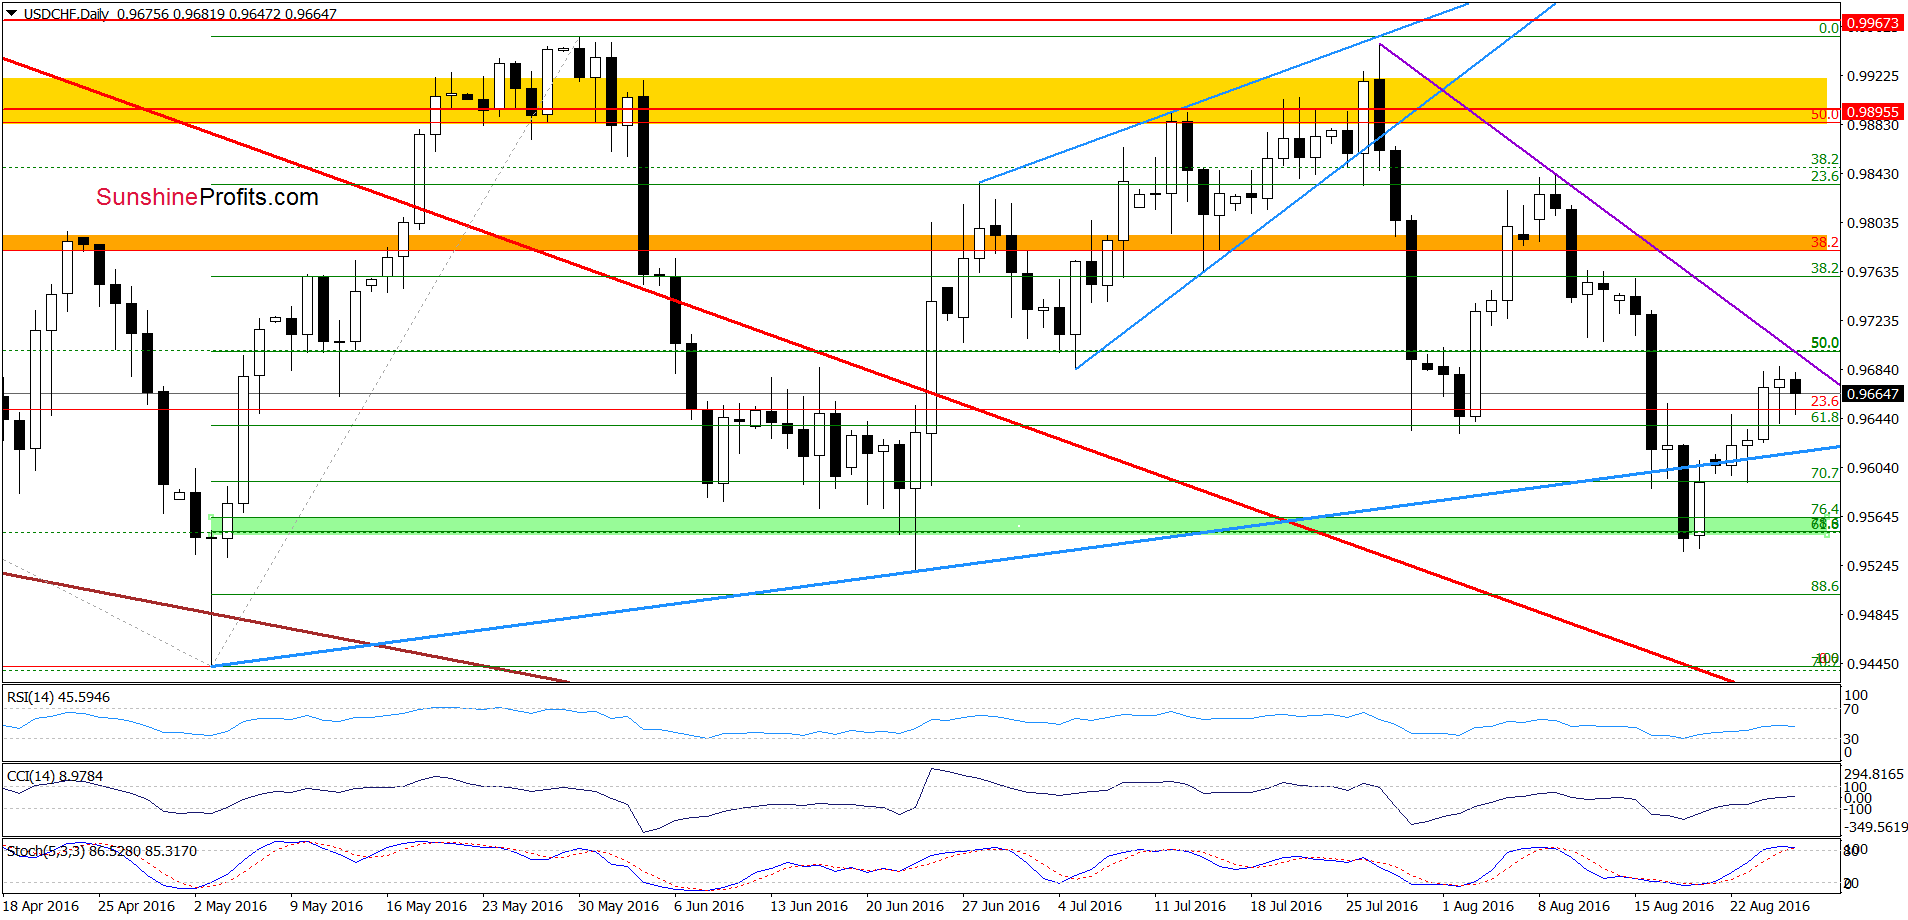
Looking at the daily chart, we see that although USD/CHF moved slightly higher yesterday, the proximity to the purple declining resistance line in combination with a sell signal generated by the Stochastic Oscillator encouraged currency bears to act, which resulted in a pullback earlier today. Taking all the above into account, we think that the exchange rate will test the blue support line in the coming day(s).
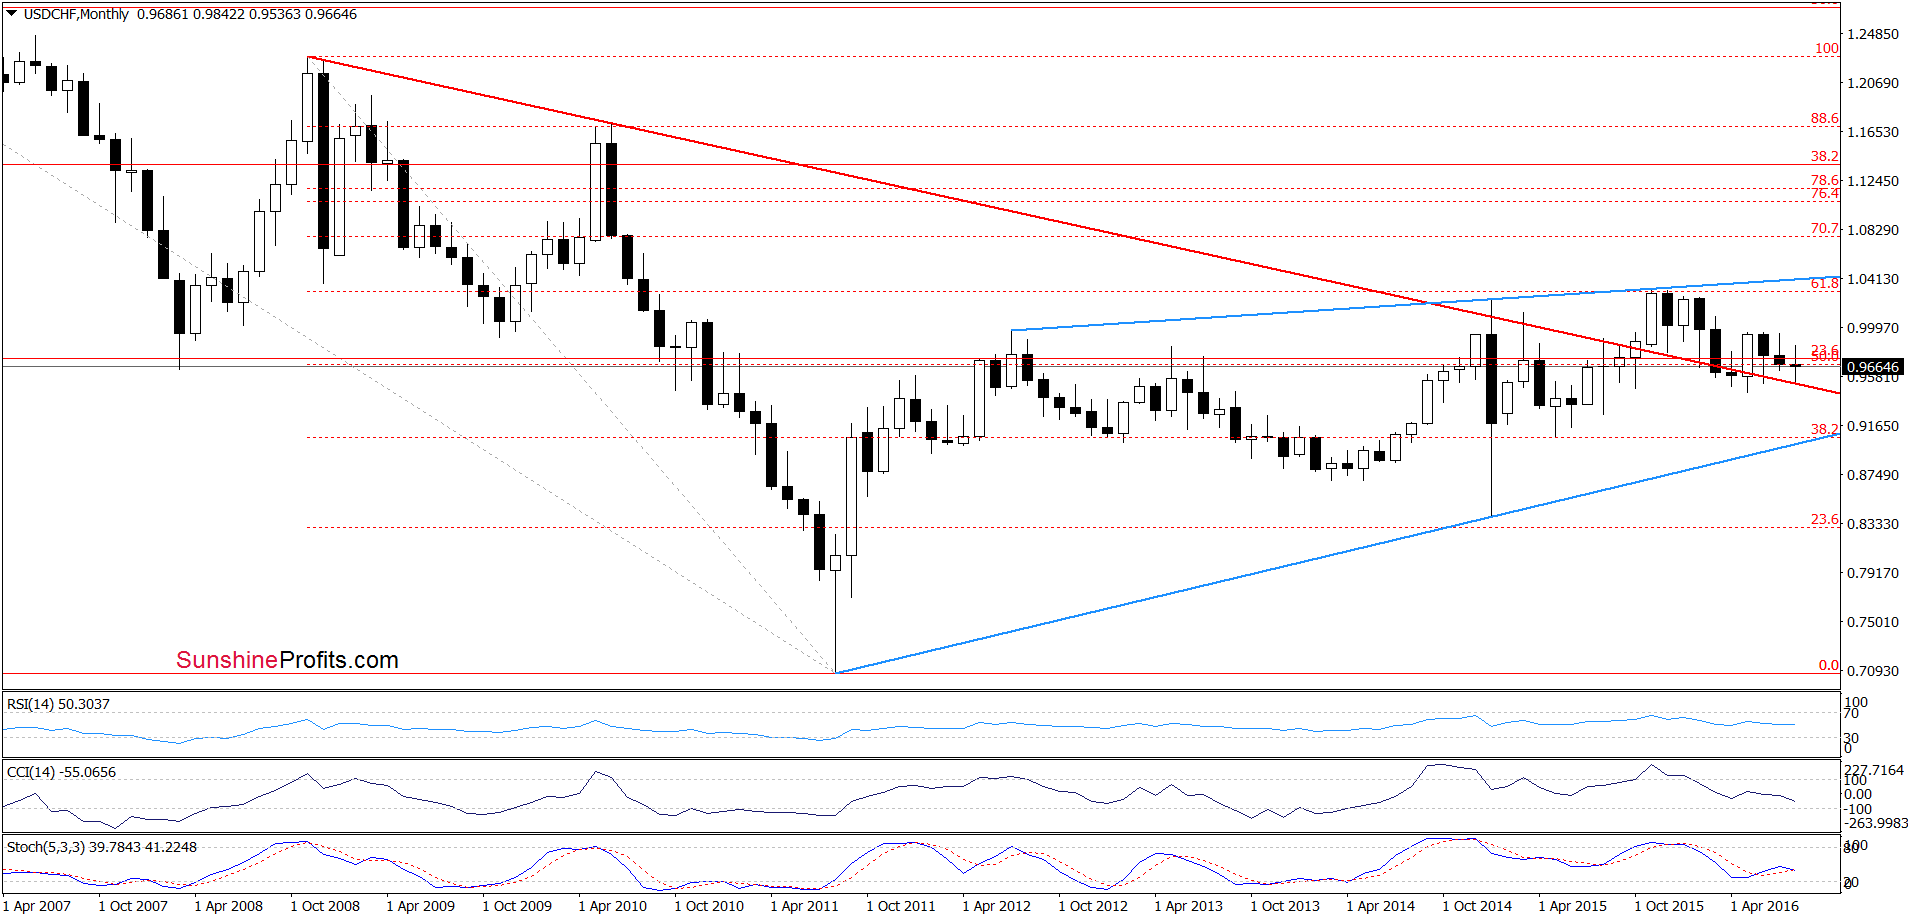
Nevertheless, we should keep in mind that as long as the long-term red declining support line keeps declines in check, another sizable move to the downside is questionable.
Very short-term outlook: mixed with bearish bias
Short-term outlook: mixed
MT outlook: mixed
LT outlook: mixed
Trading position (short-term; our opinion): No positions are justified from the risk/reward perspective at the moment. We will keep you informed should anything change, or should we see a confirmation/invalidation of the above.
AUD/USD
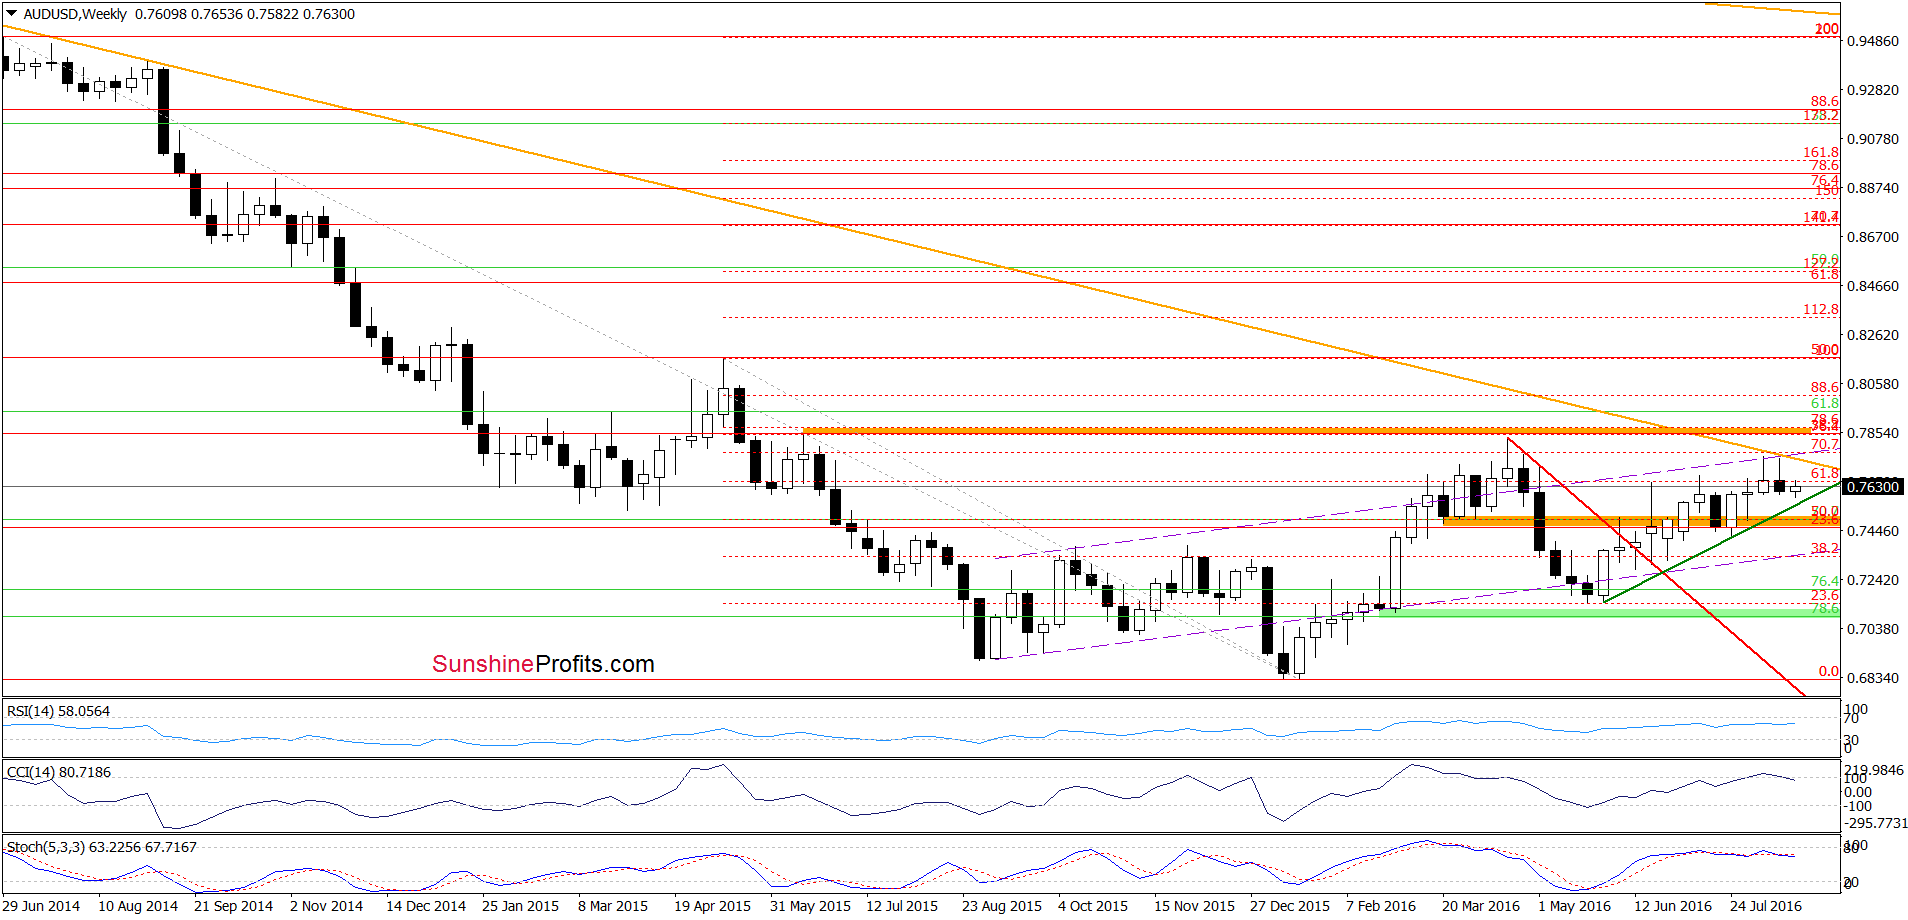
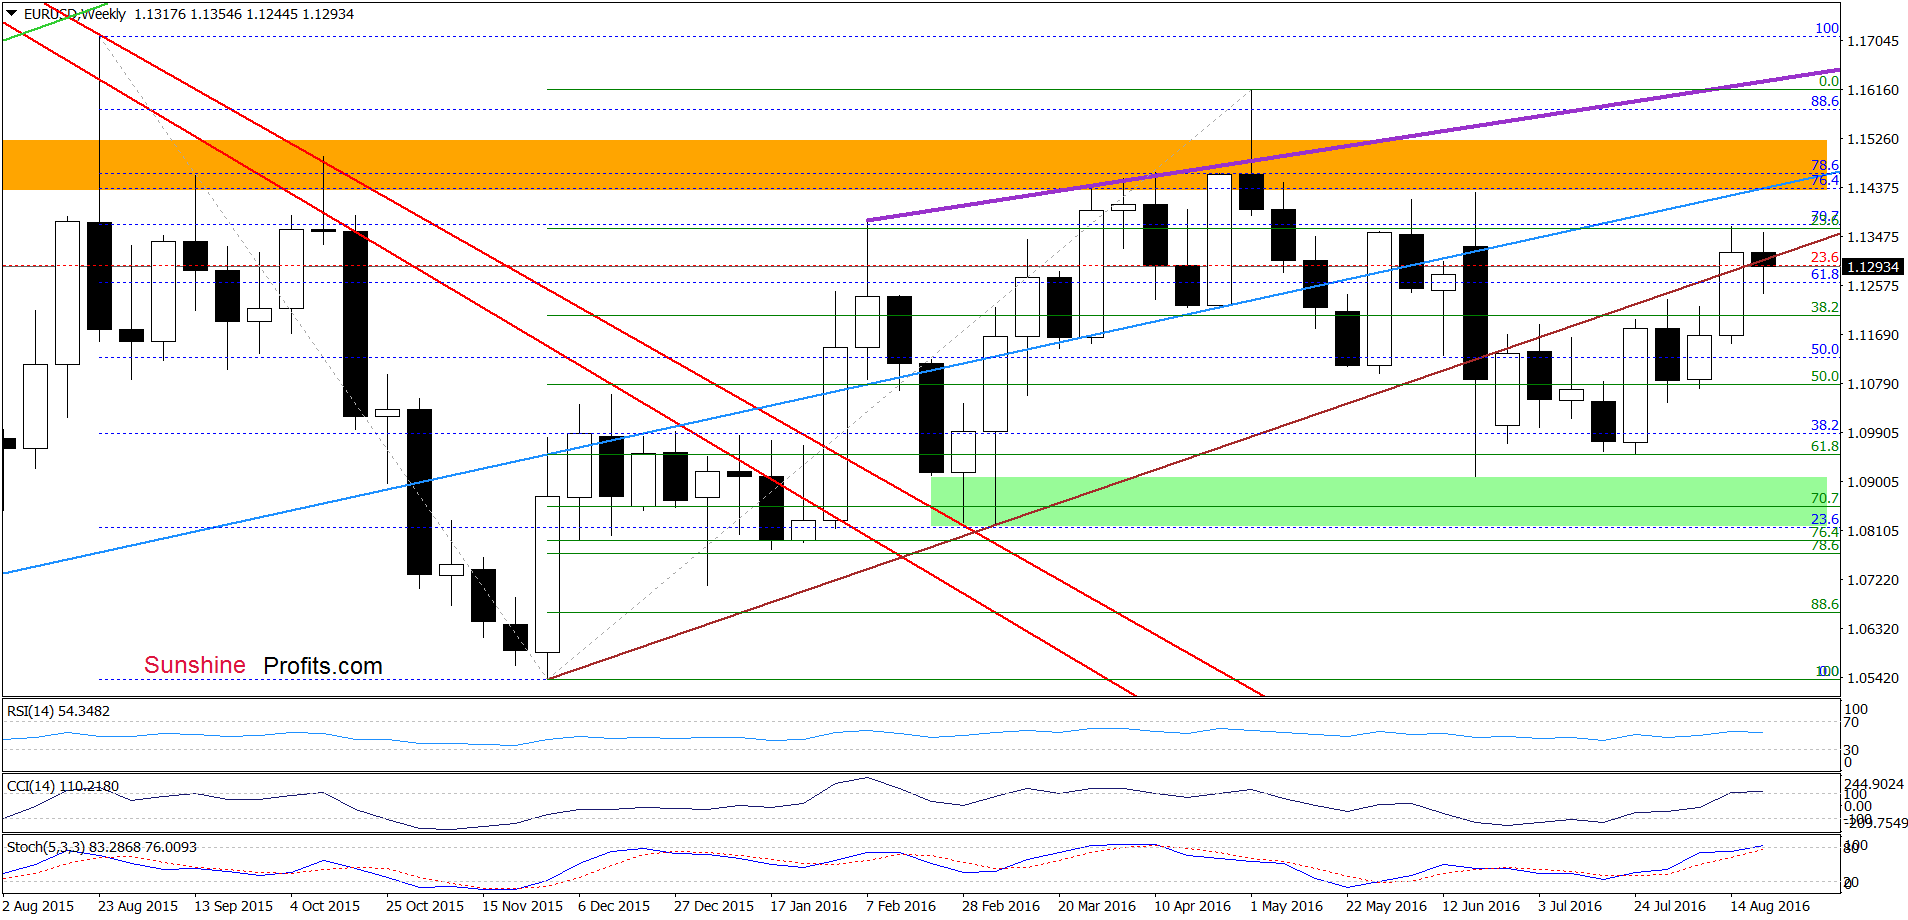
Looking at the weekly chart, we see that although AUD/USD rebounded earlier this week, the long-term orange resistance line, the late-Apr high, the 70.7% Fibonacci retracement and the current position of the indicators continue to support currency bears, suggesting that even if the pair moves higher once again (and test the last week’s high) further deterioration is just around the corner.
Will the daily chart give us more bearish technical factors? Let’s focus on the very short-term chart and find out.
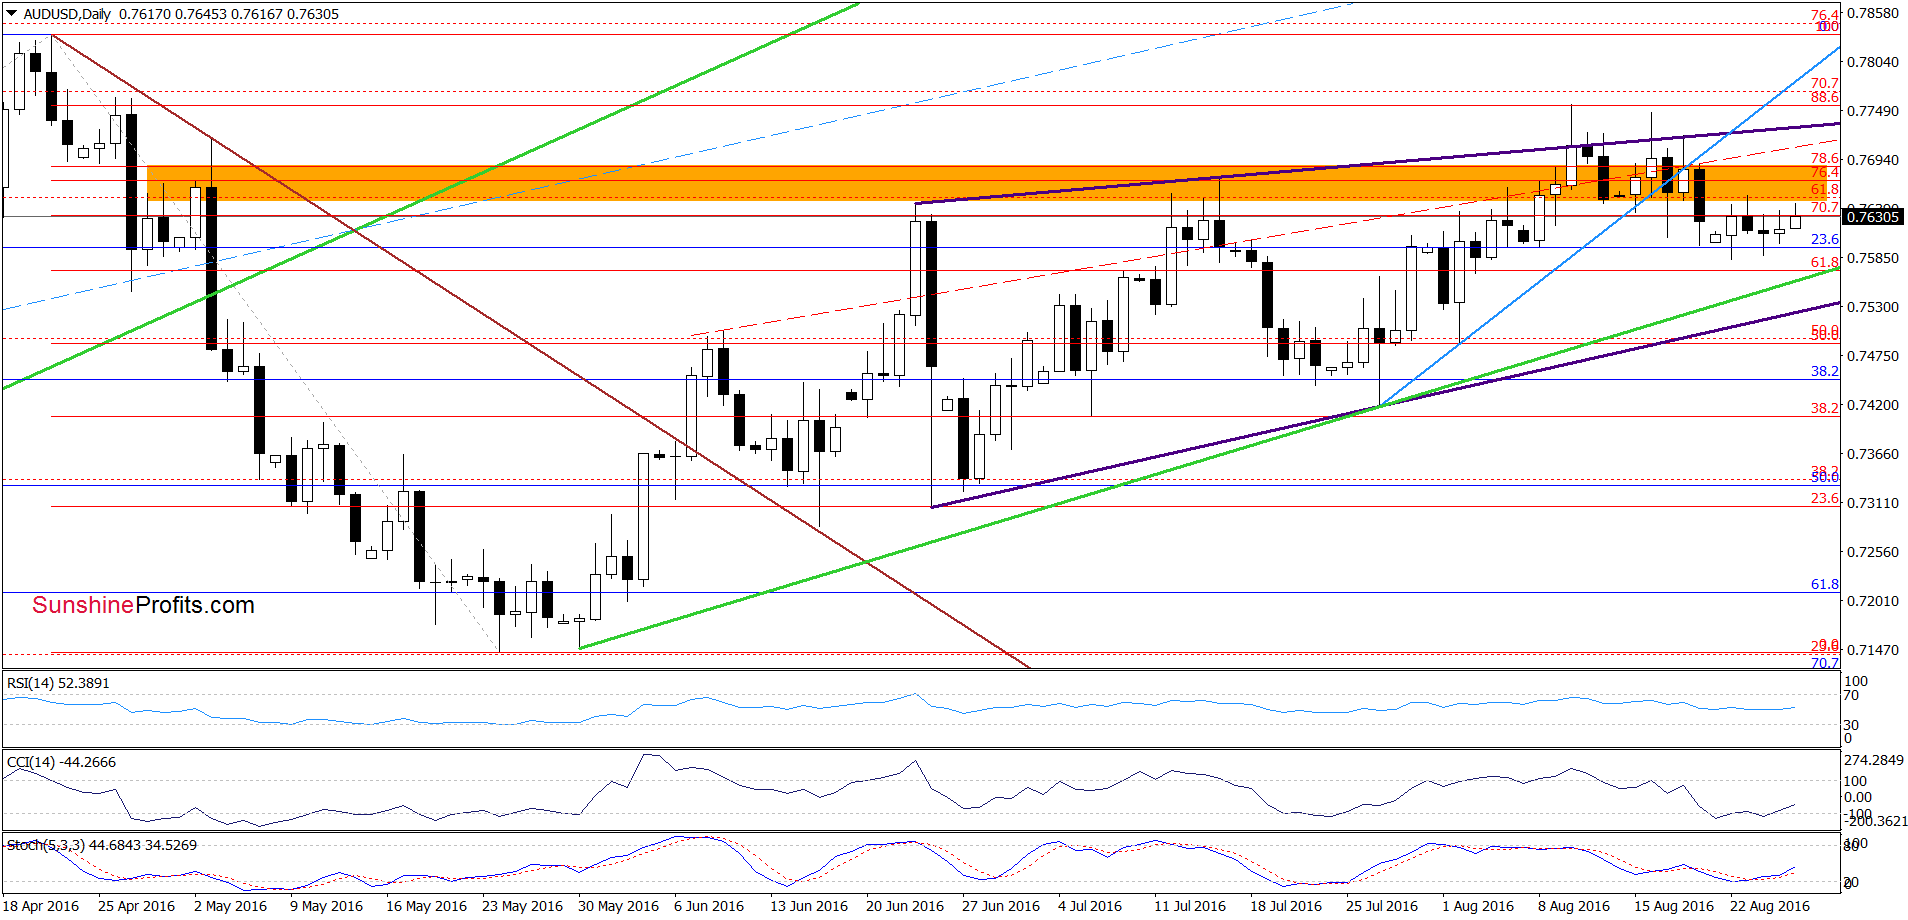
From today’s perspective, we see that AUD/USD is trading in a narrow range under the orange resistance zone created by the Fibonacci retracement levels. Nevertheless, buy signals generated by the CCI and Stochastic Oscillator remains in play, supporting further improvement. Therefore, if the exchange rate climbs above the orange area, we may see a test of the upper border of the purple rising wedge (or even the blue resistance line based on the recent lows) in the coming week.
Very short-term outlook: mixed with bullish bias
Short-term outlook: mixed
MT outlook: mixed
LT outlook: mixed
Trading position (short-term; our opinion): No positions are justified from the risk/reward perspective. We will keep you informed should anything change, or should we see a confirmation/invalidation of the above.
Thank you.
Nadia Simmons
Forex & Oil Trading Strategist
Przemyslaw Radomski, CFA
Founder, Editor-in-chief, Gold & Silver Fund Manager
Gold & Silver Trading Alerts
Forex Trading Alerts
Oil Investment Updates
Oil Trading Alerts

