

Earlier today, the USD Index extended yesterday’s gains and approached the level of 95 as investors’ sentiment improved ahead of Federal Reserve Chair Janet Yellen’s speech on Friday. Thanks to this move, EUR/USD slipped under important support line. Will this negative event trigger further deterioration in the coming days?
In our opinion the following forex trading positions are justified - summary:
- EUR/USD: none
- GBP/USD: short (a stop-loss at 1.3579; initial downside target at 1.2519)
- USD/JPY: none
- USD/CAD: none
- USD/CHF: none
- AUD/USD: none
EUR/USD
Yesterday, we wrote the following:
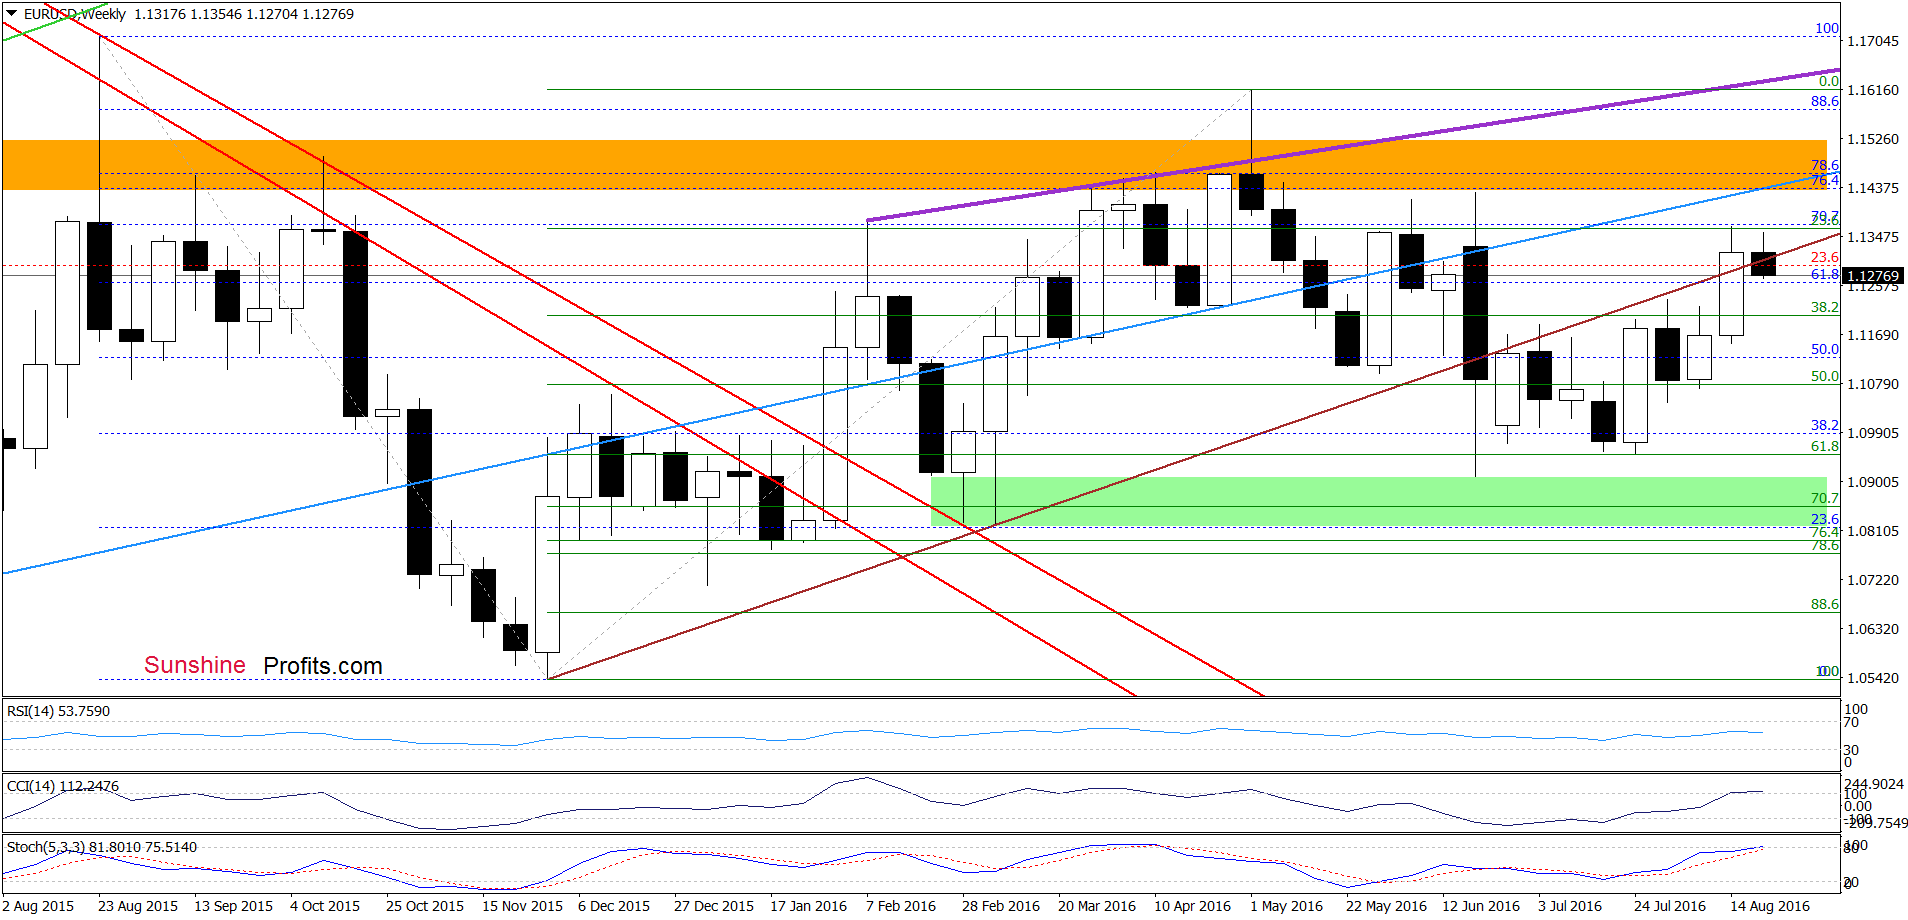
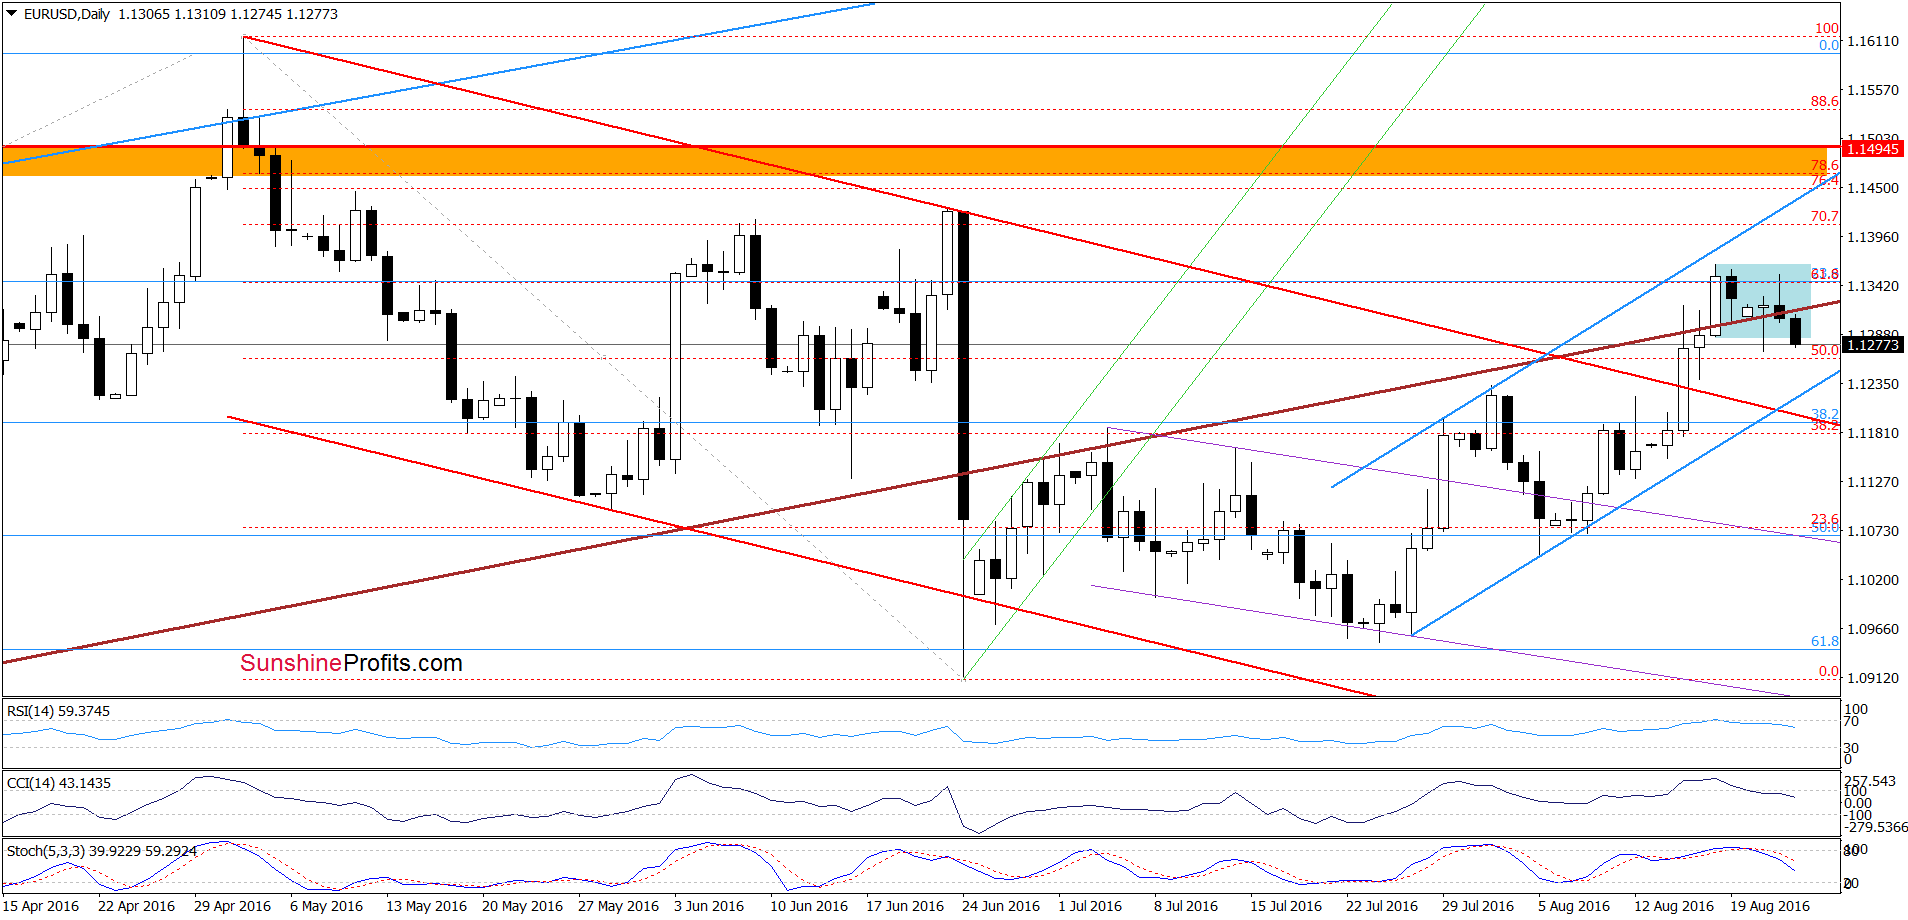
(…) the current position of the daily indicators suggests that lower values of the exchange rate are just around the corner. However, in our opinion such price action will be more likely if EUR/USD closes the day under the brown line.
From today’s point of view, we see that currency bears pushed the pair lower and EUR/USD closed yesterday’s session under the medium-term brown line. This negative event triggered further deterioration earlier today, which in combination with sell signals generated by the indicators suggests lower values of the exchange rate and a test of the lower border of the blue rising trend channel in the coming day(s).
Very short-term outlook: mixed wih bearish bias
Short-term outlook: mixed
MT outlook: mixed
LT outlook: mixed
Trading position (short-term; our opinion): No positions are justified from the risk/reward perspective. We will keep you informed should anything change, or should we see a confirmation/invalidation of the above.
USD/CAD
The medium-term picture hasn’t changed much, because USD/CAD is still trading in the blue consolidation. Today, we’ll focus on the very short-term chart.

Quoting our Monday’s alert:
(…) USD/CAD rebounded sharply, bouncing off the red support line (which means that closing short positions and taking profits off the table was a very good decision) on Friday. Earlier today, the pair extended gains, which in combination with buy signals generated by the indicators suggests further improvement in the coming days. If this is the case, and we’ll see such price action, the initial upside target would be around 1.2948, where the 38.2% Fibonacci retracement based on the entire recent downward move (between the Jul 27 and Aug 18) is.
On the daily chart, we see that the situation developed in line with the above scenario and USD/CAD reached our first upside target. As you see, this resistance encouraged currency bears to act, which resulted in a pullback yesterday. Despite this move, the pair rebounded and remains in a blue consolidation under the above-mentioned Fibonacci retracement. Taking this fact into account, we think that another bigger move will be more likely only if the exchange rate breaks above the upper line of the formation. In this case, we’ll likely see a test of the late-Jul and early Aug lows (reinforced by the 50% retracement) in the following days.
Very short-term outlook: mixed with bullish bias
Short-term outlook: mixed
MT outlook: mixed
LT outlook: mixed
Trading position (short-term; our opinion): No positions are justified from the risk/reward perspective. We will keep you informed should anything change, or should we see a confirmation/invalidation of the above.
USD/CHF
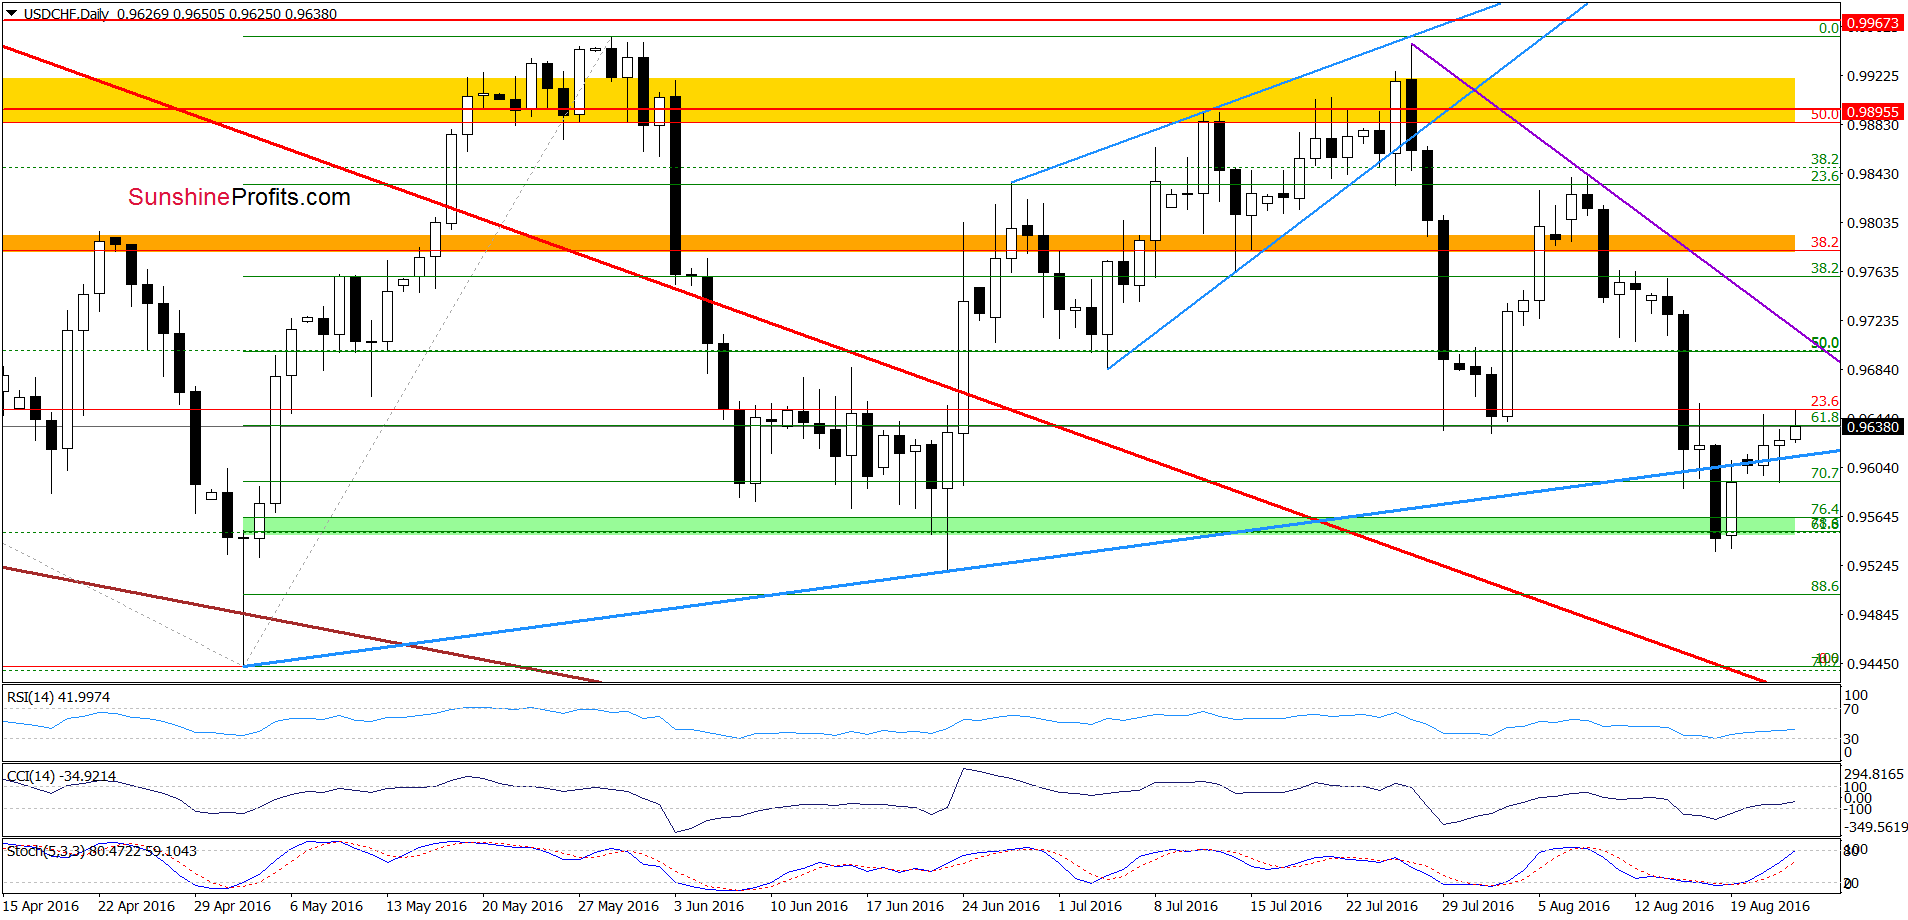
Looking at the daily chart, we see that although USD/CHF slipped under the blue line yesterday, currency bulls managed to stop declines and pushed the pair above this support line, invalidating earlier breakdown. Taking this fact into account, we believe that our previous commentary on this currency pair is up-to-date also today:
(…) the pair extended gains, which resulted in a comeback above the previously-broken medium-term blue line. Although this is a positive signal (invalidation of the breakdown), we think that it would be more reliable if we see a daily closure above this line. If we see such rice action, USD/CHF will likely extend gains once again and (at least) test the purple declining resistance line in the following days.
Finishing today’s alert, we would like to draw your attention to the long-term chart of USD/CHF.
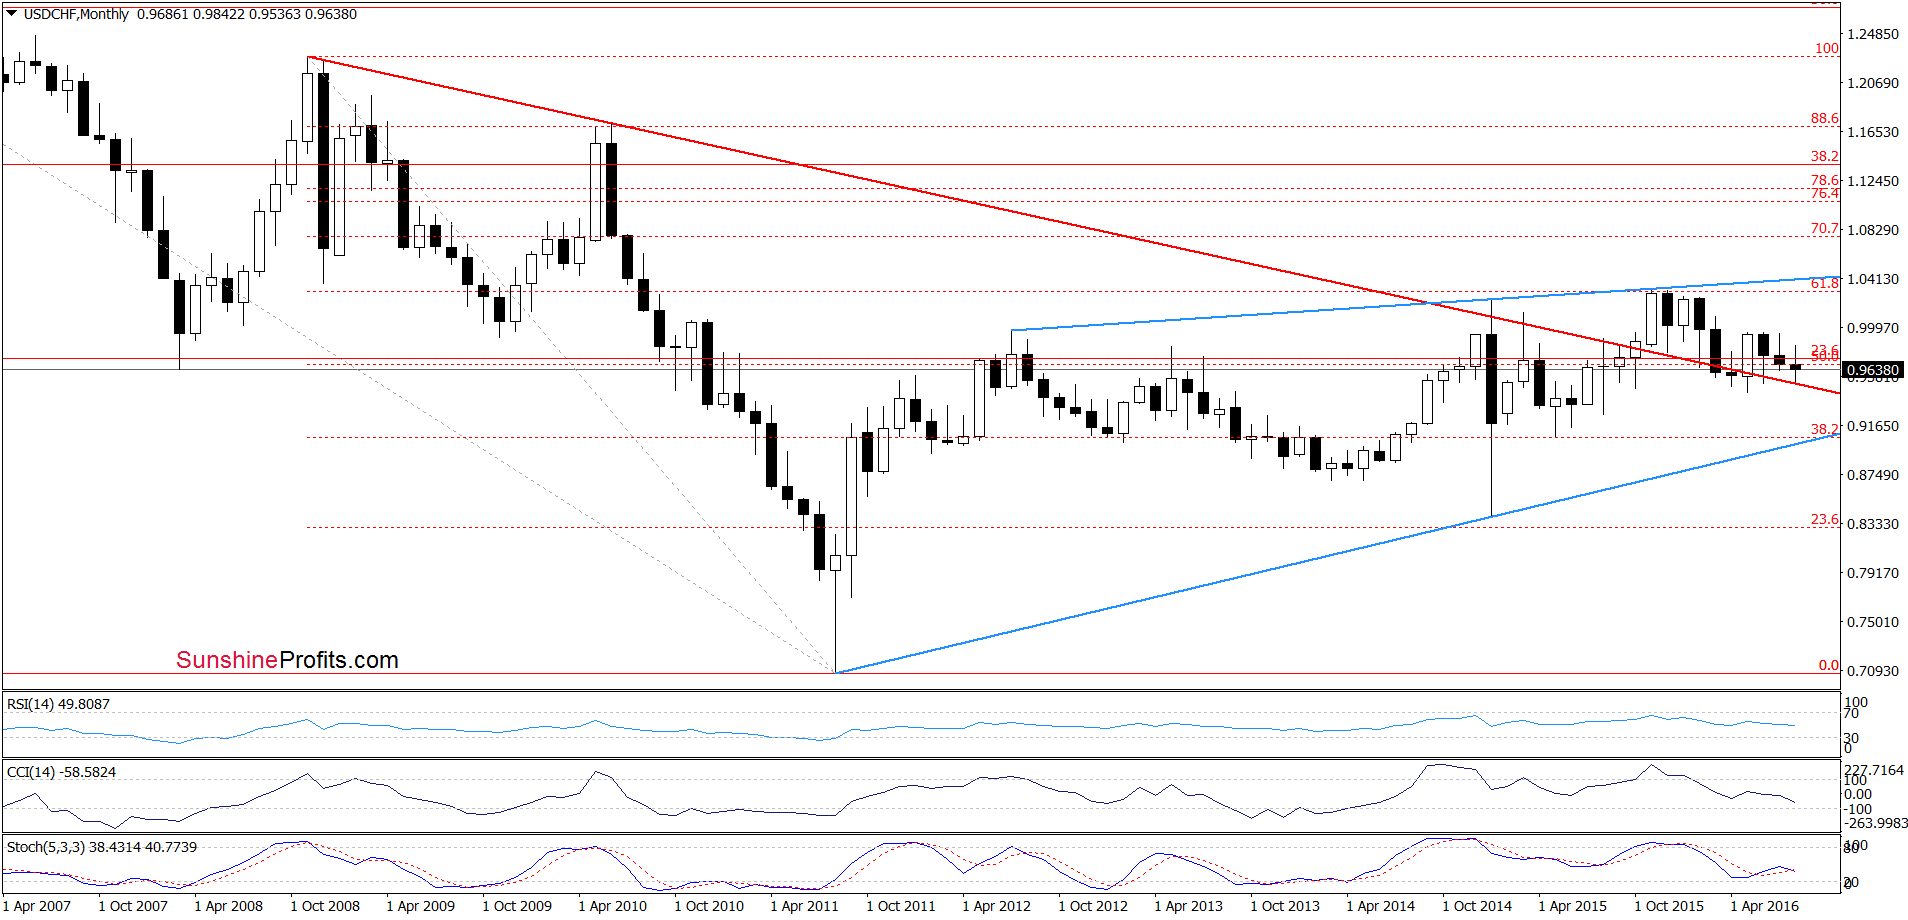
From this perspective, we see that the exchange rate slipped to the long-term red declining support line once again. As you see, several times in the past, this key support line stopped currency bears, which suggests that we may see similar price action here and higher values of USD/CHF in the coming week(s) should not surprise us.
Very short-term outlook: mixed with bullish bias
Short-term outlook: mixed
MT outlook: mixed
LT outlook: mixed
Trading position (short-term; our opinion): No positions are justified from the risk/reward perspective at the moment. We will keep you informed should anything change, or should we see a confirmation/invalidation of the above.
Thank you.
Nadia Simmons
Forex & Oil Trading Strategist
Przemyslaw Radomski, CFA
Founder, Editor-in-chief, Gold & Silver Fund Manager
Gold & Silver Trading Alerts
Forex Trading Alerts
Oil Investment Updates
Oil Trading Alerts

