

In our opinion the following forex trading positions are justified - summary:
- EUR/USD: short (stop-loss at 1.1273; initial downside target at 1.0951)
- GBP/USD: short (stop-loss at 1.3579; initial downside target at 1.2519)
- USD/JPY: none
- USD/CAD: none
- USD/CHF: none
- AUD/USD: none
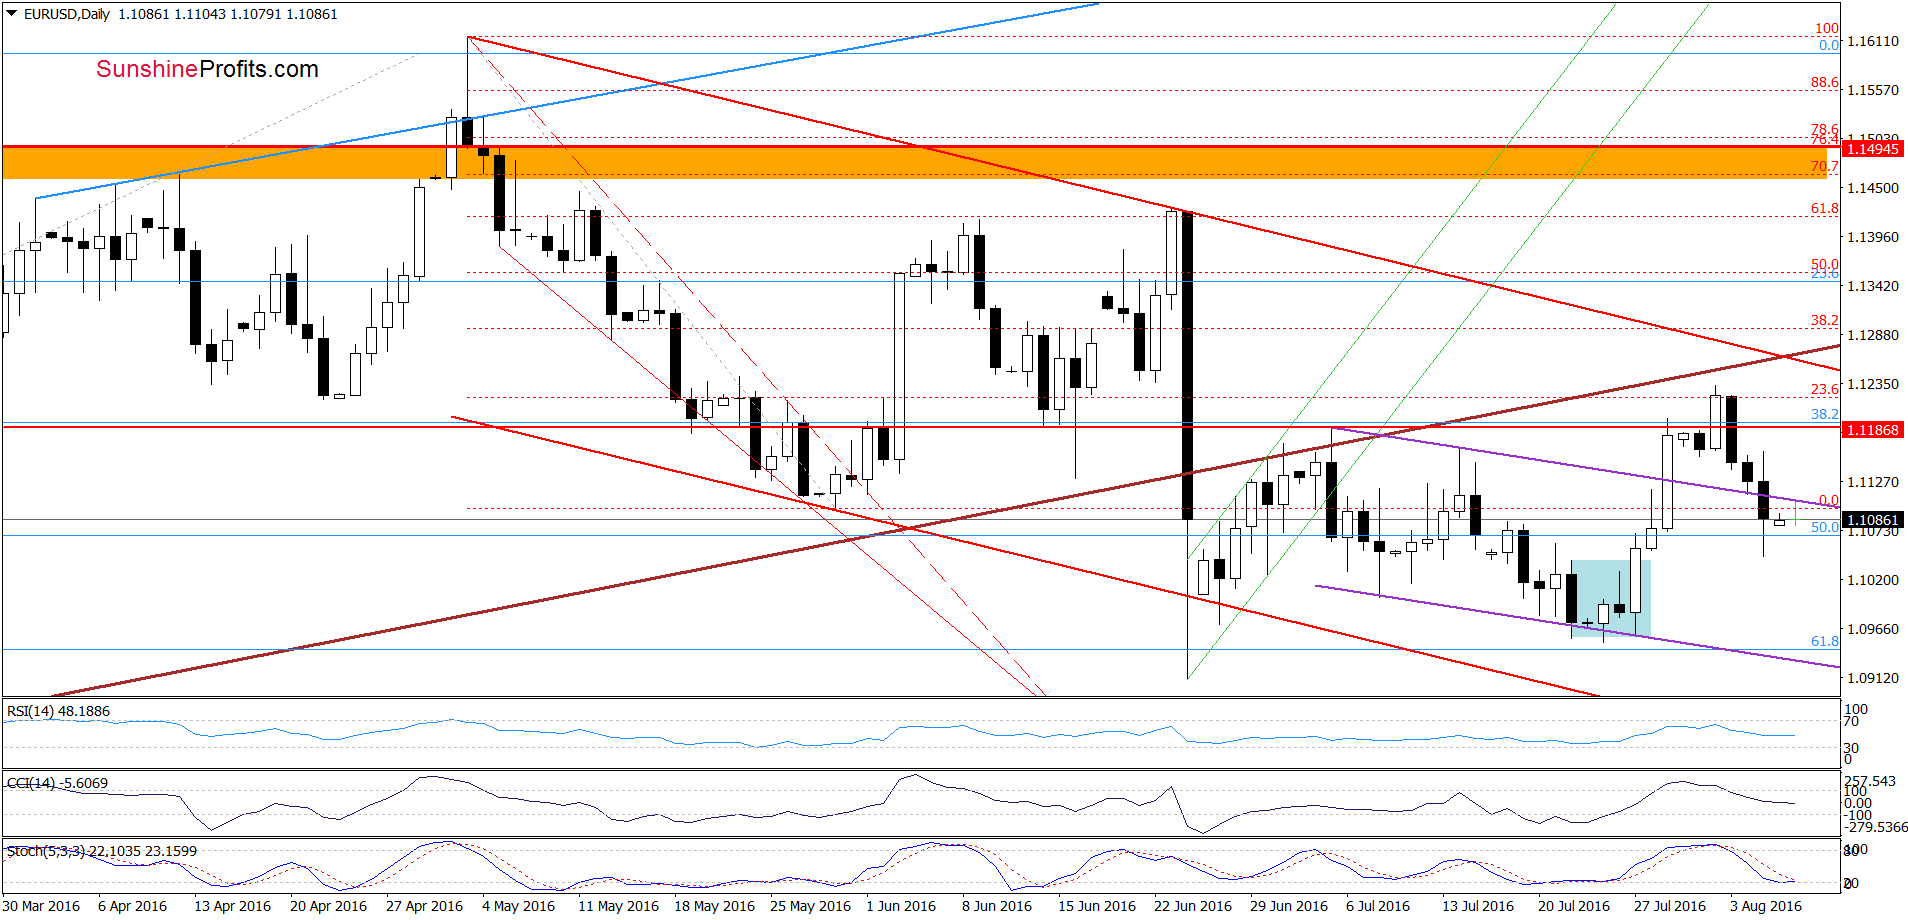
EUR/USD
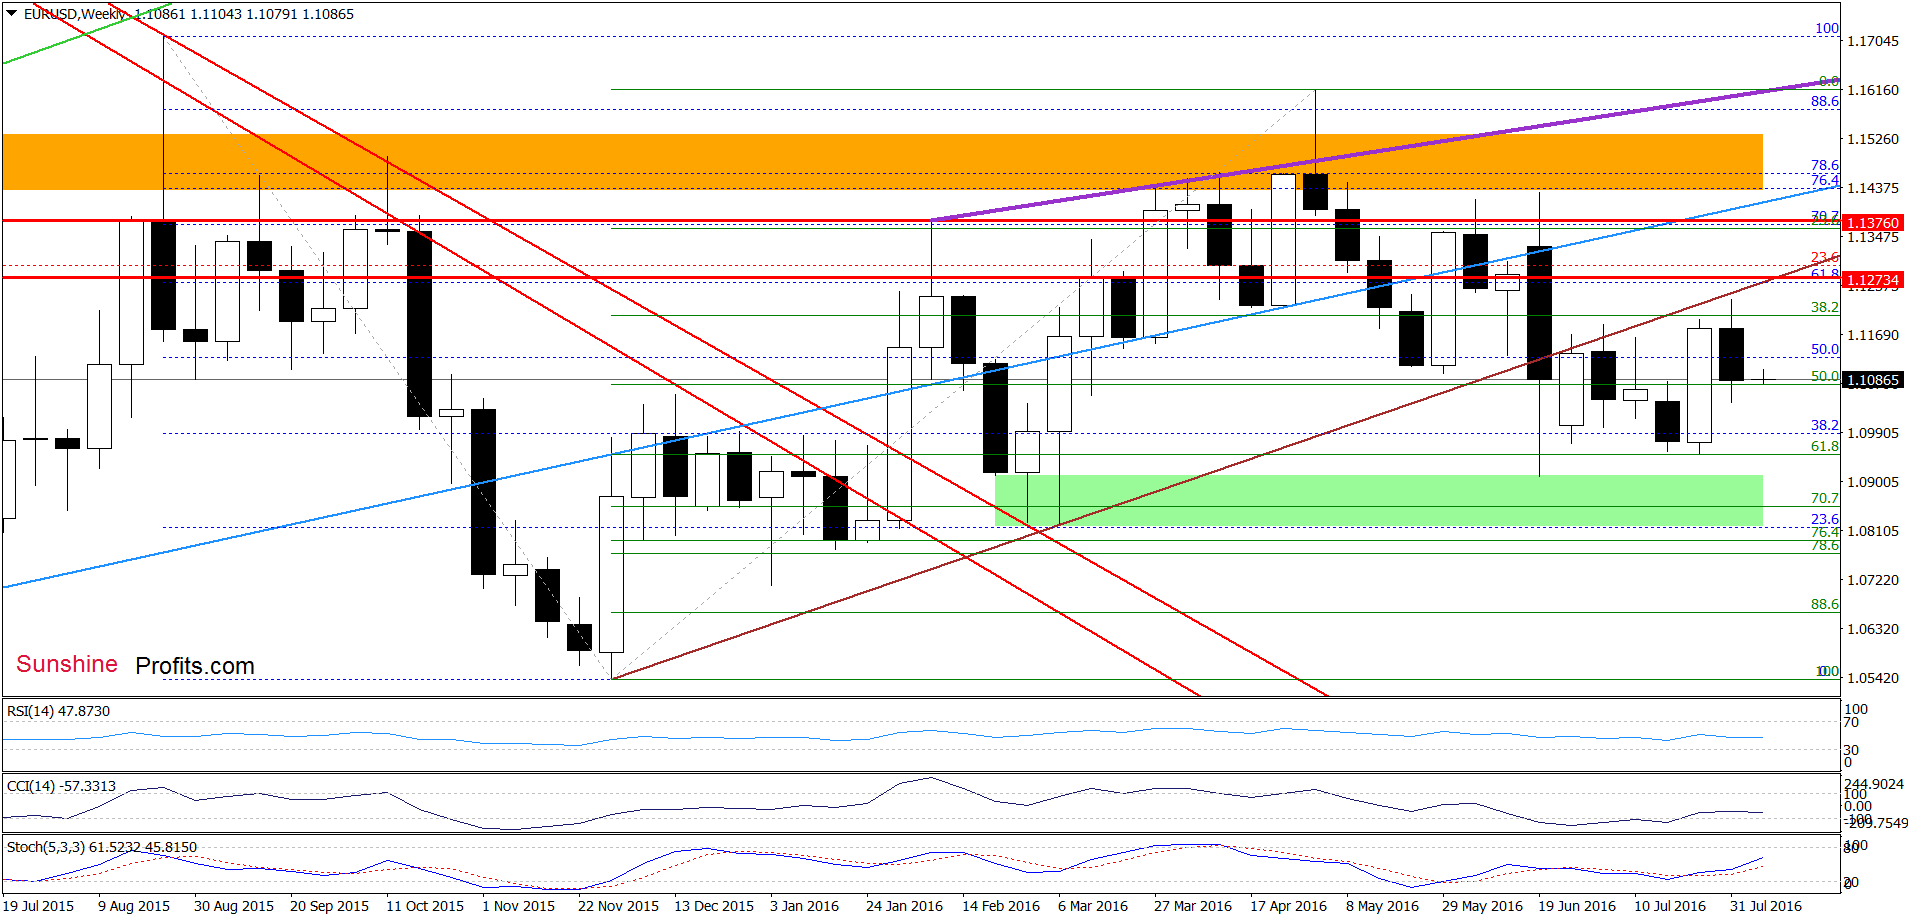
On Friday, we wrote:
(…) the exchange rate remains under the Jul highs and well below the long-term brown resistance line. Additionally, sell signals generated by the indicators remain in place, suggesting another attempt to move lower in the coming days.
Looking at the charts, we see that currency bears pushed the pair lower as we had expected. With Friday’s downswing, EUR/USD dropped under the upper line of the purple declining trend channel and closed the day below it, invalidating earlier breakout. Taking this negative signal into account and combining it with sell signals generated by the indicators, we think that further deterioration is just around the corner and what we wrote in our last alert remains up-to-date:
(…) if (…) the pair drops under the upper line of the purple declining trend channel, we’ll see not only drop to the previous lows, but also a test of the lower line of the formation in the following days.
Very short-term outlook: bearish
Short-term outlook: bearish
MT outlook: mixed with bearish bias
LT outlook: mixed
Trading position (short-term; our opinion): Short positions (with a stop loss order at 1.1273 and initial downside target at 1.0951) are justified from the risk/reward perspective. We will keep you informed should anything change, or should we see a confirmation/invalidation of the above.
GBP/USD
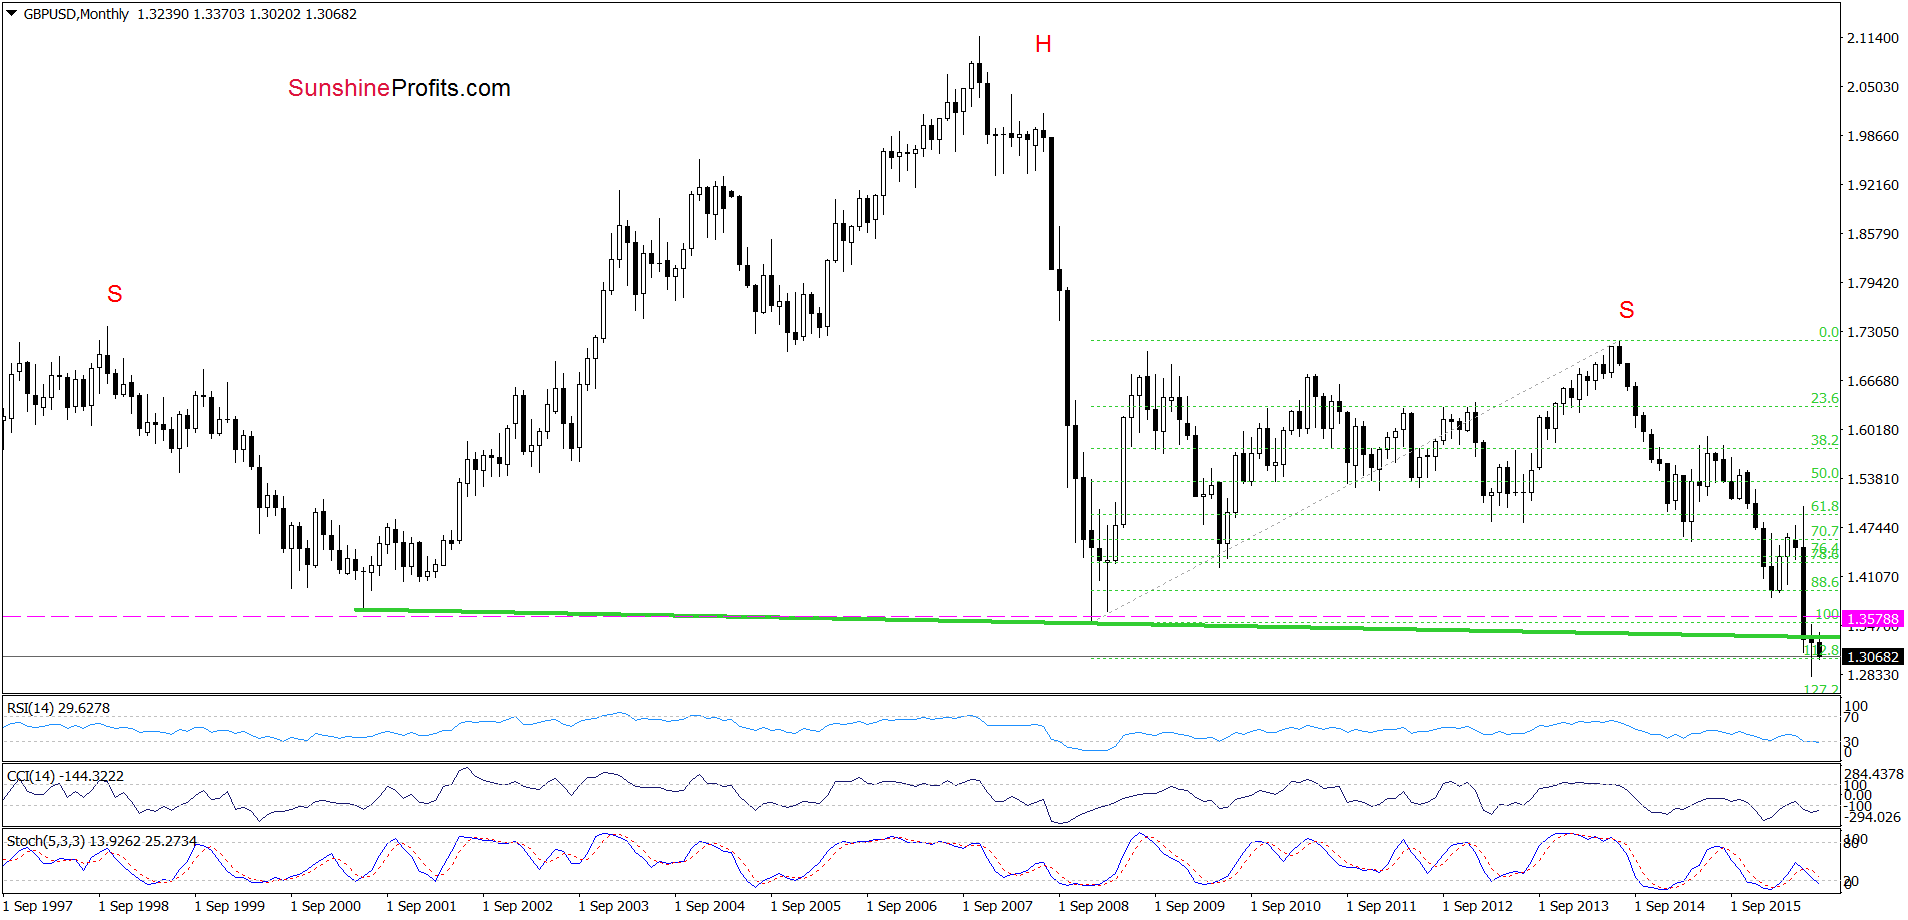
Quoting our previous commentary on this currency pair:
(…) GBP/USD moved higher in recent days and currency bulls pushed the pair to the previously-broken neck line of the head and shoulders formation. Despite this increase, they didn’t manage to hold gained levels, which resulted in a drop under this important line. Taking this fact into account and sell signal generated by the Stochastic Oscillator, we think that this move was just a verification of earlier breakdown. If this is the case, we’ll see further deterioration later in the month.
Looking at the long-term chart, we see that the situation developed in line with the above scenario and GBP/USD extended losses.
How did this move affect the medium-term picture? Let’s check.
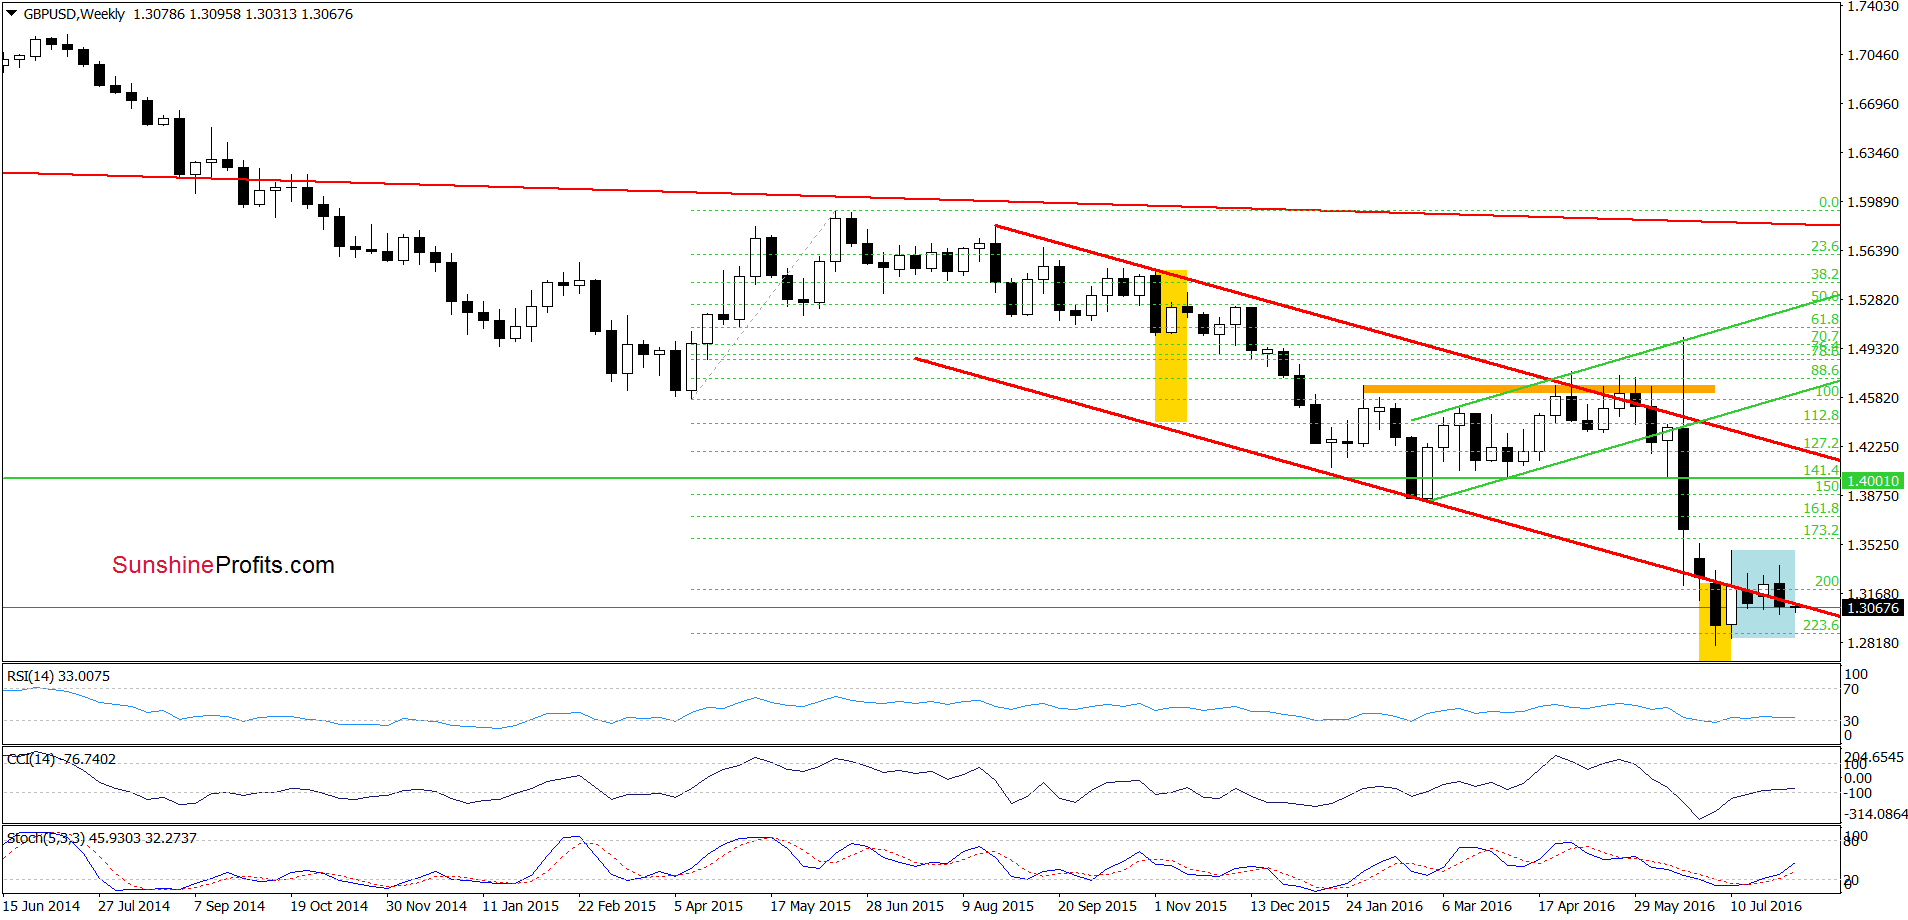
From this perspective, we see that although GBP/USD remains in the blue consolidation the pair declined under the lower border of the red declining trend channel and closed the week below it, invalidating earlier upswing, which is a negative signal that suggests further deterioration.
Are there any other technical factors that could encourage currency bears to act? Let’s examine the daily chart and find out.
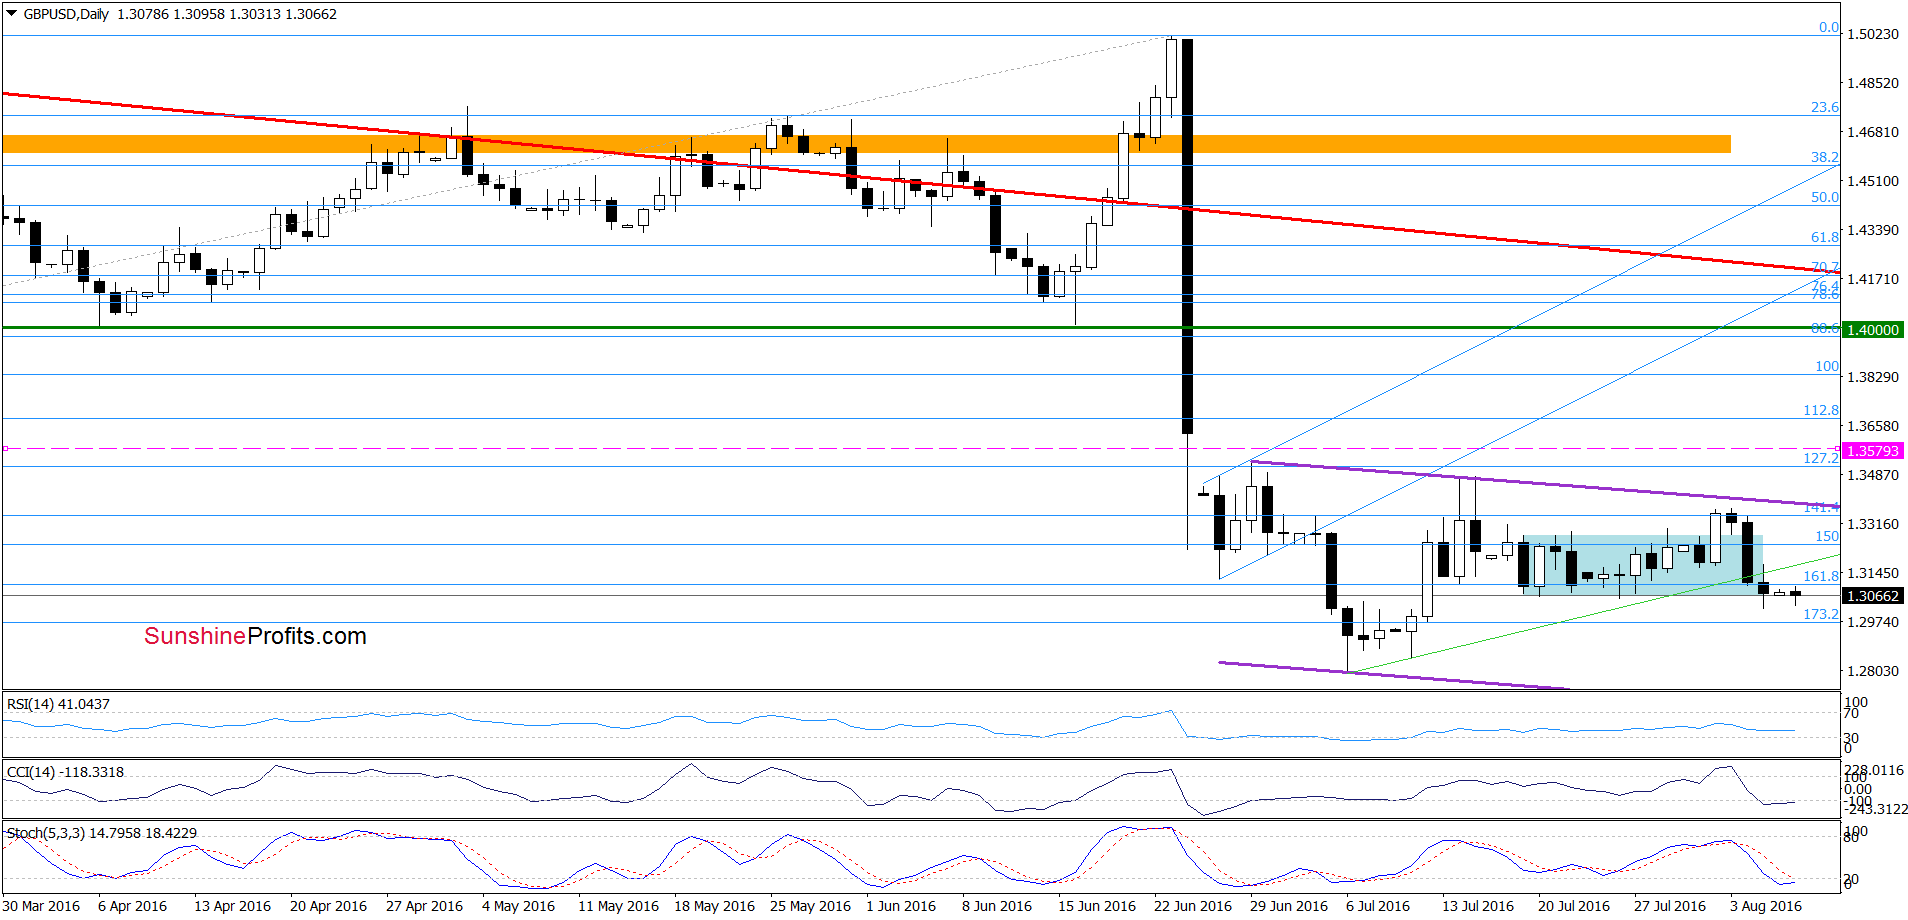
On Thursday, we wrote the following:
(…) although GBP/USD broke above the upper border of the blue consolidation, currency bulls didn’t manage to push the exchange rate above the upper border of the purple declining trend channel, which resulted in a pullback. Taking this fact into account and the current position of the indicators (they are very close to generating sell signals), we think that lower values of GBPUSD are just around the corner. If this is the case and the pair invalidates earlier breakout above the upper line of the consolidation, we’ll see further declines and (at least) a test of the green support line based on the previous lows (currently around 1.3127) in the following days.
On the daily chart, we see that currency bears pushed the pair lower as we had expected. As a result, GBP/USD declined not only below the green support line, but also reached the lower border of the blue consolidation. Although the exchange rate may rebound from here in the coming day(s), we believe that negative image that emerges from the long- and medium-term perspective will trigger another move to the downside in near future. If this is the case, and GBP/USD declines from current levels, we’ll see (at least) a test of the Jul lows.
Very short-term outlook: bearish
Short-term outlook: bearish
MT outlook: bearish
LT outlook: bearish
Trading position (short-term; our opinion): Short positions with a stop-loss at 1.3579 and the initial downside target at 1.2519 are justified from the risk/reward perspective at the moment. We will keep you informed should anything change, or should we see a confirmation/invalidation of the above.
USD/JPY
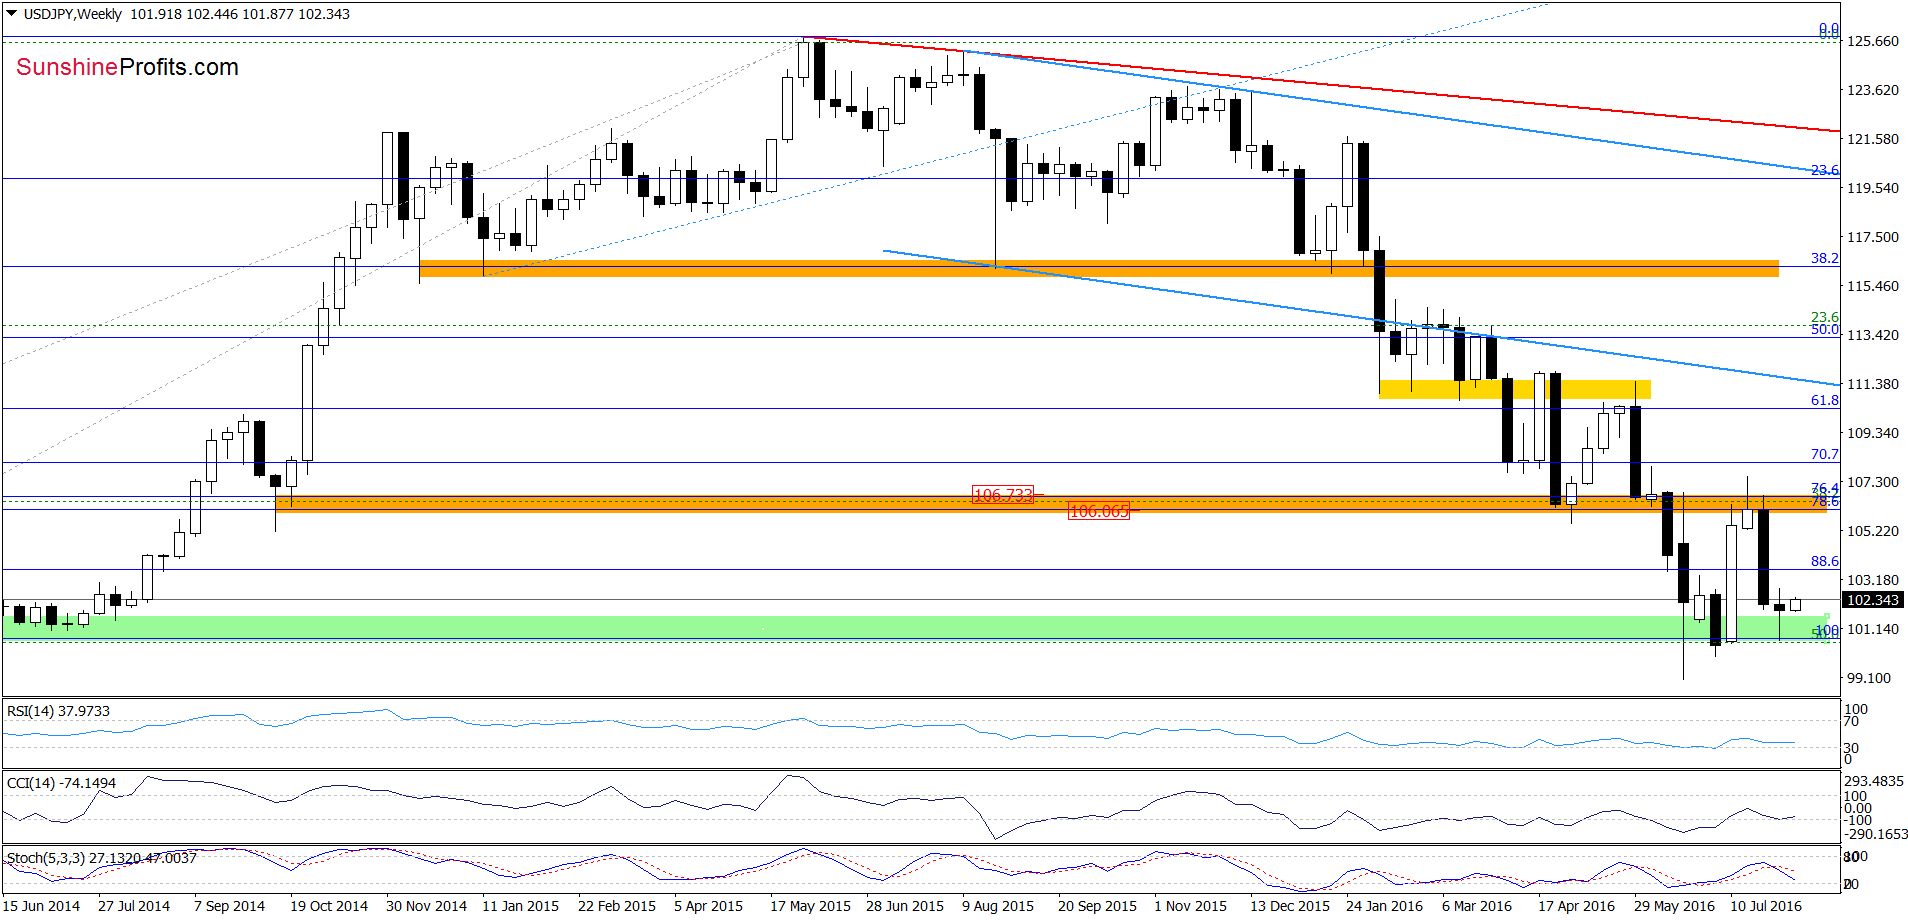
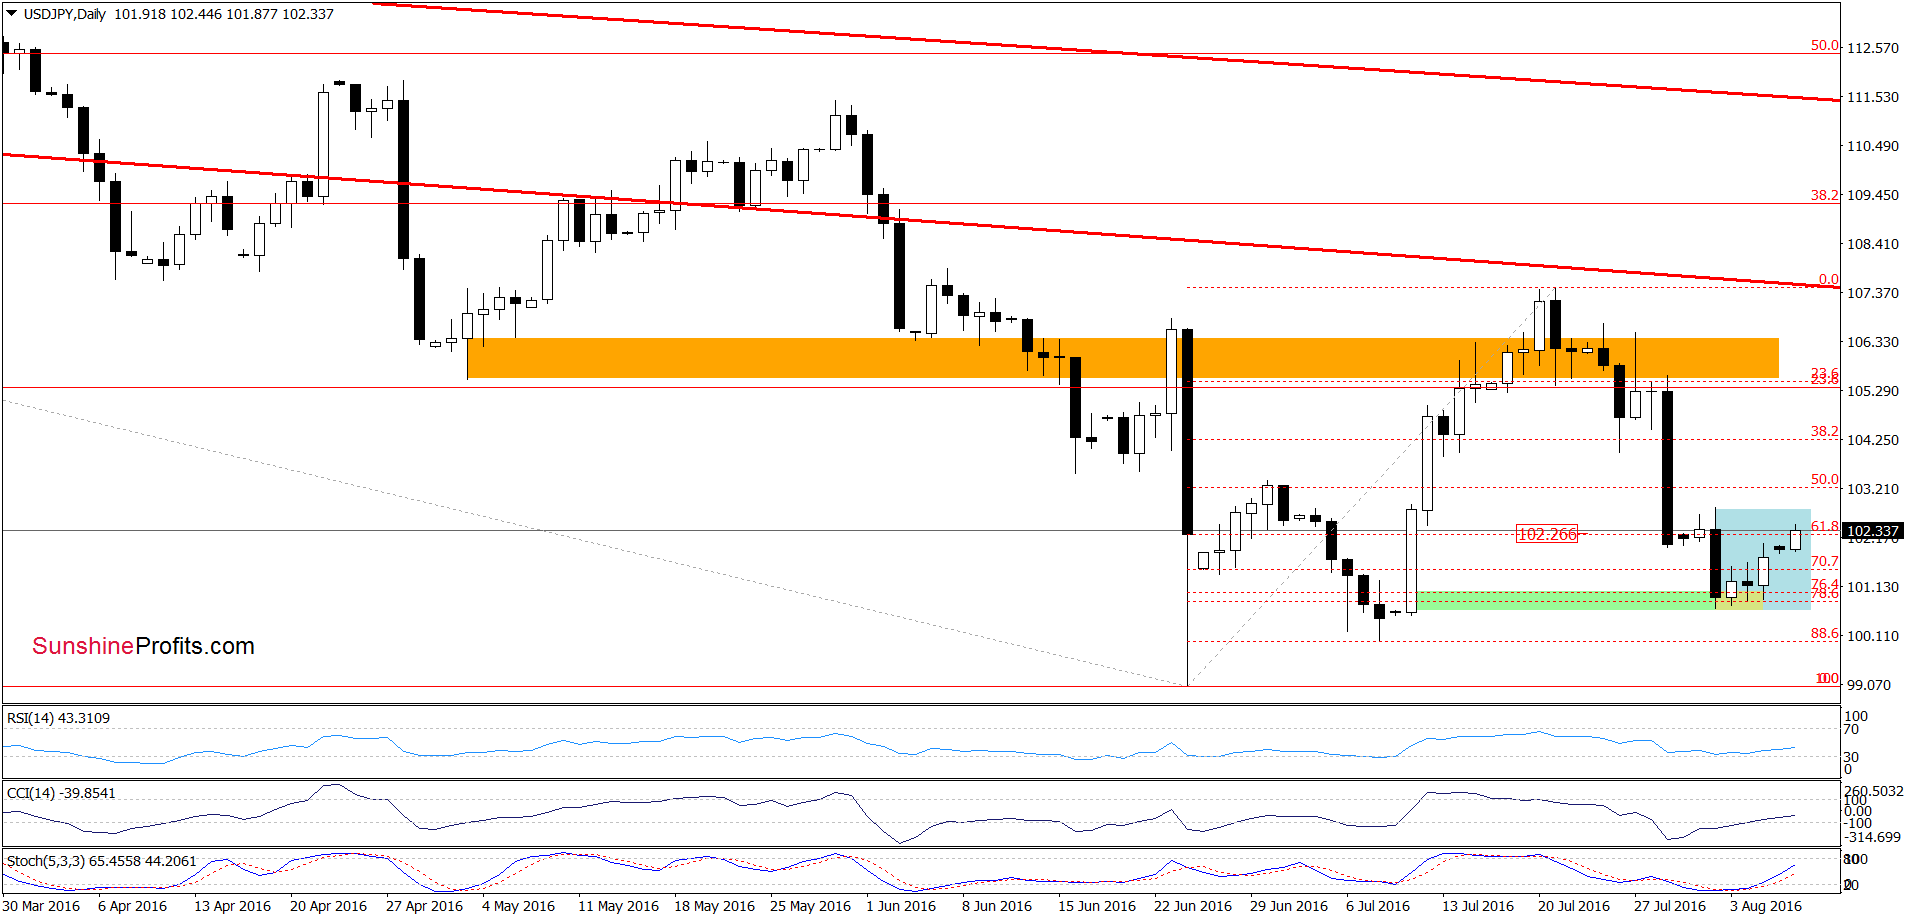
Quoting our previous commentary on this currency pair:
(…) Taking into account the proximity to the above-mentioned support zone and the current position of the daily indicators (the CCI and Stochastic Oscillator generated buy signals) we think that the space for declines may be limited (as the Jul low and the 88.6% Fibonacci retracement are quite close) and higher values of the exchange rate are just around the corner. Therefore if the exchange rate reverses and increases, the initial upside target would be the Tuesday high of 102.81.
From today’s point of view, we see that the situation developed in tune with our assumptions and USD/JPY rebounded on Friday. Earlier today, the pair extended gains, which means that the above-mentioned upside target will be in play in the coming day(s). If the exchange rate breaks above the Tuesday high of 102.81, we may see an upward move even to the previously-broken orange resistance zone in the following days. At this point it is also worth noting that this pro growth scenario is also supported by the current position of daily indicators, which generated buy signals.
Very short-term outlook: mixed with bullish bias
Short-term outlook: mixed with bullish bias
MT outlook: mixed
LT outlook: mixed
Trading position (short-term; our opinion): No positions are justified from the risk/reward perspective at the moment. We will keep you informed should anything change, or should we see a confirmation/invalidation of the above.
USD/CAD
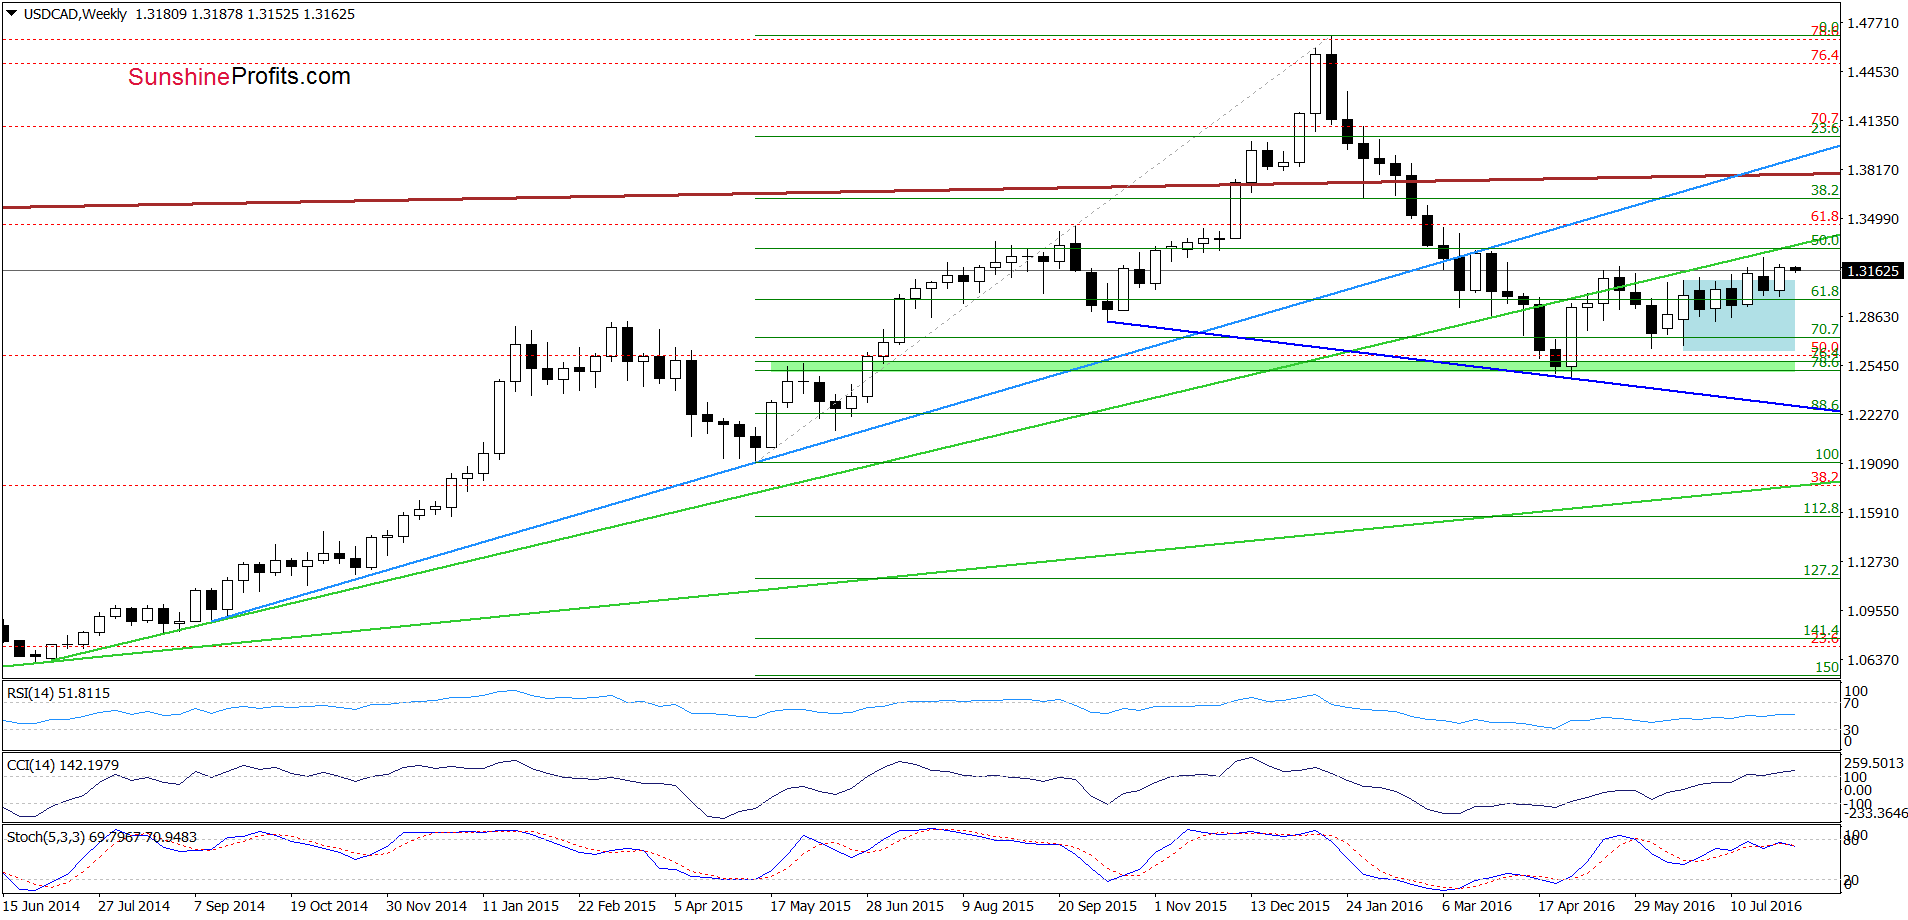
On the weekly chart, we see that although USD/CAD extended losses and came back to the blue consolidation in the previous week, currency bulls didn’t give up and managed to push the pair above the upper line of the formation once again. Taking this fact into account, it seems that we may see another attempt to climb to the previously-broken green line, which serves as the nearest medium-term resistance. Nevertheless, the current position of the indicators suggests that the space for gains may be limited and lower values of the exchange rate are just around the corner.
Having said he above, let’s examine the daily chart and find out what can we infer from it about future moves.
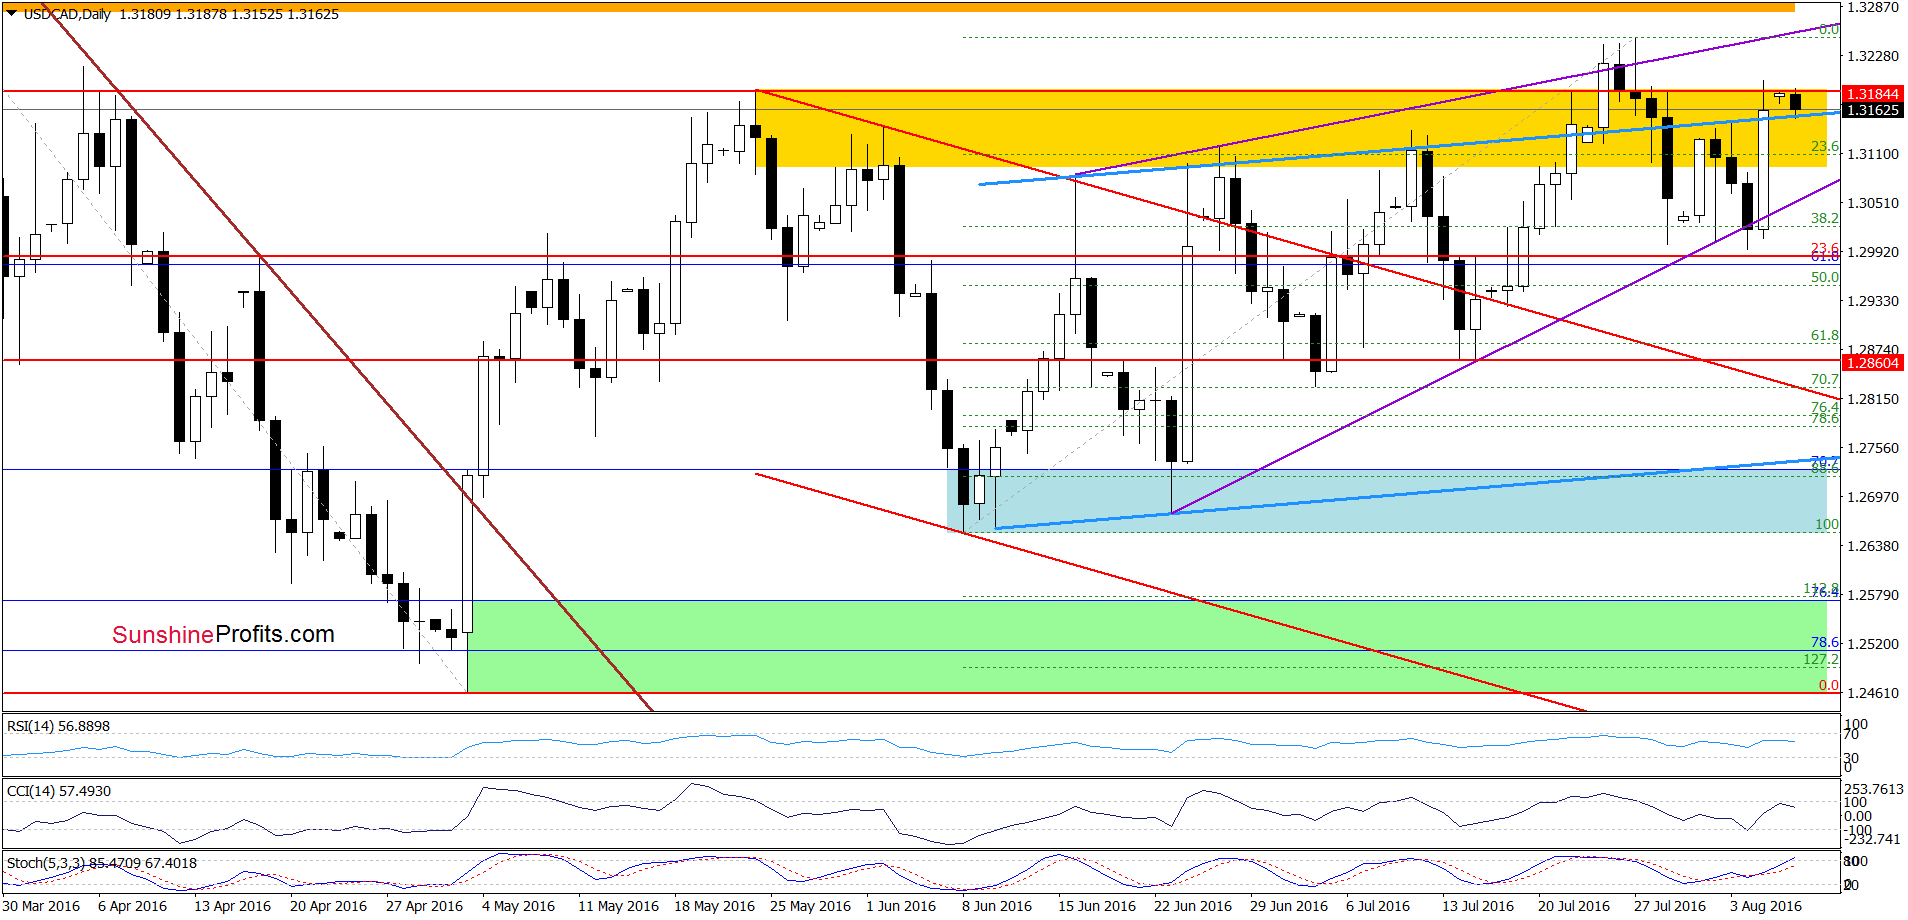
On the daily chart, we see that USD/CAD invalidated small breakdown under the lower border of the purple rising wedge, which triggered a sharp rebound on Friday. With this move, the pair broke above the upper line of the blue rising trend channel and reached the upper border of the yellow resistance zone once again. Earlier today, this area encouraged currency bears to act, which resulted in a small pullback. Additionally, the CCI and Stochastic Oscillator climbed to levels, which could trigger sell signals. Taking all the above into account, we think that further deterioration is just around the corner. Nevertheless, such price action would be more reliable if USD/CAD closes the day below the upper blue line, invalidating Friday’s breakout. In this case, the initial downside target would be the lower border of the purple rising wedge once again.
Very short-term outlook: mixed with bearish bias
Short-term outlook: mixed with bearish bias
MT outlook: mixed
LT outlook: mixed
Trading position (short-term; our opinion): No positions are justified from the risk/reward perspective. We will keep you informed should anything change, or should we see a confirmation/invalidation of the above.
USD/CHF
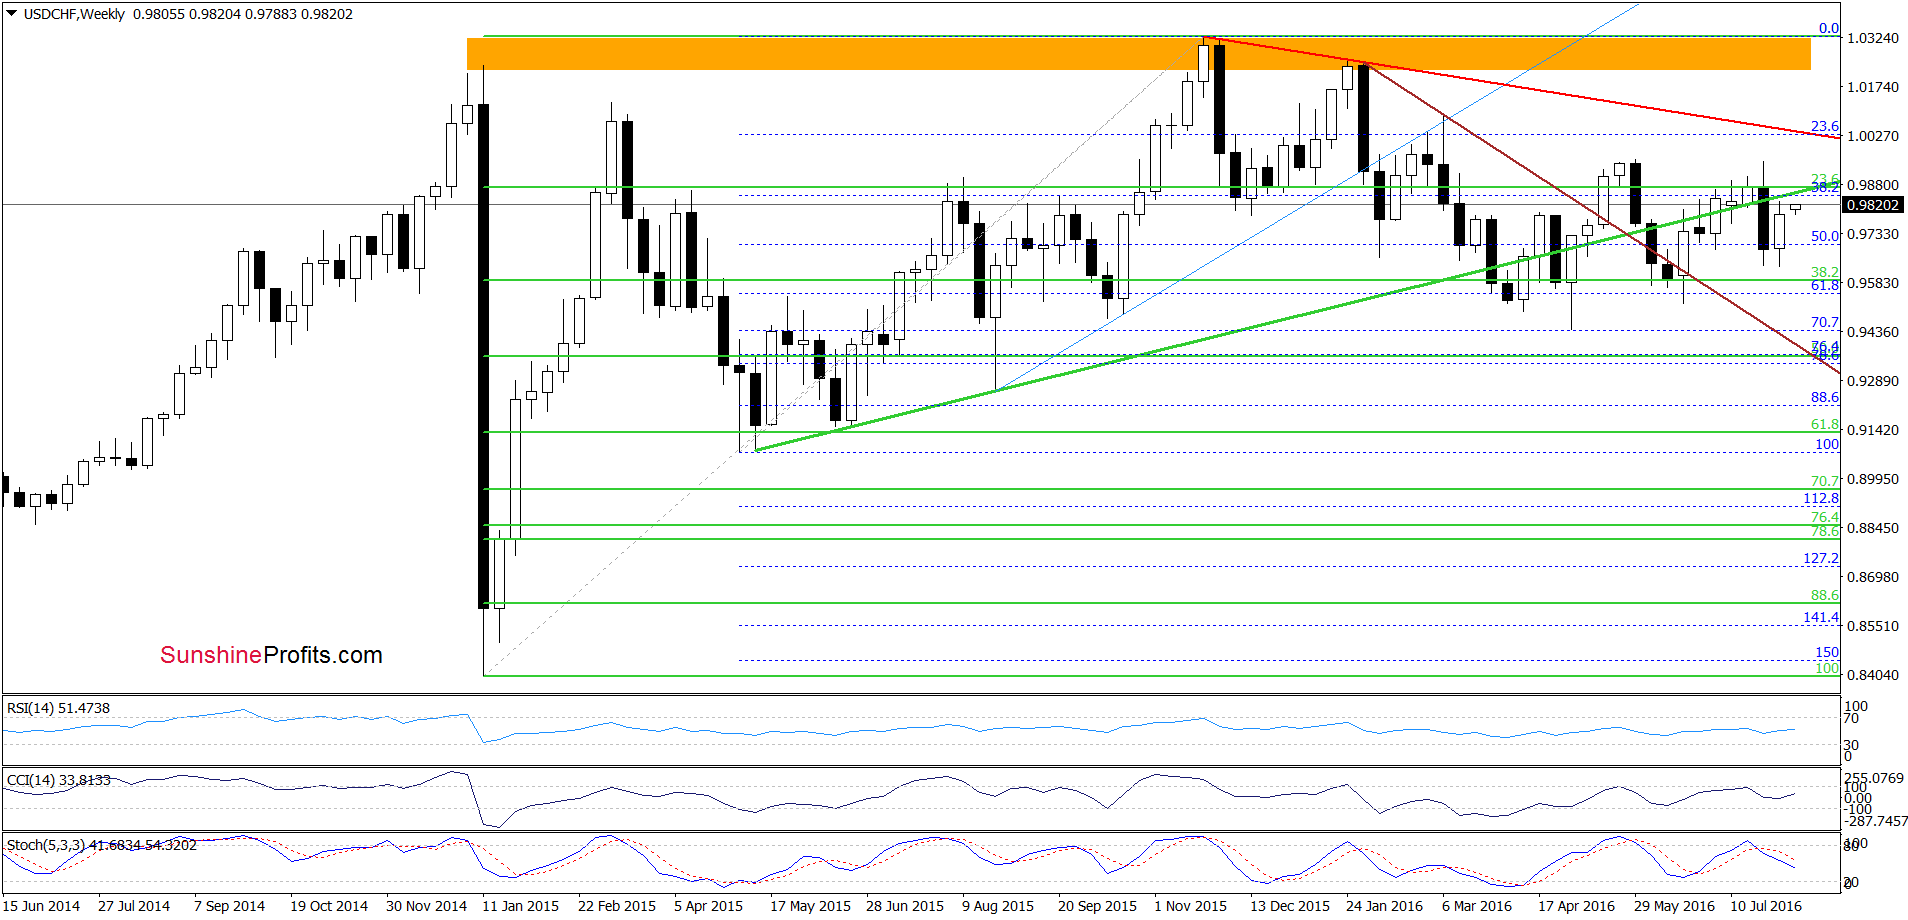
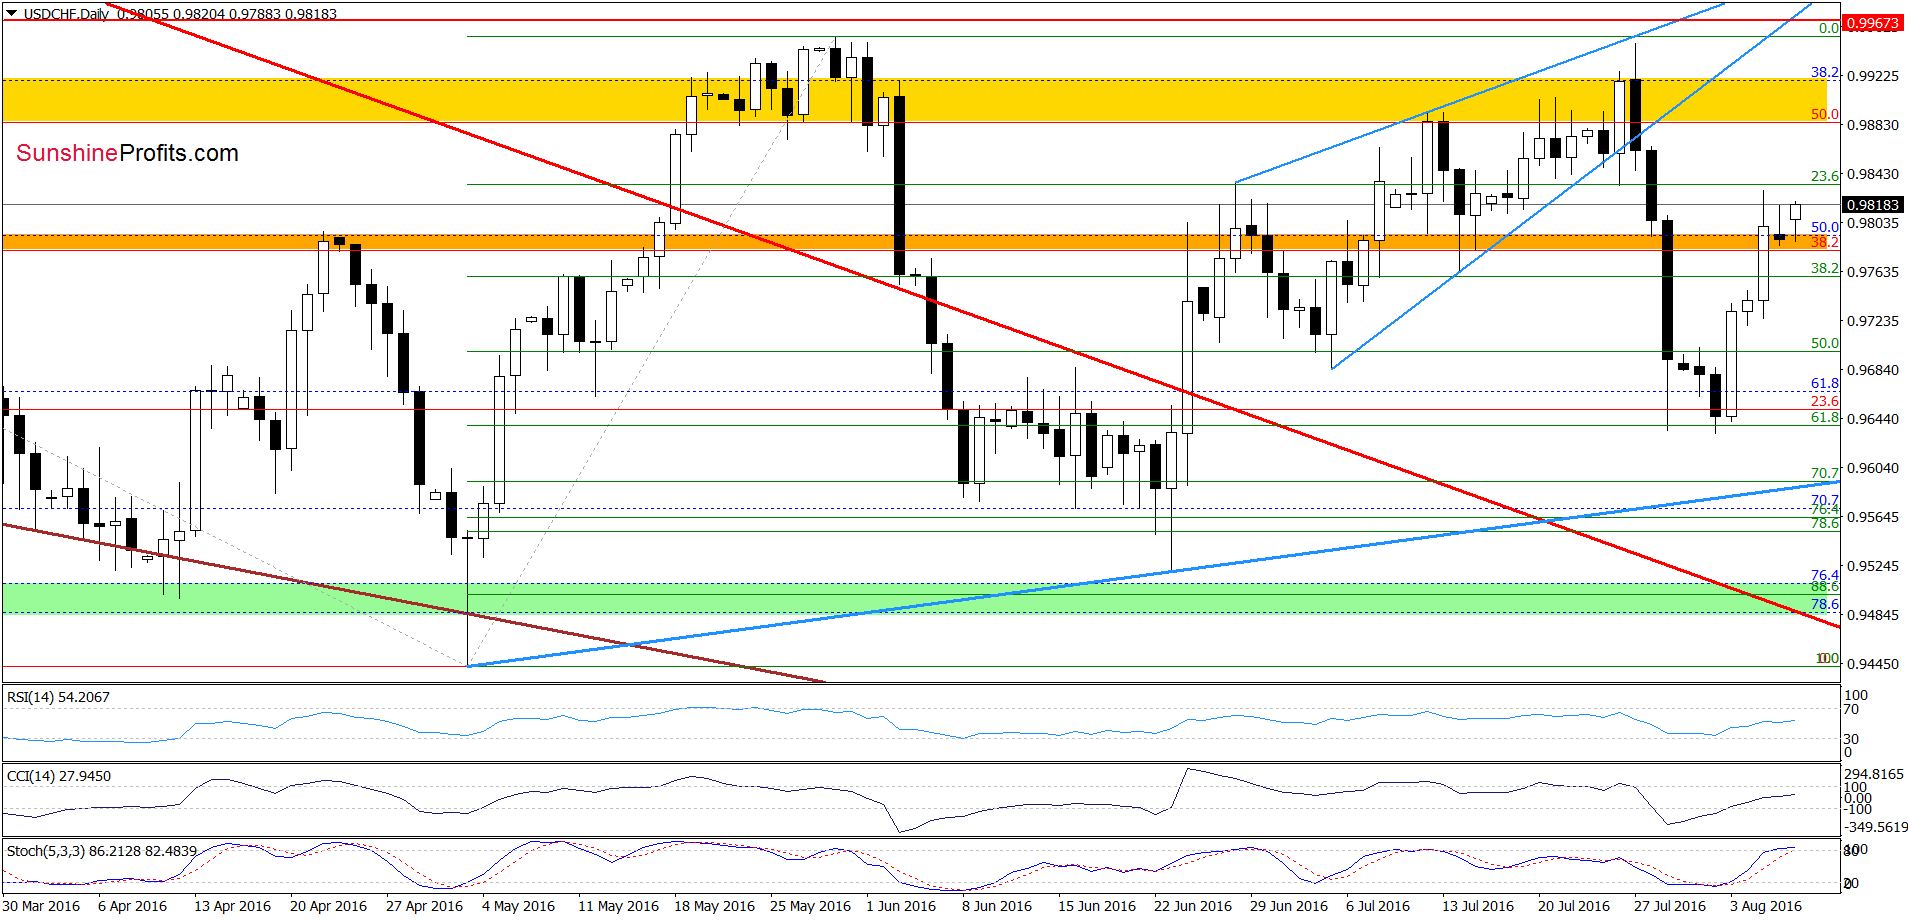
On Thursday, we wrote the following:
(…) the 61.8% Fibonacci retracement triggered a sharp increase yesterday. Earlier today, USD/CHF extended gains, which in combination with buy signals generated by the indicators suggests further improvement and a test of the orange resistance zone or even the previously-broken green resistance line.
As you see on the charts, currency bulls pushed the pair higher as we has expected. Thanks to Friday’s sharp increase, USD/CHF broke above the orange resistance zone and approached the previously-broken green line. Although the exchange rate increased slightly earlier today, it still remains under Friday’s peak. Nevertheless, as long as there won’t be sell signals generated by the indicators, another attempt to move higher is likely. If this is the case, and the pair extends gains, the next upside target would be around 0.9854, where the long-term green resistance line currently is.
Very short-term outlook: mixed
Short-term outlook: mixed
MT outlook: mixed
LT outlook: mixed
Trading position (short-term; our opinion): No positions are justified from the risk/reward perspective at the moment. We will keep you informed should anything change, or should we see a confirmation/invalidation of the above.
AUD/USD
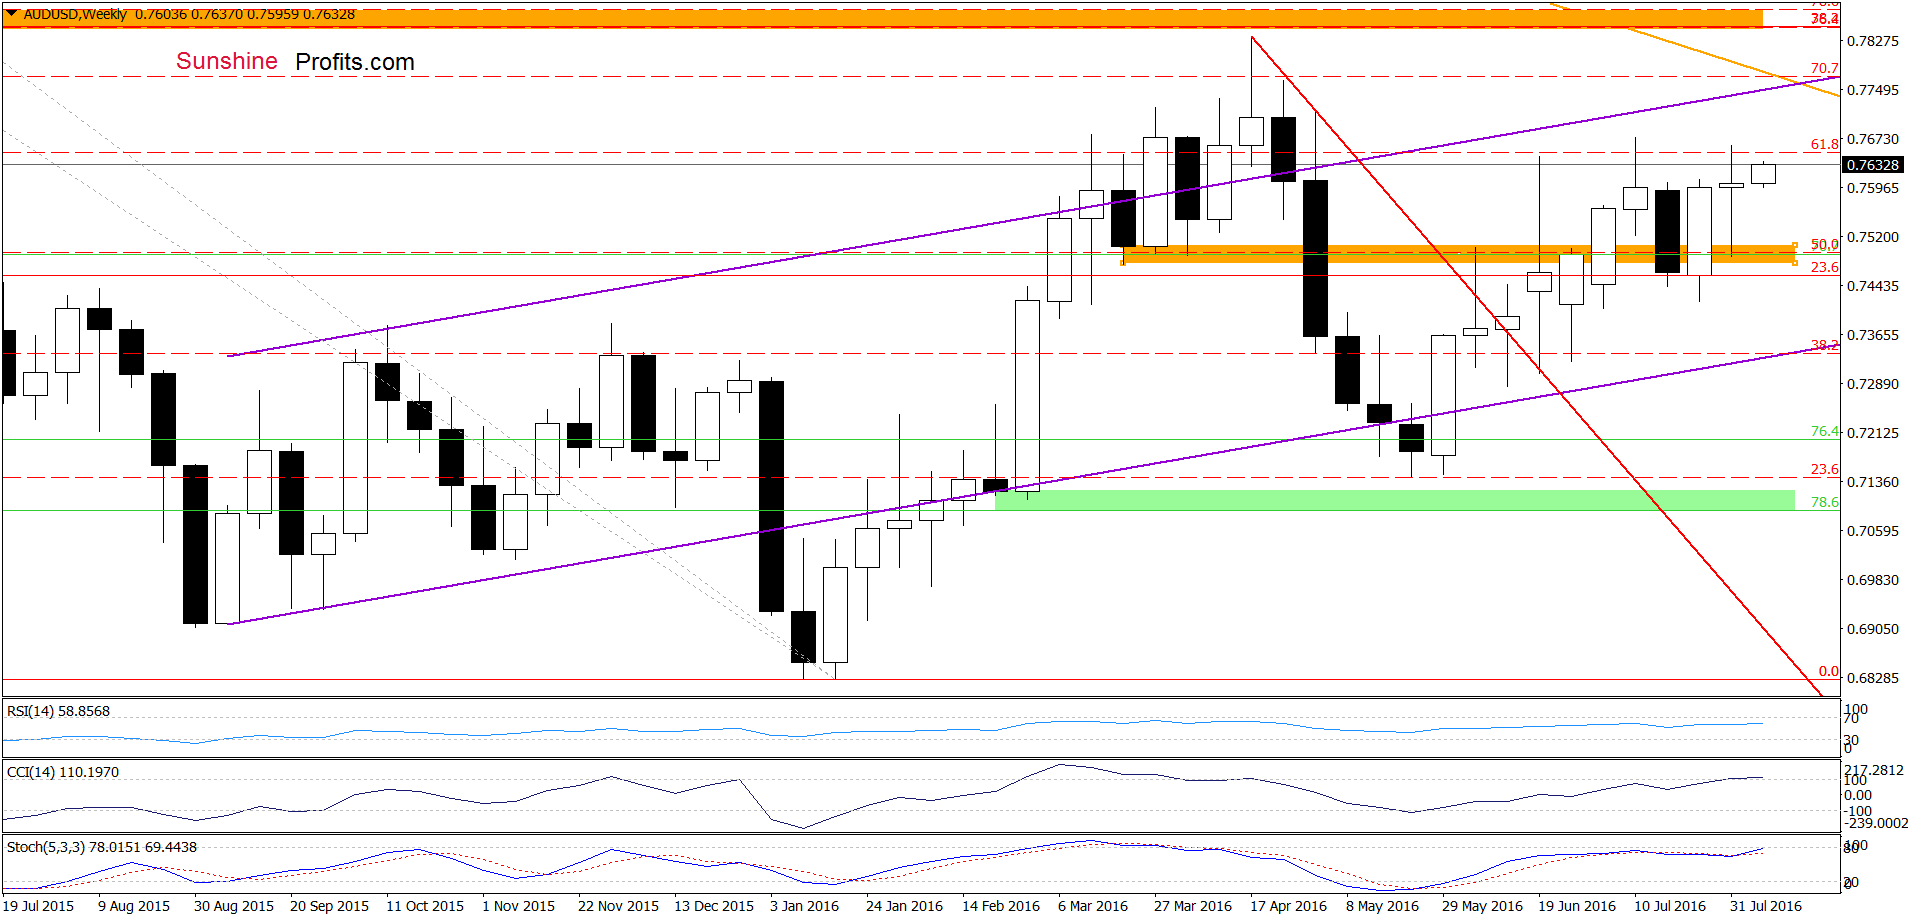
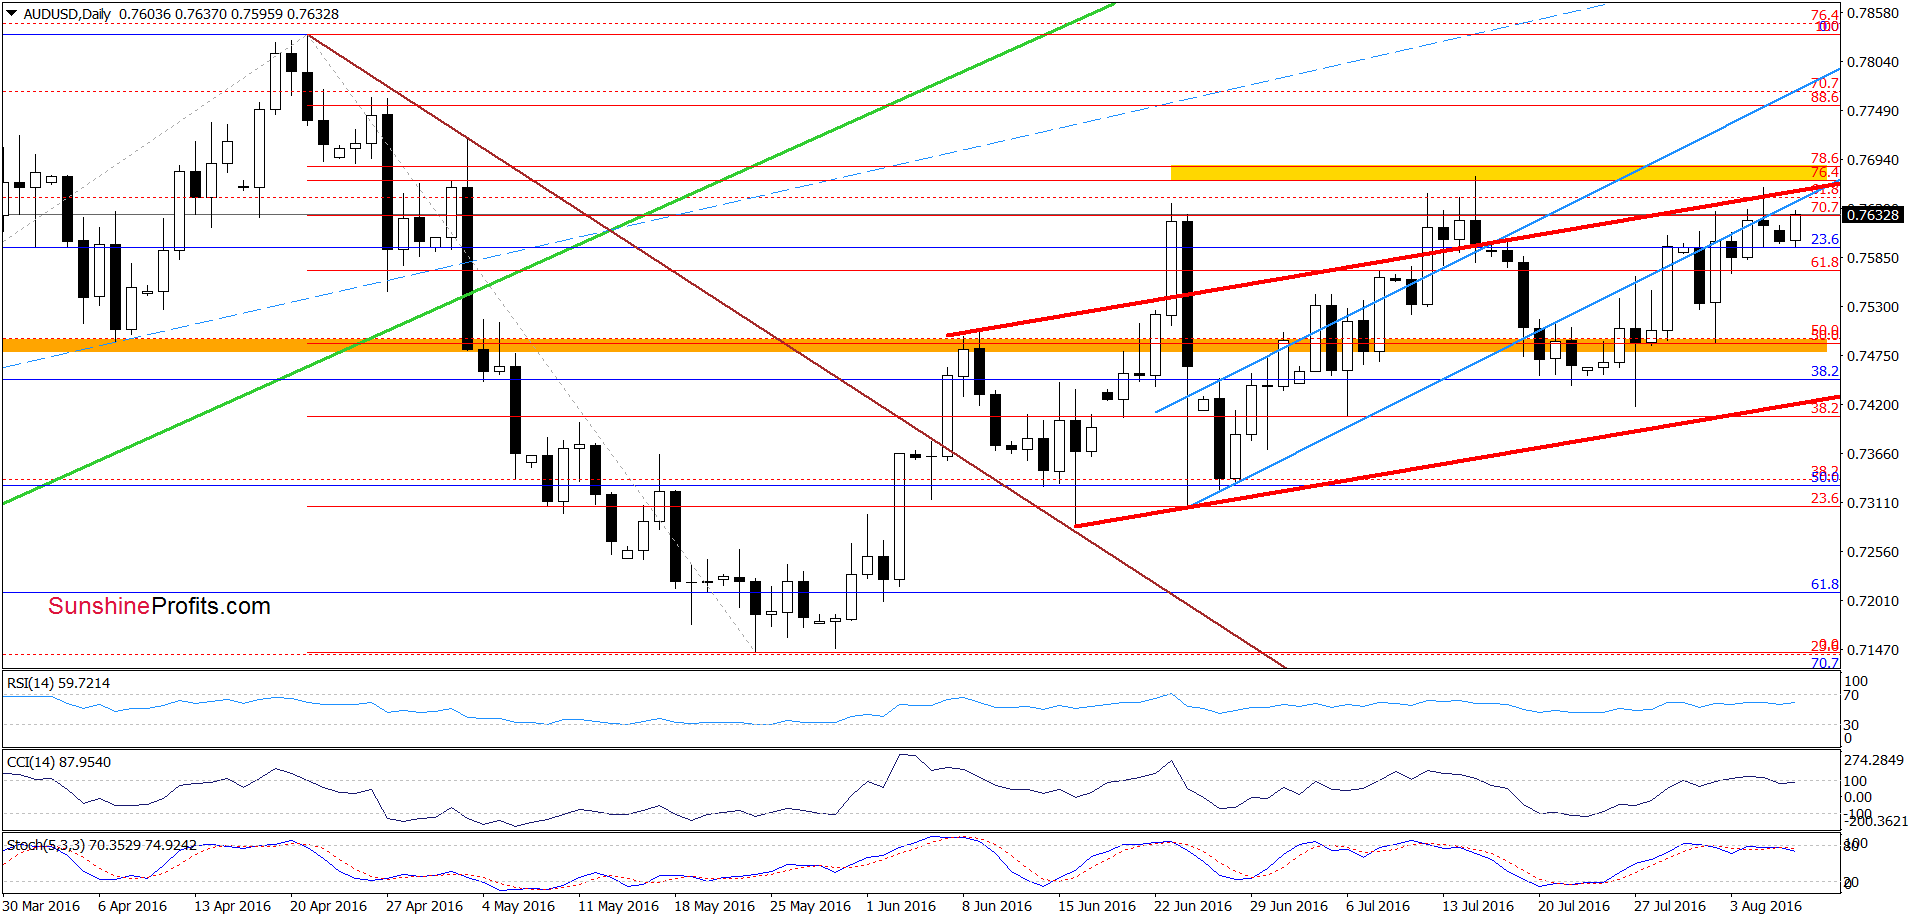
On the daily chart, we see that the upper border of the red rising trend channel in combination with the 70.7% Fibonacci retracement stopped currency bulls on Friday, triggering a pullback. Despite this drop, AUD/USD rebounded earlier today, which may be a verification of the breakdown. Additionally, the current position of daily and weekly indicators suggests that lower values of the exchange rate are just around the corner. Therefore, if currency bulls fail to push AUD/USD above the yellow resistance zone, we’ll see reversal and declines in the coming week. In this case, the initial downside target would be the orange zone once again, which serves as the nearest support at the moment.
Very short-term outlook: mixed with bearish bias
Short-term outlook: mixed
MT outlook: mixed
LT outlook: mixed
Trading position (short-term; our opinion): No positions are justified from the risk/reward perspective. We will keep you informed should anything change, or should we see a confirmation/invalidation of the above.
Thank you.
Nadia Simmons
Forex & Oil Trading Strategist
Przemyslaw Radomski, CFA
Founder, Editor-in-chief
Gold & Silver Trading Alerts
Forex Trading Alerts
Oil Investment Updates
Oil Trading Alerts

