

Earlier today, the greenback increased slightly, moving away from Friday’s lows, which hit following disappointing U.S. growth numbers. As a result, the USD Index climbed above 95.60, but did this move change anything in the current picture of our six currency pairs?
In our opinion the following forex trading positions are justified - summary:
- EUR/USD: none
- GBP/USD: short (a stop-loss at 1.3579; initial downside target at 1.2519)
- USD/JPY: none
- USD/CAD: none
- USD/CHF: short (a stop loss at 0.9967; initial downside target at 0.9692)
- AUD/USD: none
EUR/USD
Quoting our Friday’s alert:
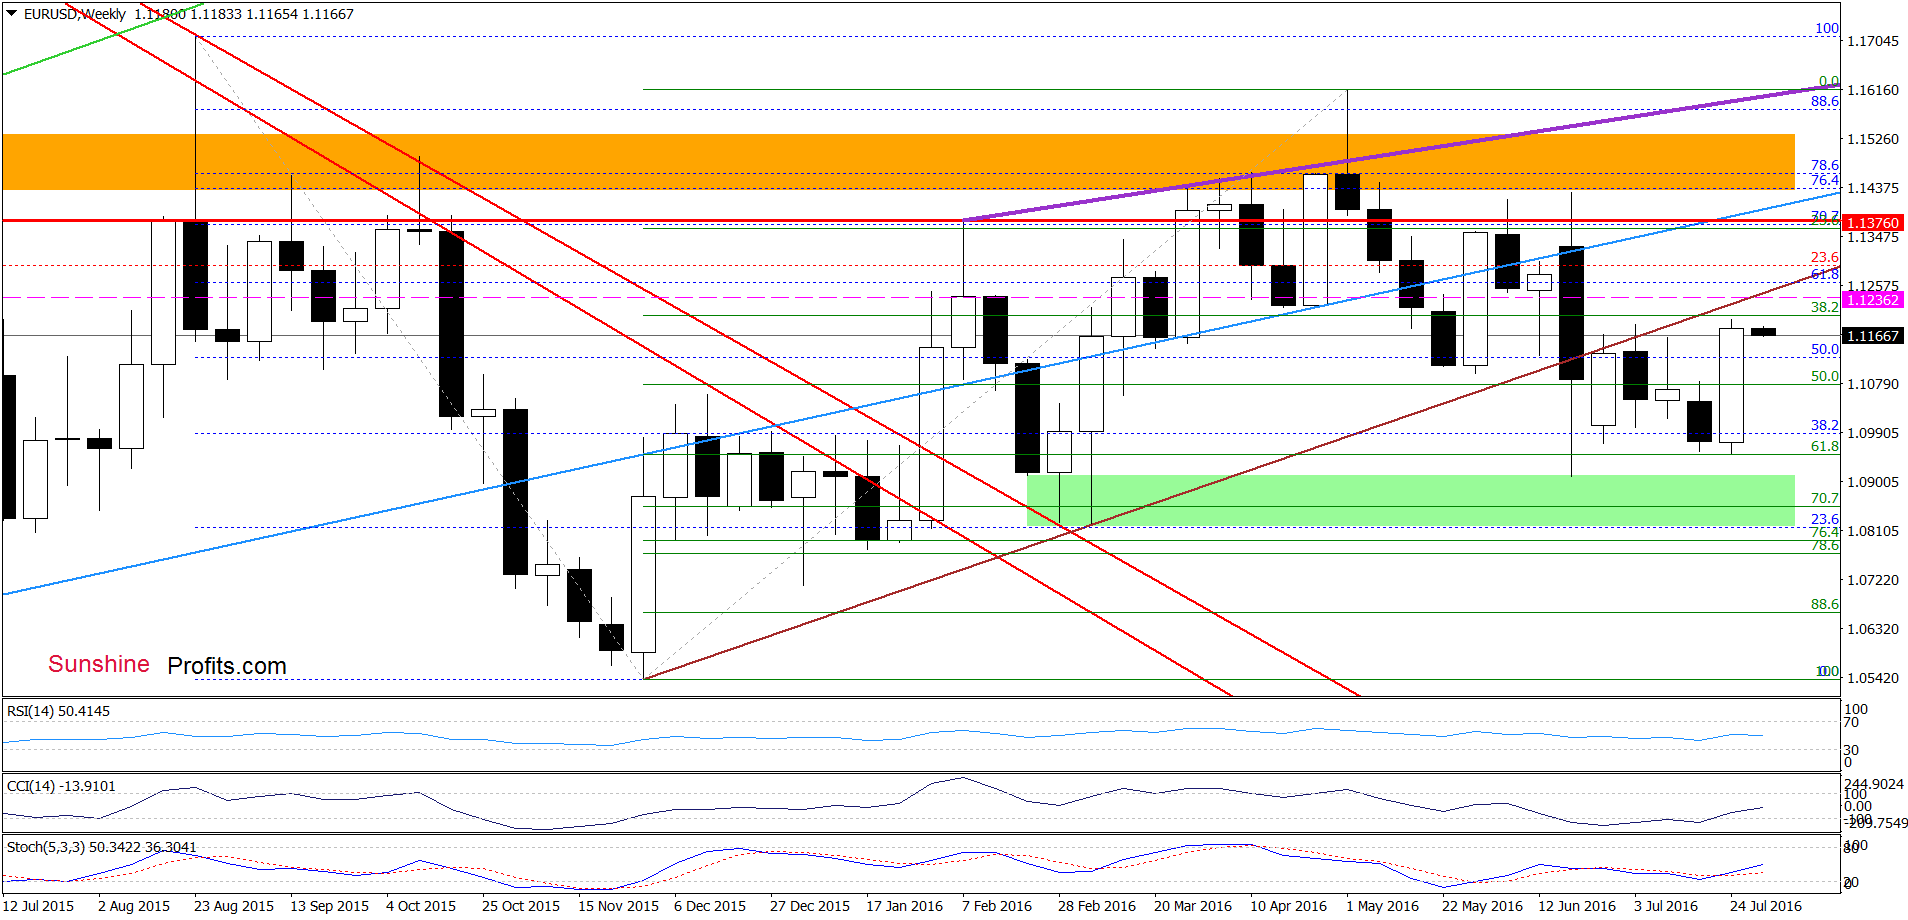
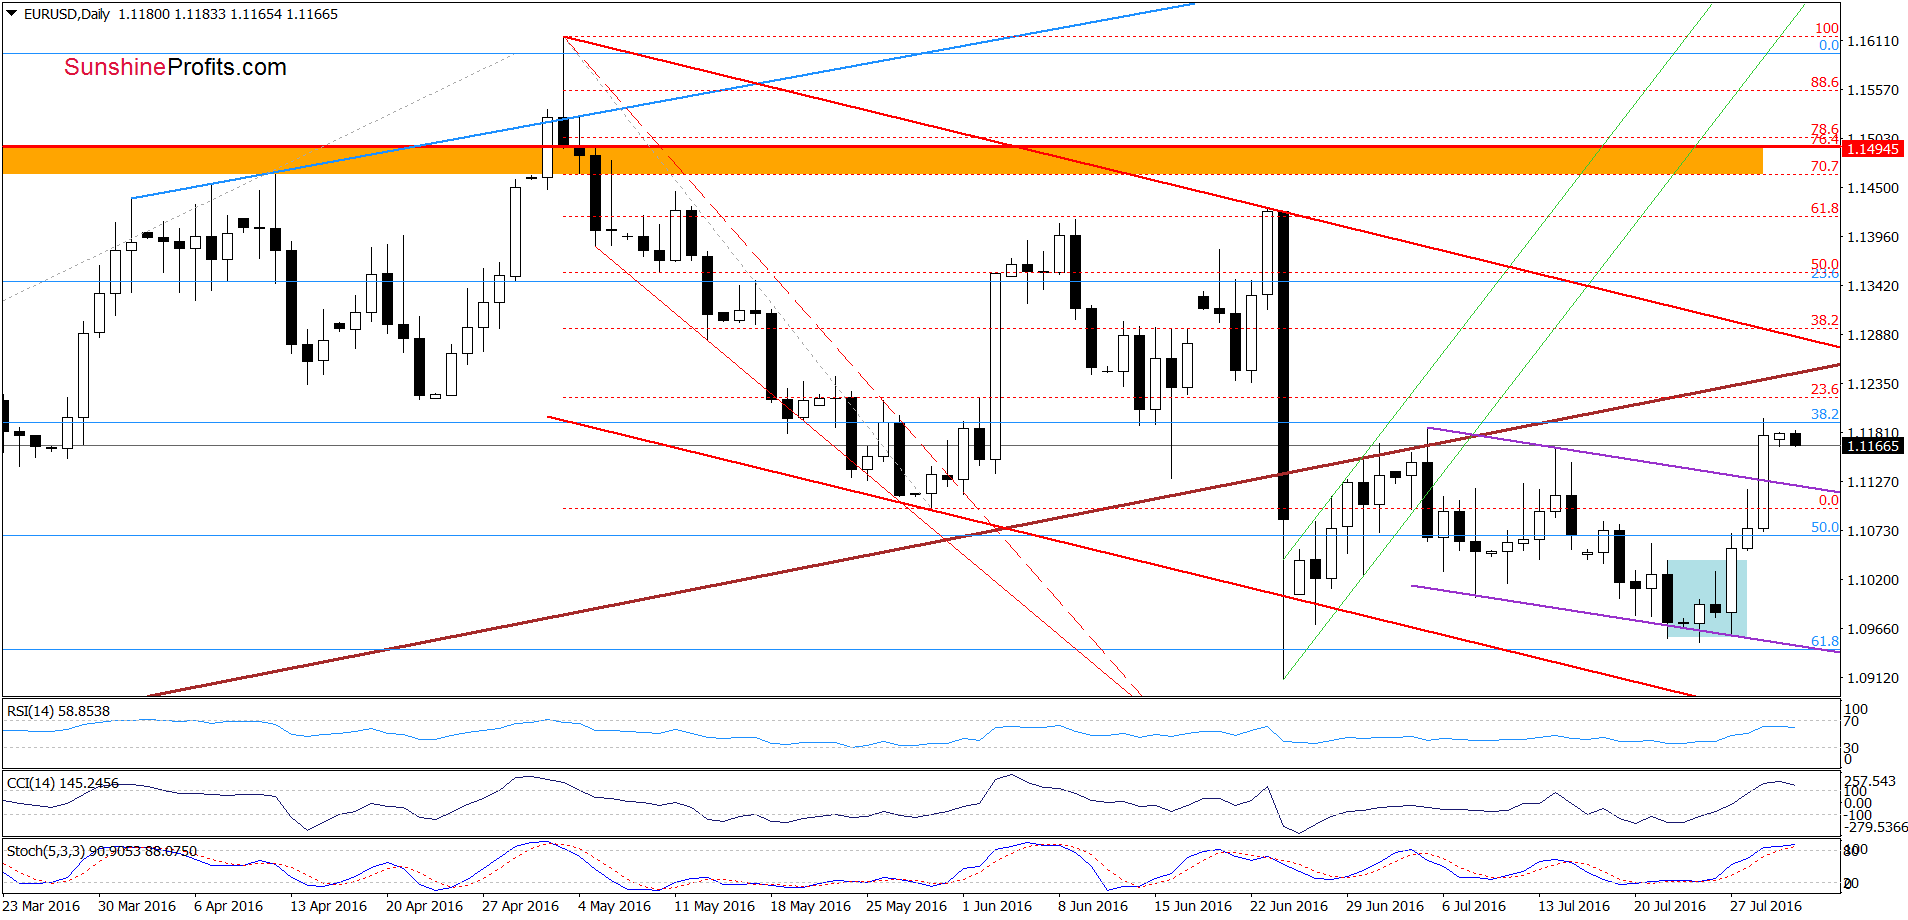
(…) EUR/USD increased earlier today, approaching the upper border of the purple declining trend channel (this means that closing short position yesterday was a good investment decision, which defended us from losses). (…) buy signals generated by the weekly and daily indicators suggest that higher values of the exchange rate are just around the corner and breakout above this resistance is just a matter of time. Therefore, if we see such price action, EUR/USD may increase to the previously-broken medium-term brown line (seen more clearly on the weekly chart) in the following days.
On the above charts, we see that currency bulls pushed the exchange rate higher as we had expected. With this move the pair climbed above the previous highs, but then gave up some gains and closed the day under the Jul 5 high, invalidating earlier tiny breakout. Although this is a negative signal, there are no sell signals on the daily chart (while buy signals generated by the weekly indicators remain in place), which suggests that we may see another attempt to move higher and a test of our Friday’s target - the previously-broken medium-term brown line.
Very short-term outlook: mixed with bullish bias
Short-term outlook: mixed
MT outlook: mixed
LT outlook: mixed
Trading position (short-term; our opinion): No positions are justified from the risk/reward perspective. We will keep you informed should anything change, or should we see a confirmation/invalidation of the above.
GBP/USD
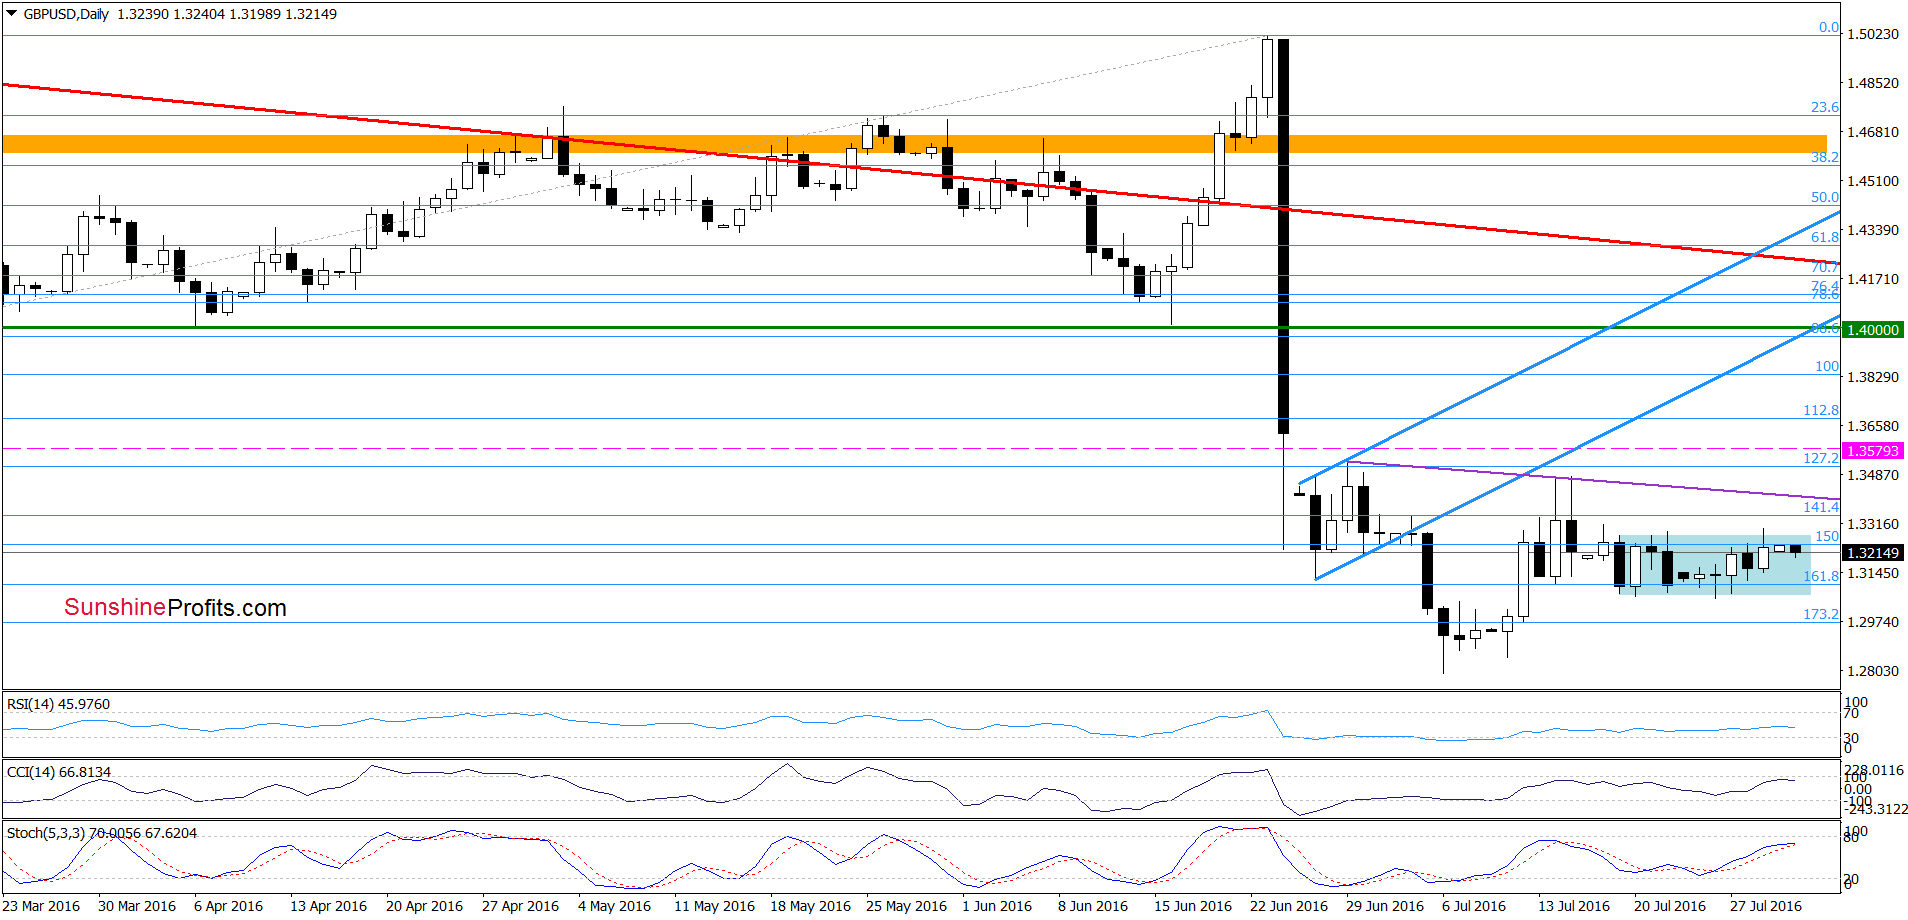
From the short-term perspective, we see that the situation remains almost unchanged as GBP/USD is trading in a blue consolidation around the 161.8% Fibonacci extension.
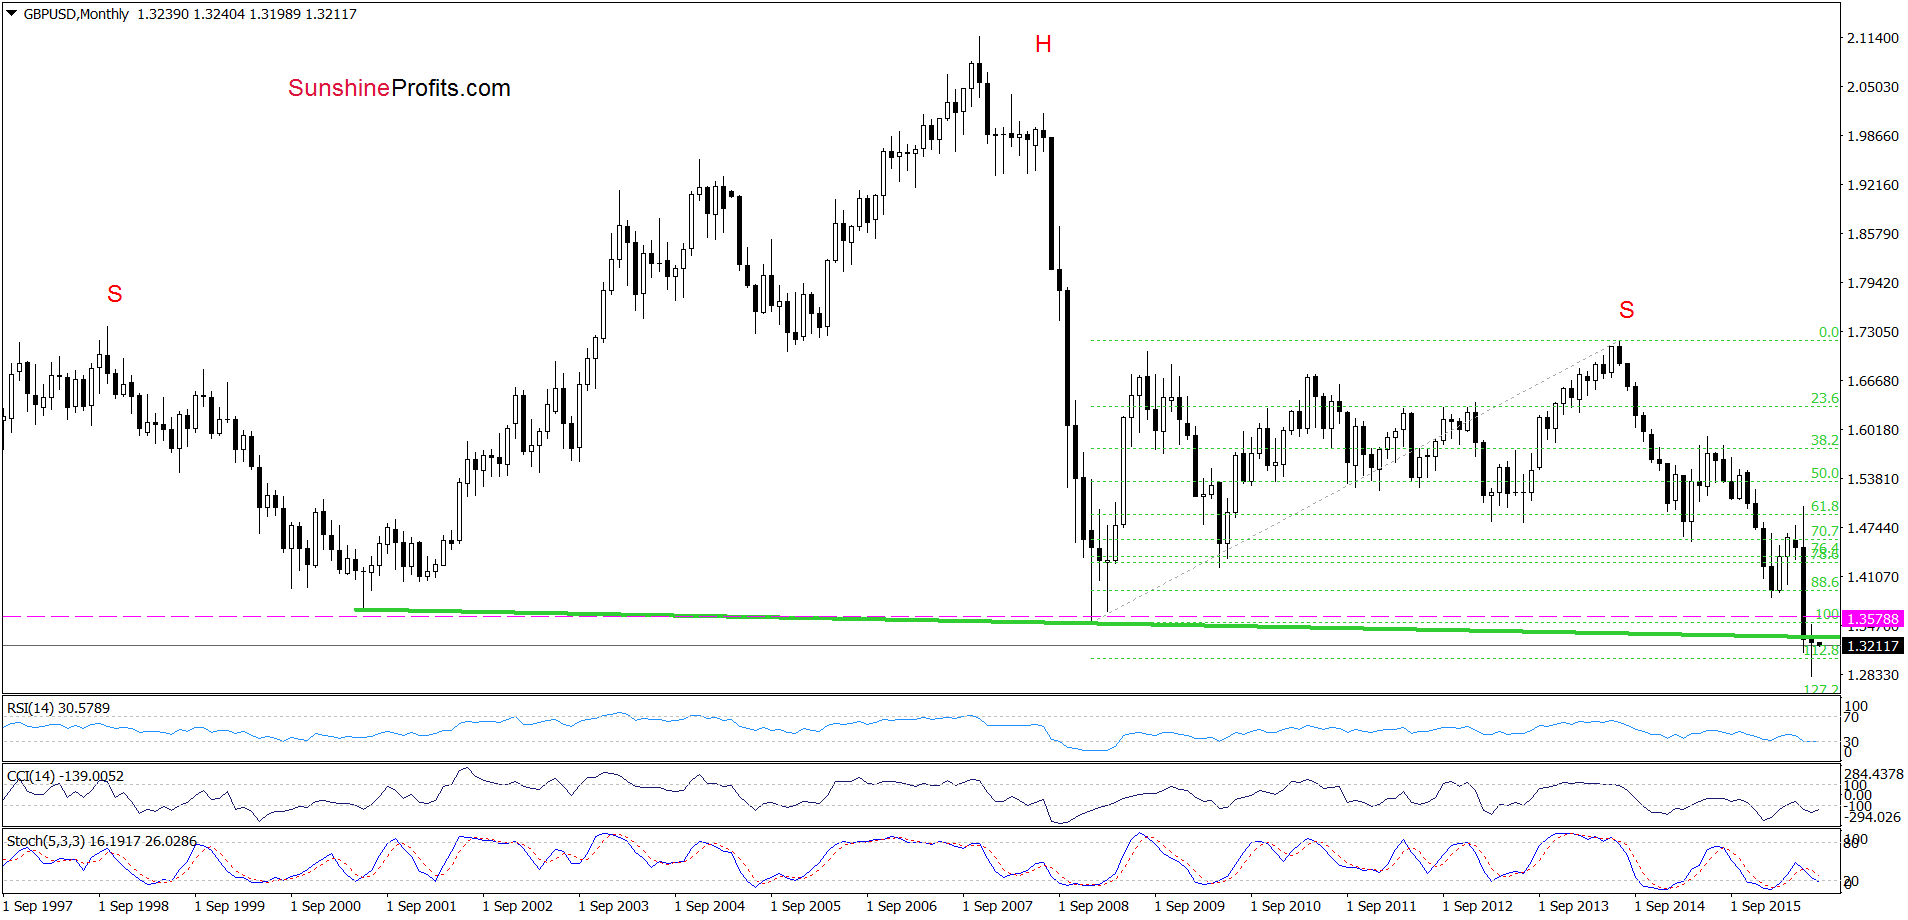
Can we infer more from the medium-term chart? Let’s check.
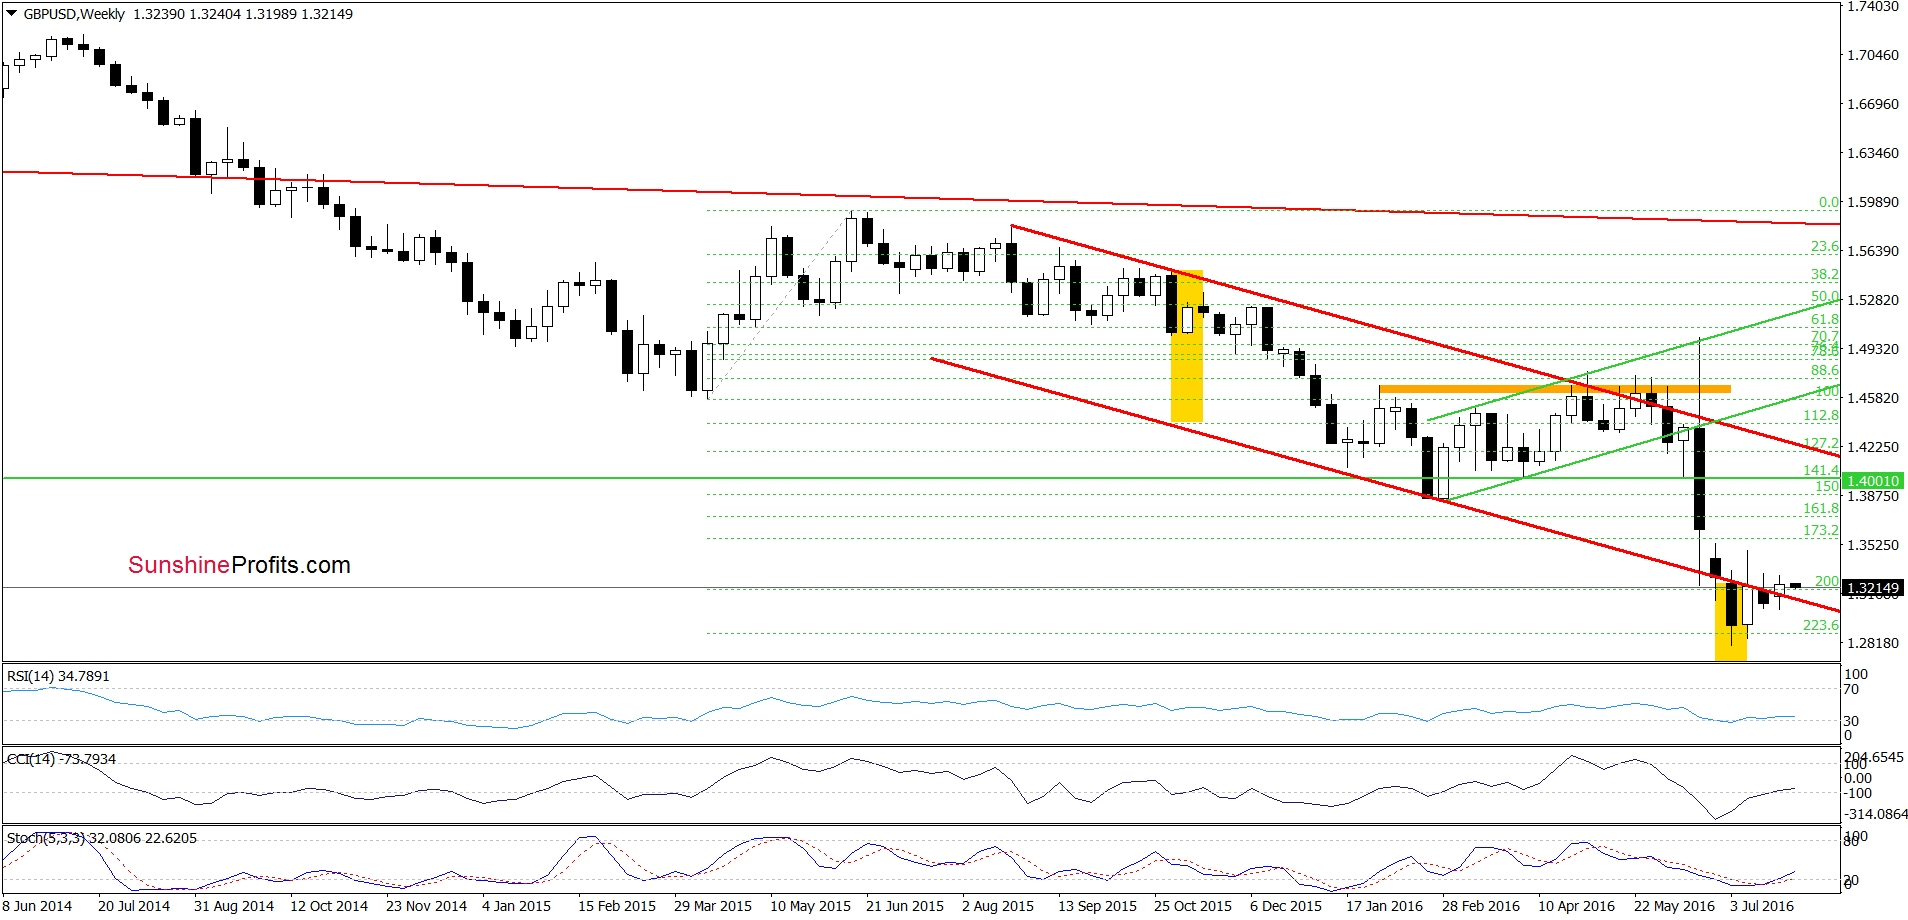
From today’s point of view, we see that GBP/USD closed the previous week above the lower border of the red declining trend channel, invalidating earlier breakdown. Although this is a positive signal that suggests further improvement, we should keep in mind that the exchange rate closed another month under the neck line of the head and shoulders formation, which means that another move to the downside may be just around the corner – especially if daily indicators generate sell signals in the coming days.
Very short-term outlook: bearish
Short-term outlook: mixed with bearish bias
MT outlook: mixed
LT outlook: bearish
Trading position (short-term; our opinion): Short positions with a stop-loss at 1.3579 and the initial downside target at 1.2519 are justified from the risk/reward perspective at the moment. We will keep you informed should anything change, or should we see a confirmation/invalidation of the above.
USD/JPY
Quoting our Friday’s alert:
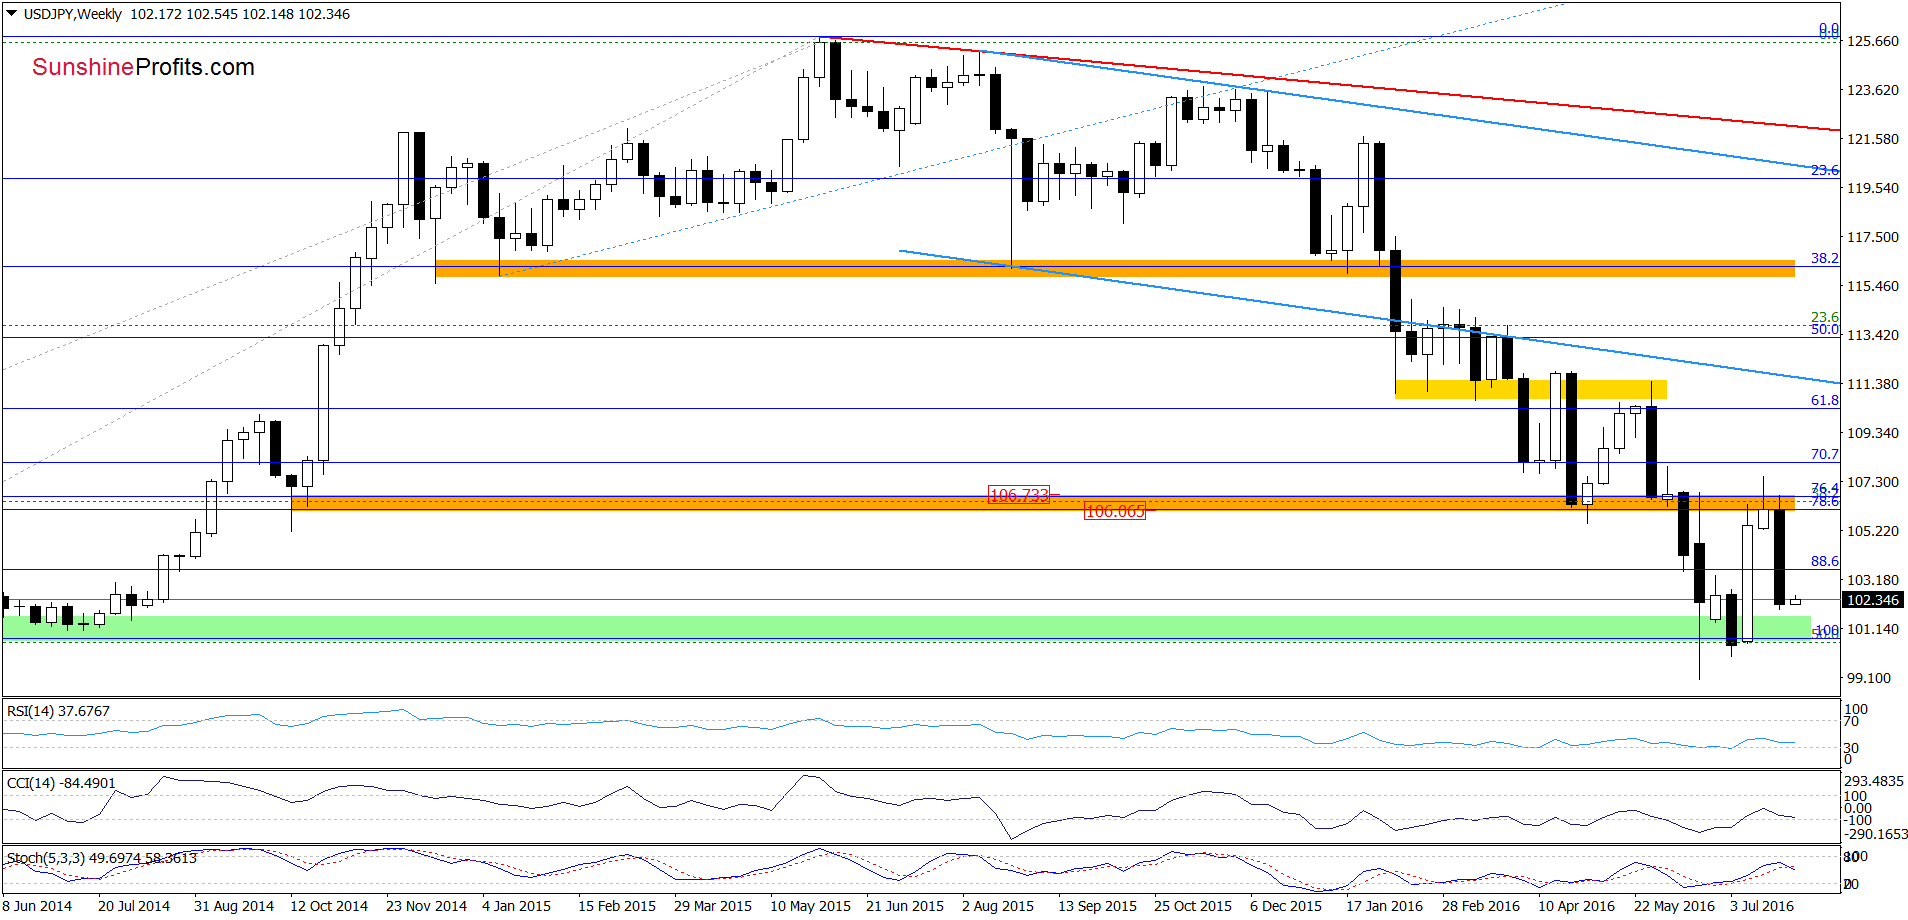
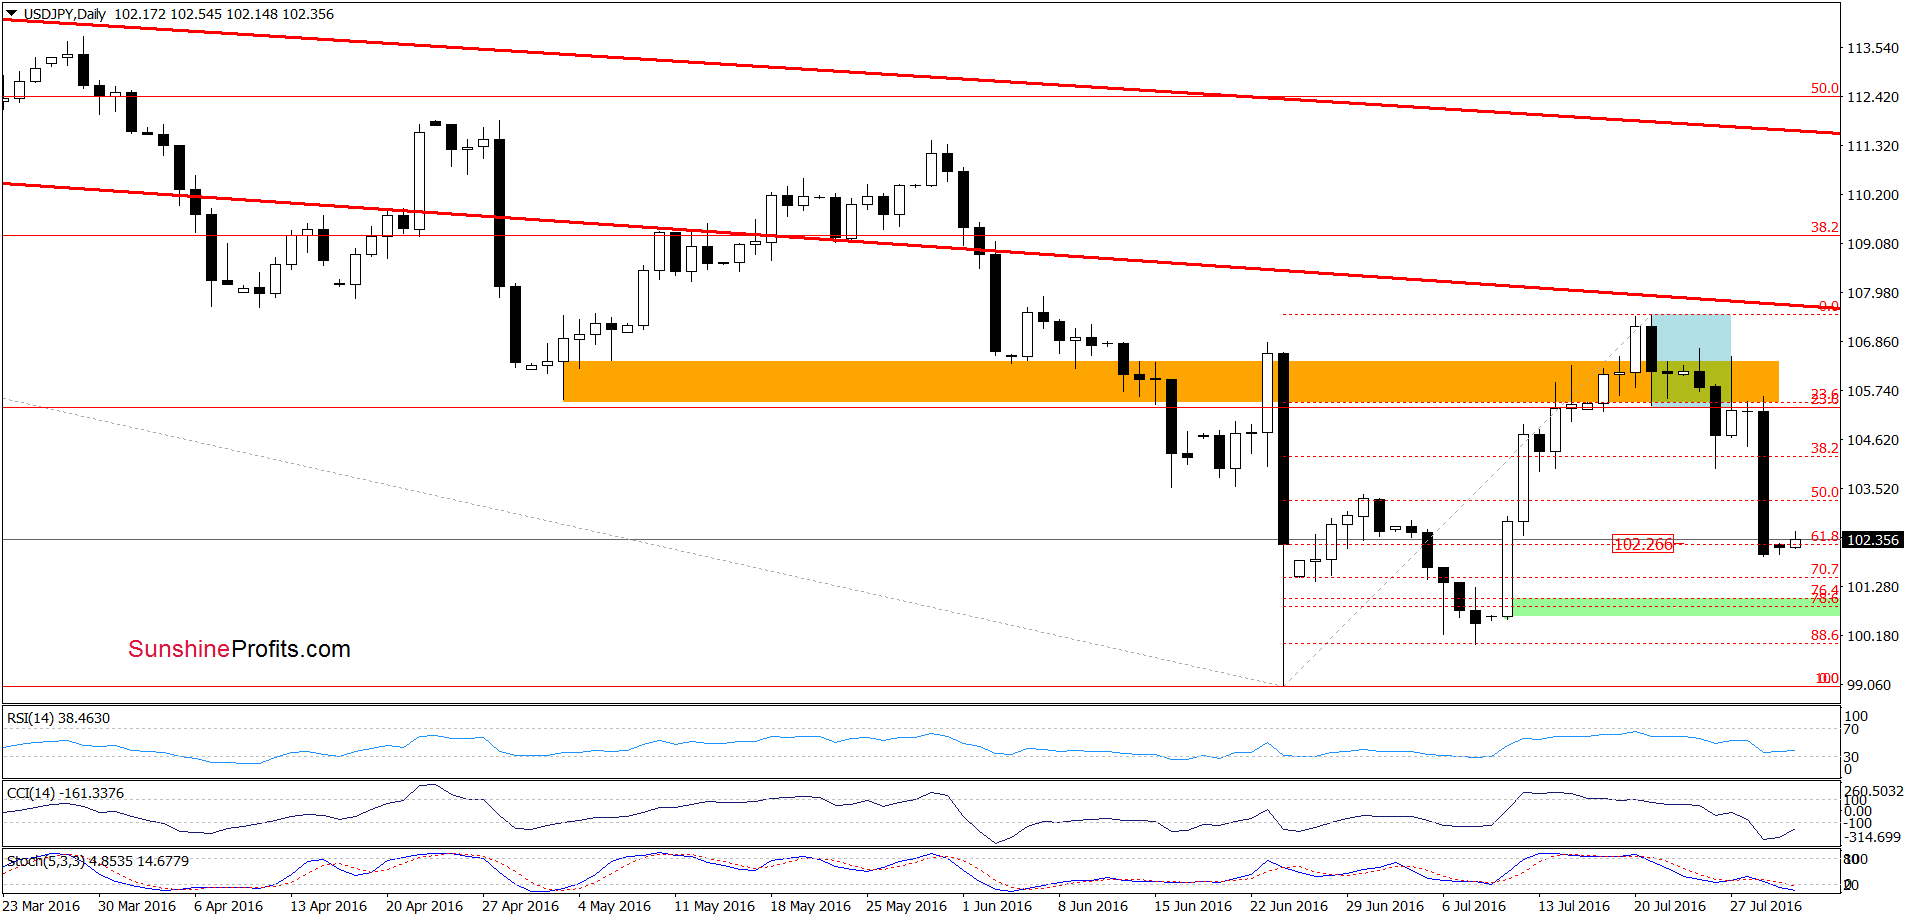
(…) a sharp decline (…) took the exchange rate not only to the recent low, but also to the 50% Fibonacci retracement. Although USD/JPY rebounded slightly from that support, the size of today’s decline and sell signal generated by the Stochastic Oscillator suggest that another attempt to move lower is just around the corner. If this is the case and the pair declines from here, the next downside target will be the 61.8% retracement (around 102.26)
Looking at the charts, we see that the situation developed in line with the above scenario and USD/JPY reached our downside target. What’s next? The current position of the daily indicators (which are oversold) suggests that reversal and higher values of the exchange rate are just around the corner. Nevertheless, as long as there won’t be buy signals another downswing is likely – especially when we factor in a sell signal generated by the weekly Stochastic Oscillator. If this is the case, and we’ll see such price action, the next downside target would be the green support area created by the 76.8% and 78.6% Fibonacci retracement levels (around 100.84-101.02).
Very short-term outlook: mixed with bearish bias
Short-term outlook: mixed
MT outlook: mixed
LT outlook: mixed
Trading position (short-term; our opinion): No positions are justified from the risk/reward perspective at the moment. We will keep you informed should anything change, or should we see a confirmation/invalidation of the above.
USD/CAD
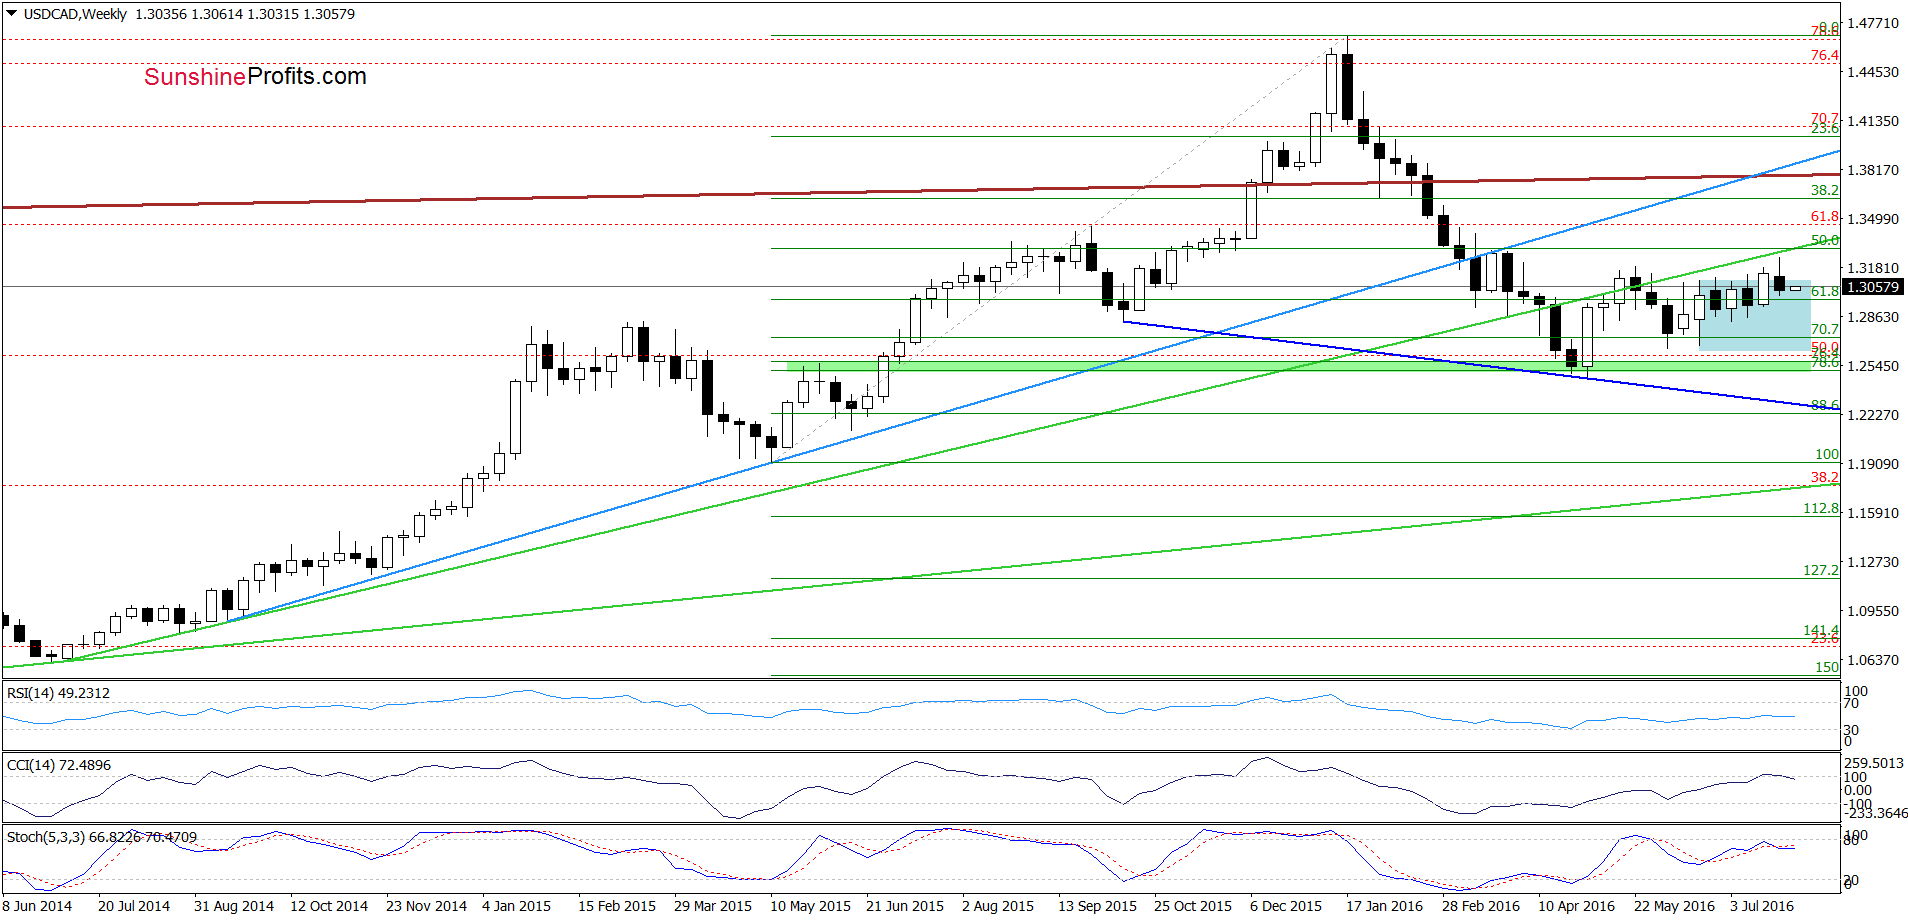
On the weekly chart, we see that the green resistance line stopped further improvement, which resulted in a reversal and decline. As a result, the exchange rate came back to the blue consolidation, invalidating earlier breakout above the upper line of the formation. Additionally, the CCI and Stochastic Oscillator generated sell signals, suggesting further deterioration in the coming week.
Are there any technical factors that could hinder the realization of the above scenario? Let’s examine the daily chart and find out.
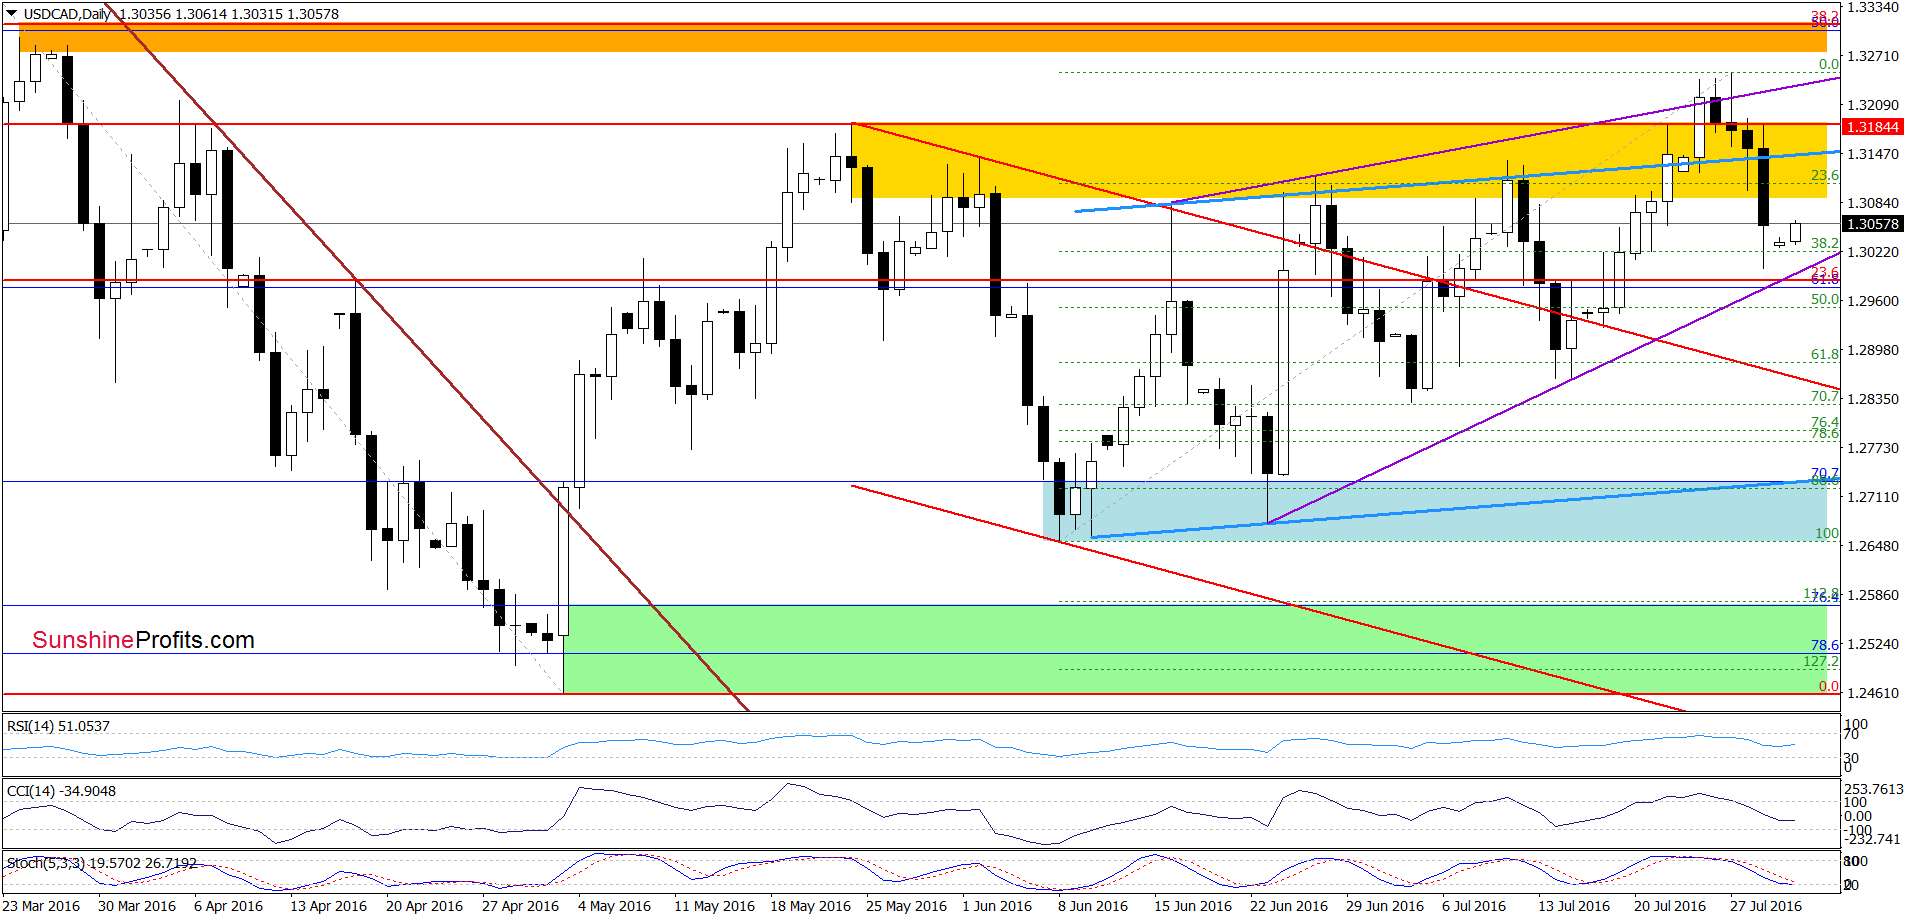
From this perspective, we see that the breakdown under the upper border of the blue rising trend channel in combination with sell signals generated by the indictors triggered a sharp decline on Friday. Thanks to this drop, USD/CAD slipped to the 38.2% Fibonacci retracement (based on the Jun-Jul upward move), approaching the purple rising line. As you see, the combination of these supports encouraged currency bulls to act, which resulted in a rebound on Friday. Earlier today, we saw another attempt to move higher, which suggests that we may see further improvement and a climb to the previously-broken upper line of the blue rising trend channel in the coming days.
Very short-term outlook: mixed with bullish bias
Short-term outlook: mixed
MT outlook: mixed
LT outlook: mixed
Trading position (short-term; our opinion): No positions are justified from the risk/reward perspective. We will keep you informed should anything change, or should we see a confirmation/invalidation of the above.
USD/CHF
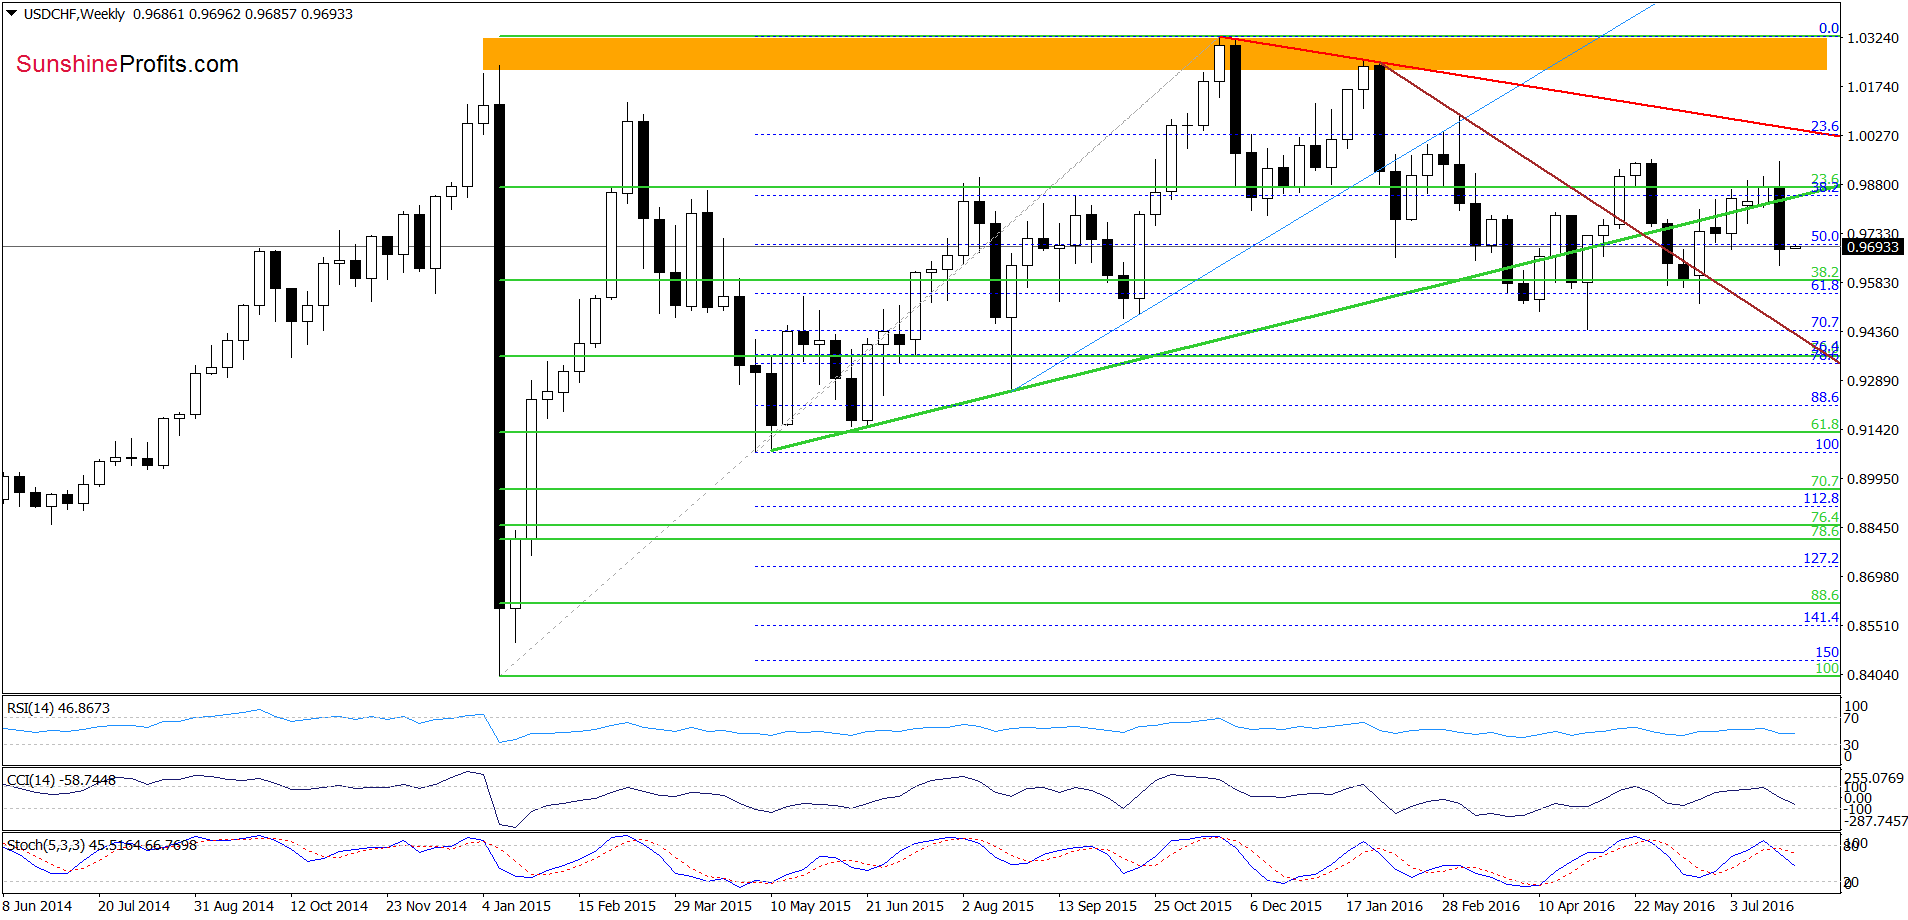
The first thing that catches the eye on the weekly chart is breakdown under the rising green line. This bearish signal triggered a sharp decline, which took USD/CHF under the Jul low. Additionally, the CCI and Stochastic Oscillator generated sell signal, which suggests further deterioration in the coming week. But are there any factors that could encourage currency bulls to act? Let’s examine the daily chart and find out.
On Thursday, we wrote the following:
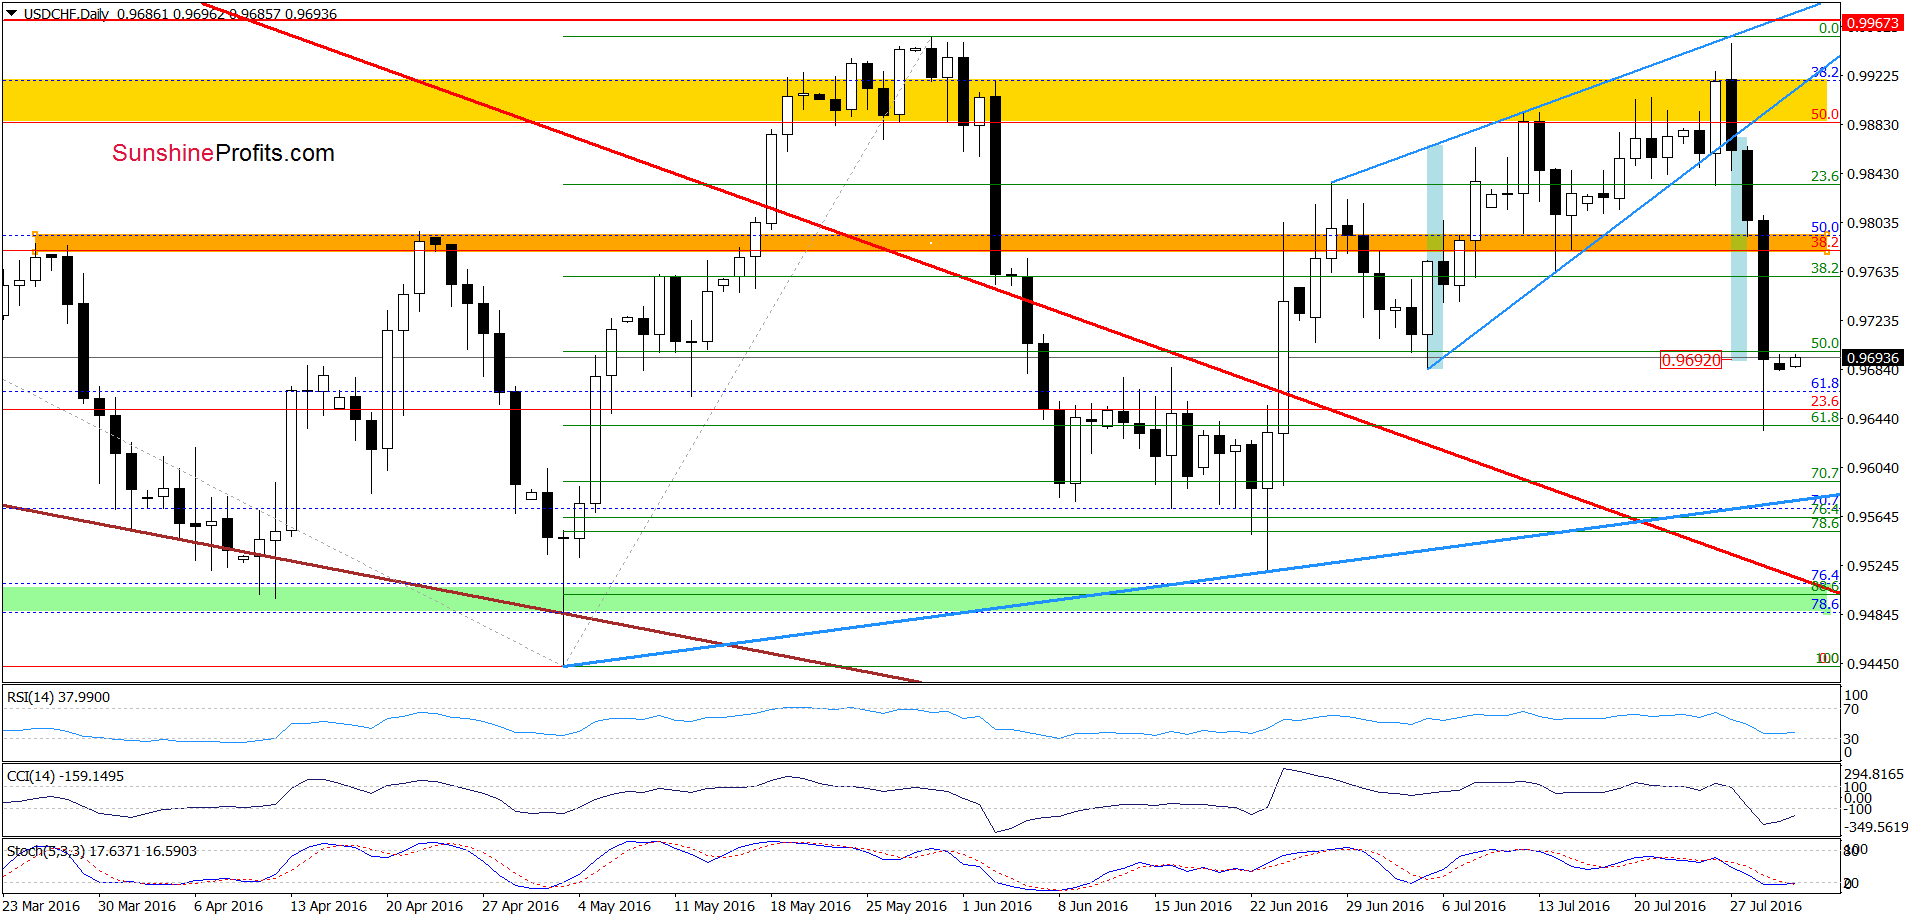
(…) the pair slipped under the lower border of the blue rising wedge and closed the day below it, which encouraged currency bears to act earlier today. As a result, the pair extended losses, which in combination with sell signals generated by the indicators suggests a test of the orange zone, which serves now as the nearest support. Nevertheless, taking into account the fact that USD/CHF dropped under the lower border of the blue rising wedge, we think that the pair could decline even to around 0.9692, where the size of the move will correspond to the height of the formation (in this area is also the support area created by the early Jul lows).
Looking at the daily chart, we see that the situation developed in tune with our Thursday’s assumptions and USD/CHF not only dropped to our target, but also slipped below it, reaching the 61.8% Fibonacci retracement. As you see this support triggered a rebound on Friday, but as long as there won’t be buy signals generated by the indicators, another attempt to move lower is likely – especially when we factor in the medium-term picture. If this is the case and the pair moves lower once again, the next downside target would be around 0.9580, where the blue rising support line (based on the May and Jun lows) currently is.
Very short-term outlook: bearish
Short-term outlook: mixed with bearish bias
MT outlook: bearish
LT outlook: mixed
Trading position (short-term; our opinion): Short positions (with a stop loss order at 0.9967 and next downside target at 0.9590) are justified from the risk/reward perspective at the moment. We will keep you informed should anything change, or should we see a confirmation/invalidation of the above.
AUD/USD
On the weekly chart, we see that AUD/USD invalidated earlier breakdown under the orange zone, which resulted in a sharp rebound that erased most of earlier losses.
How did this move affect the very short-term picture? Let’s check.
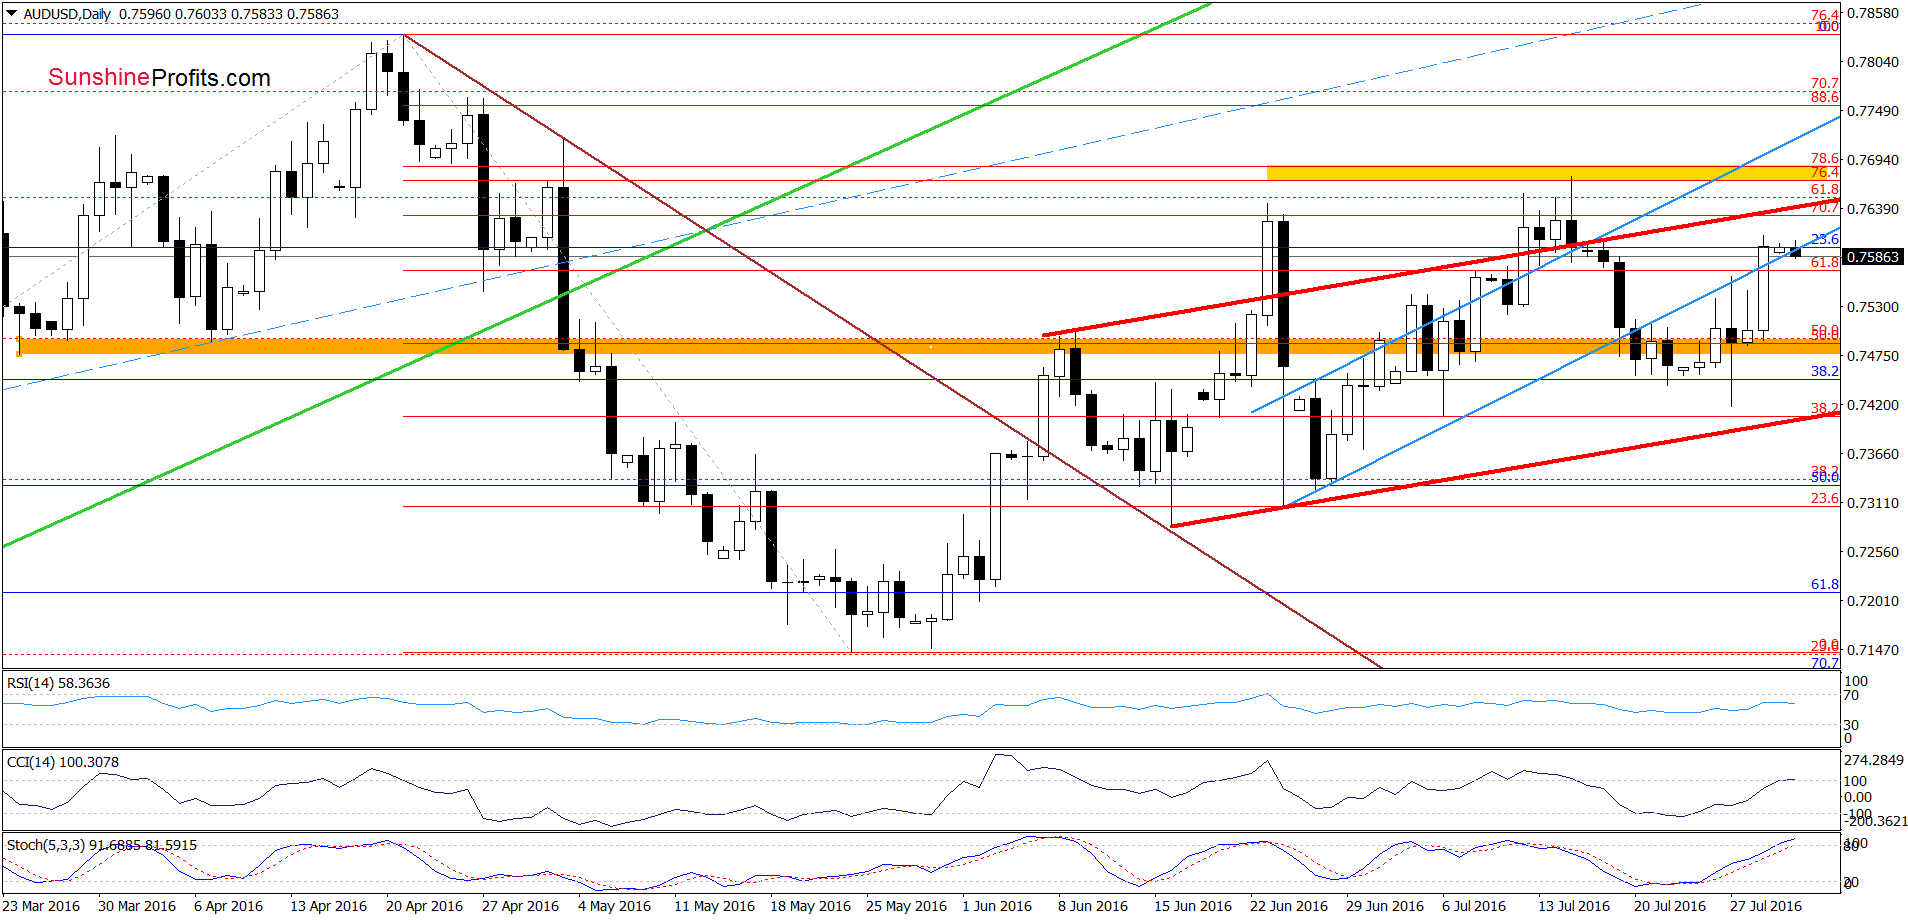
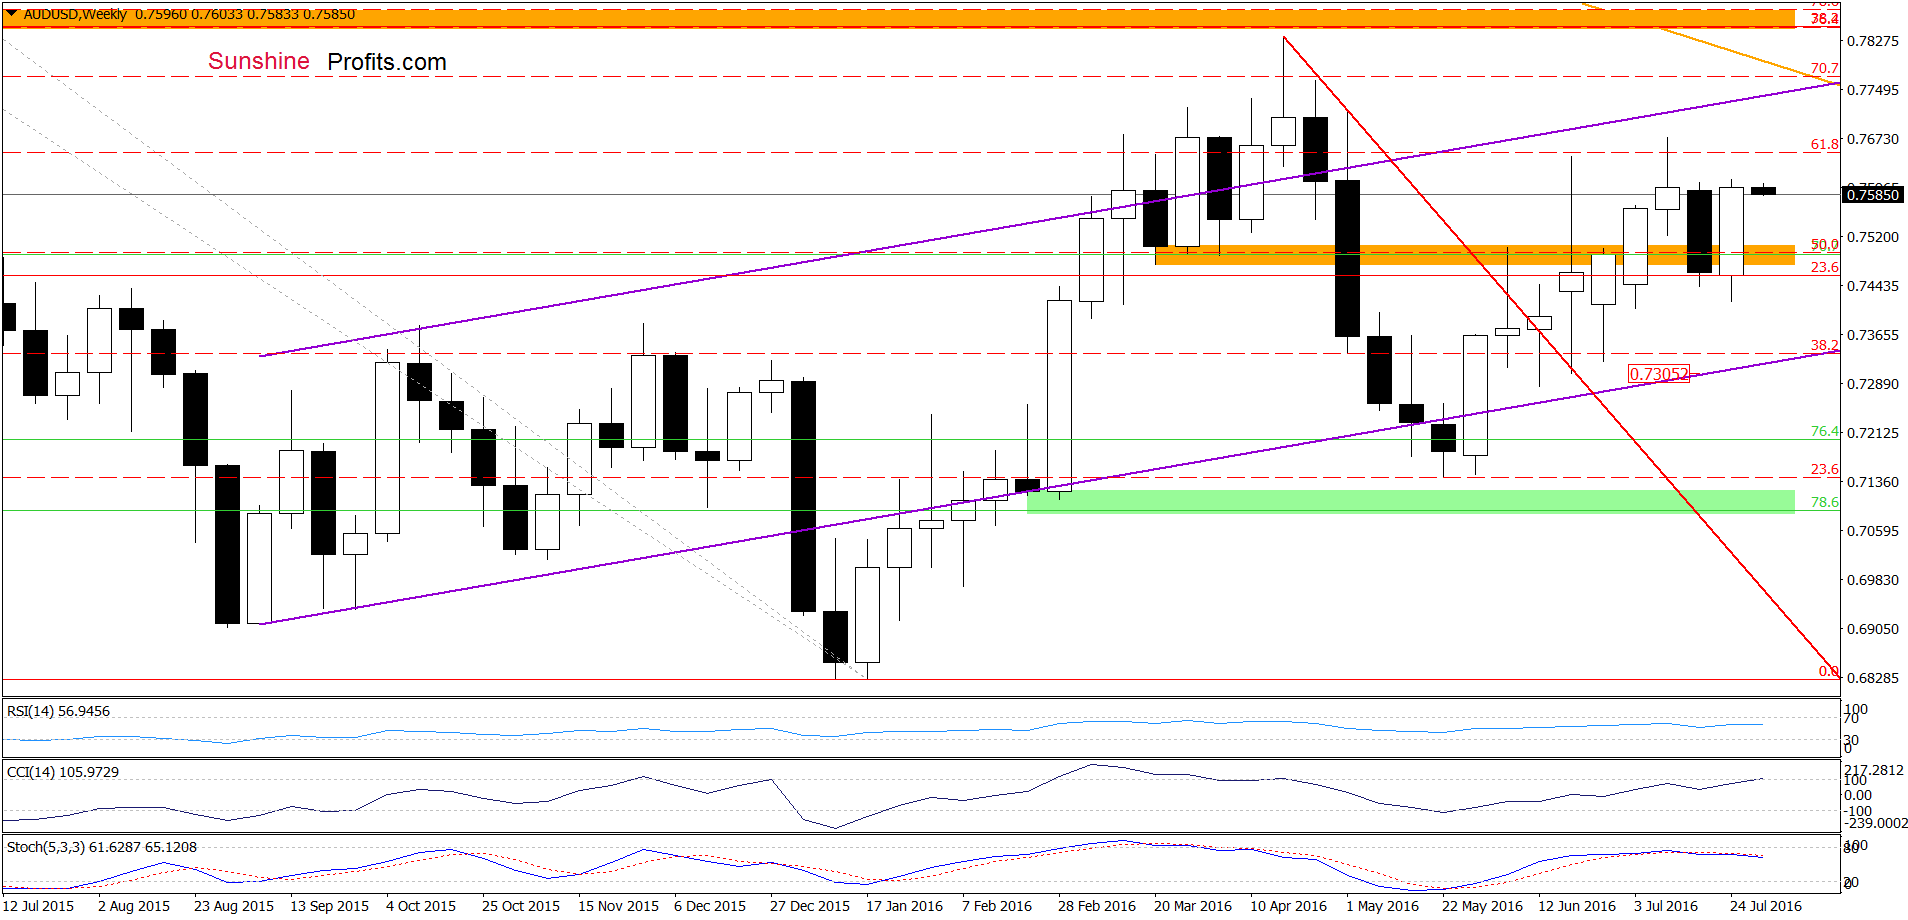
Looking at the daily chart, we see that invalidation of the breakdown under the orange zone triggered a sharp rally, which invalidated earlier drop under the lower border of the blue rising trend channel. Although this is a positive signal that suggests further improvement, we should keep in mind that the upper order of the red rising trend channel is quite close – just like the 70.7% Fibonacci retracement and the resistance zone created by the previous highs. Additionally, the current position of daily and weekly indicators suggests that reversal and lower values of the exchange rate are just around the corner. If this is the case, and AUD/USD moves lower in the coming days, the initial downside target would be the orange zone, which serves as the nearest support at the moment.
Very short-term outlook: mixed with bearish bias
Short-term outlook: mixed
MT outlook: mixed
LT outlook: mixed
Trading position (short-term; our opinion): No positions are justified from the risk/reward perspective. We will keep you informed should anything change, or should we see a confirmation/invalidation of the above.
Thank you.
Nadia Simmons
Forex & Oil Trading Strategist
Przemyslaw Radomski, CFA
Founder, Editor-in-chief
Gold & Silver Trading Alerts
Forex Trading Alerts
Oil Investment Updates
Oil Trading Alerts

