

Earlier today, the USD Index extended losses, which approached it to the Jun lows. How did this drop affect our six currency pairs?
In our opinion the following forex trading positions are justified - summary:
EUR/USD
On Friday, we wrote the following:
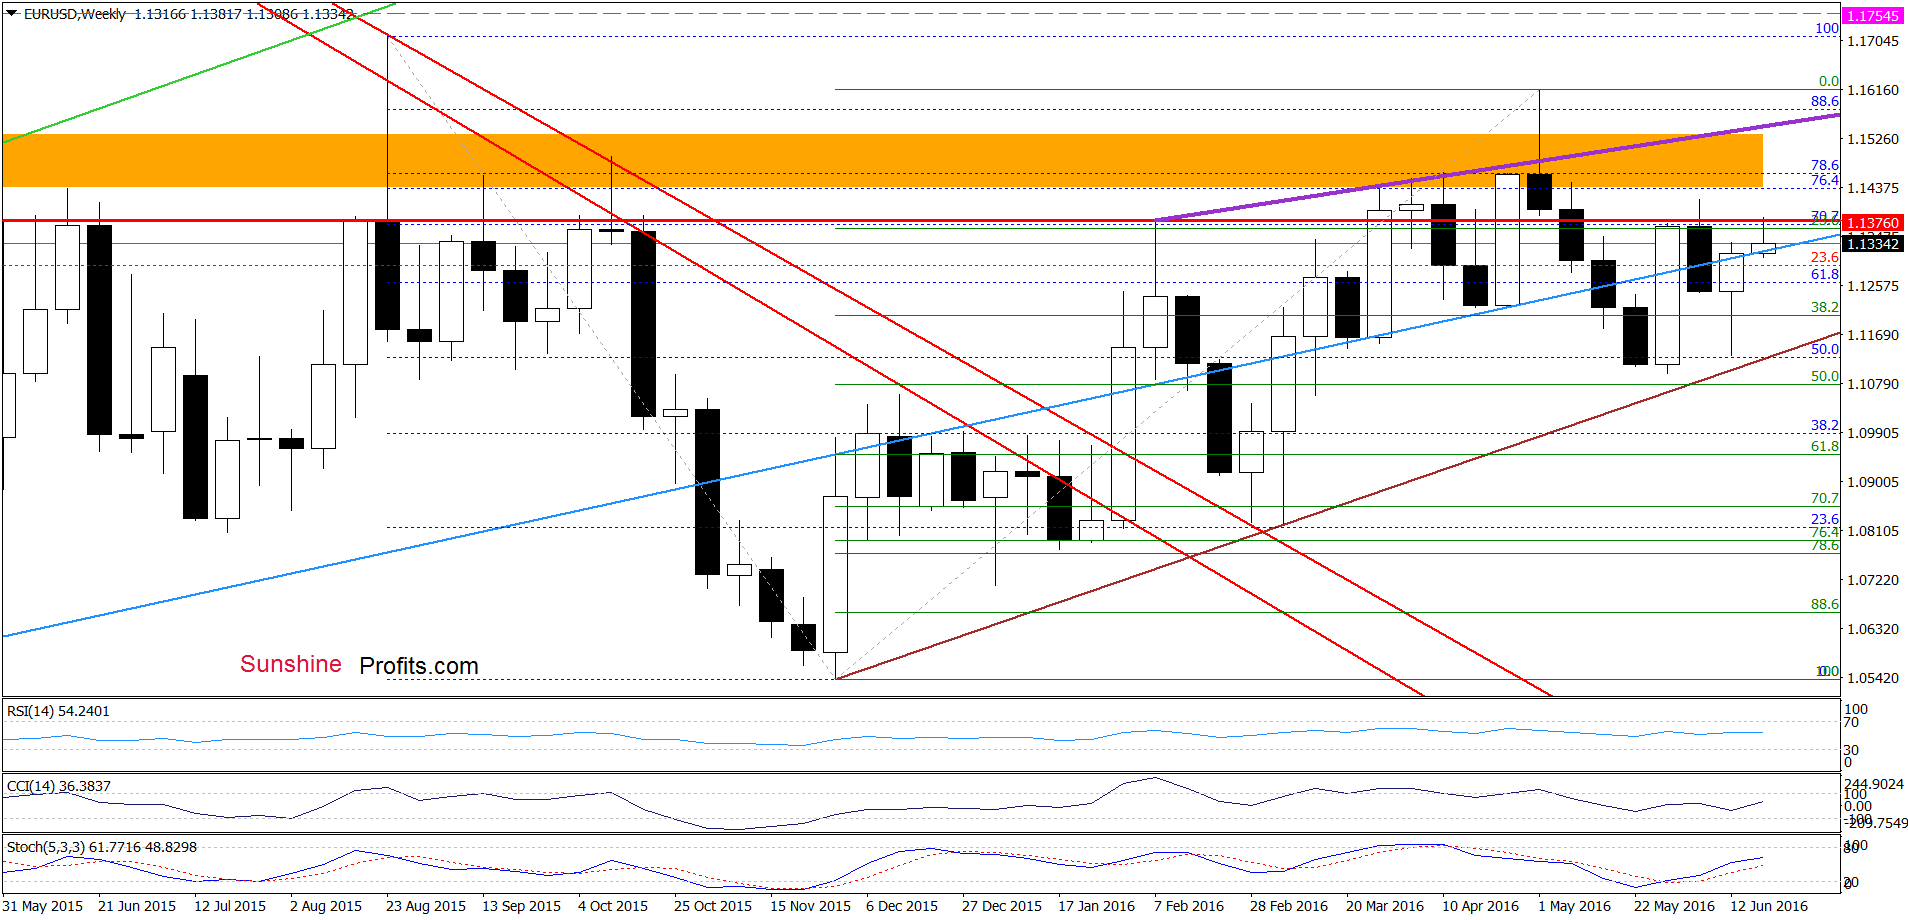
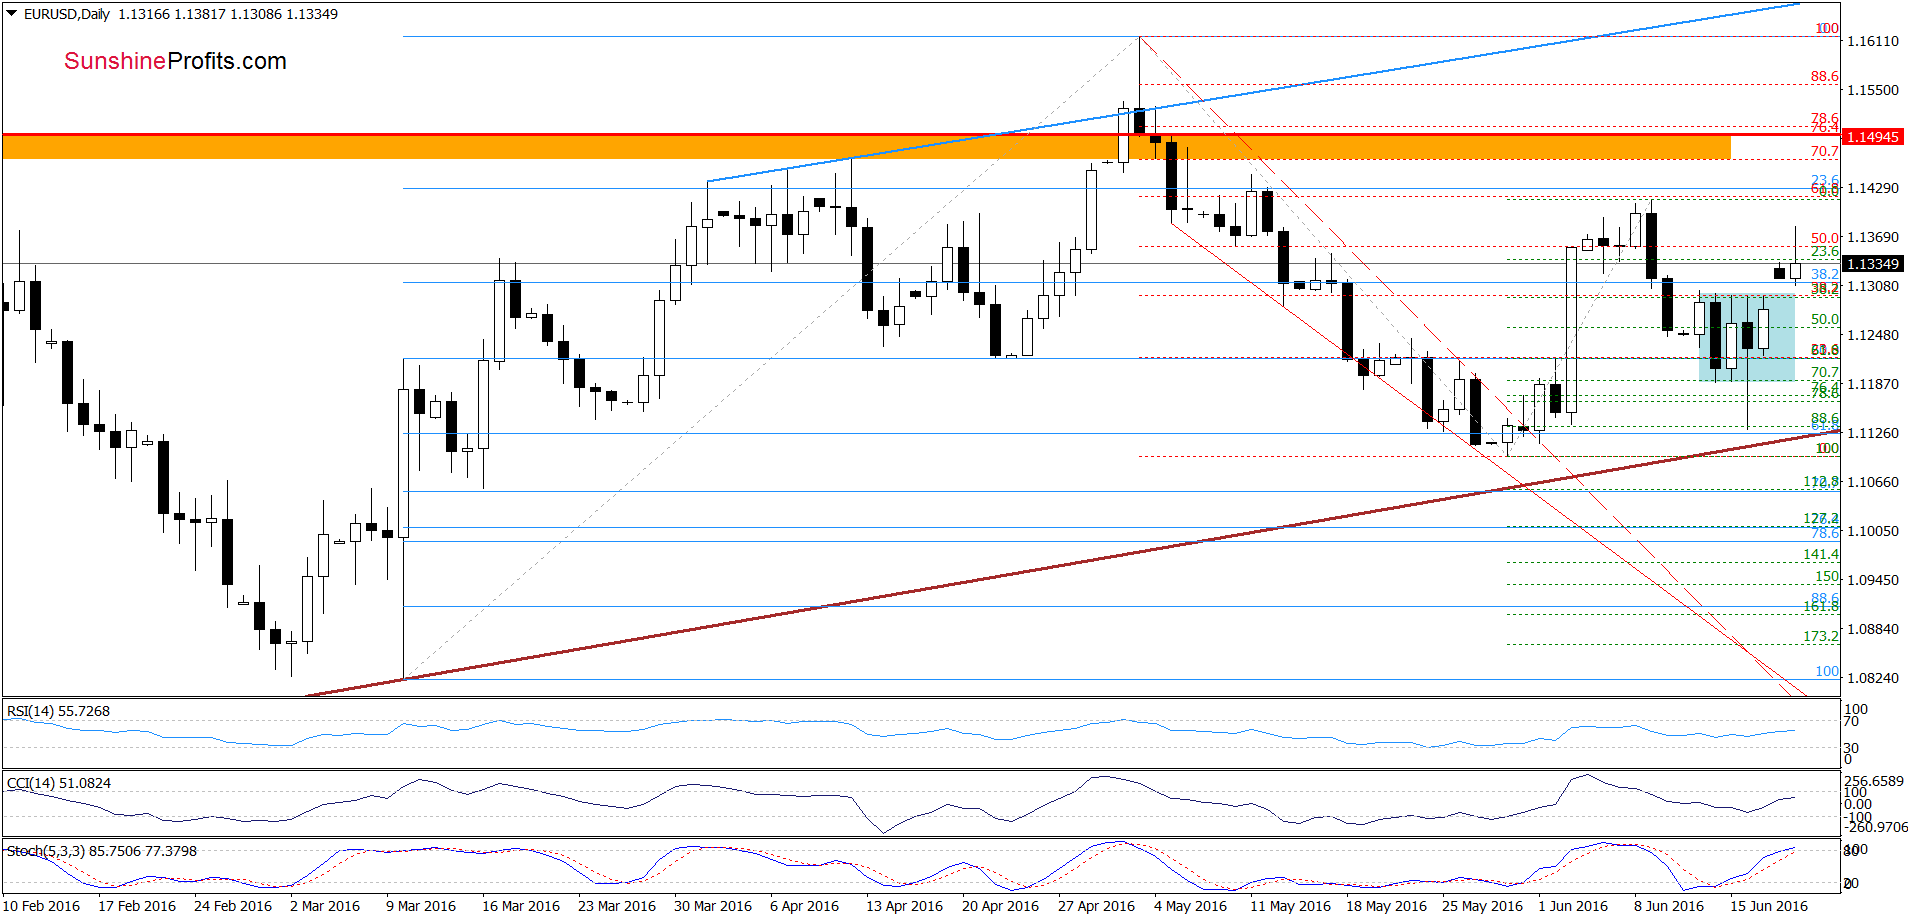
(…) the pair came back to the blue consolidation. Taking this fact into account and combining it with a strong buy signal generated by the Stochastic Oscillator, we think that further improvement is just around the corner. Nevertheless, such price action would be more likely if we see a breakout above the upper border of the consolidation (1.1302).
From today’s point of view, we see that currency bulls pushed the pair higher as we had expected. With this move, EUR/USD broke above the upper border of the blue consolidation, which suggests that our upside target from the previous alert would be in play in the coming day(s):
(…) EUR/USD will likely test the Jun high and the 61.8% Fibonacci retracement in the following days.
Very short-term outlook: mixed with bullish bias
Short-term outlook: mixed
MT outlook: mixed
LT outlook: mixed
Trading position (short-term; our opinion): No positions are justified from the risk/reward perspective. We will keep you informed should anything change, or should we see a confirmation/invalidation of the above.
GBP/USD
On Thursday, we wrote:
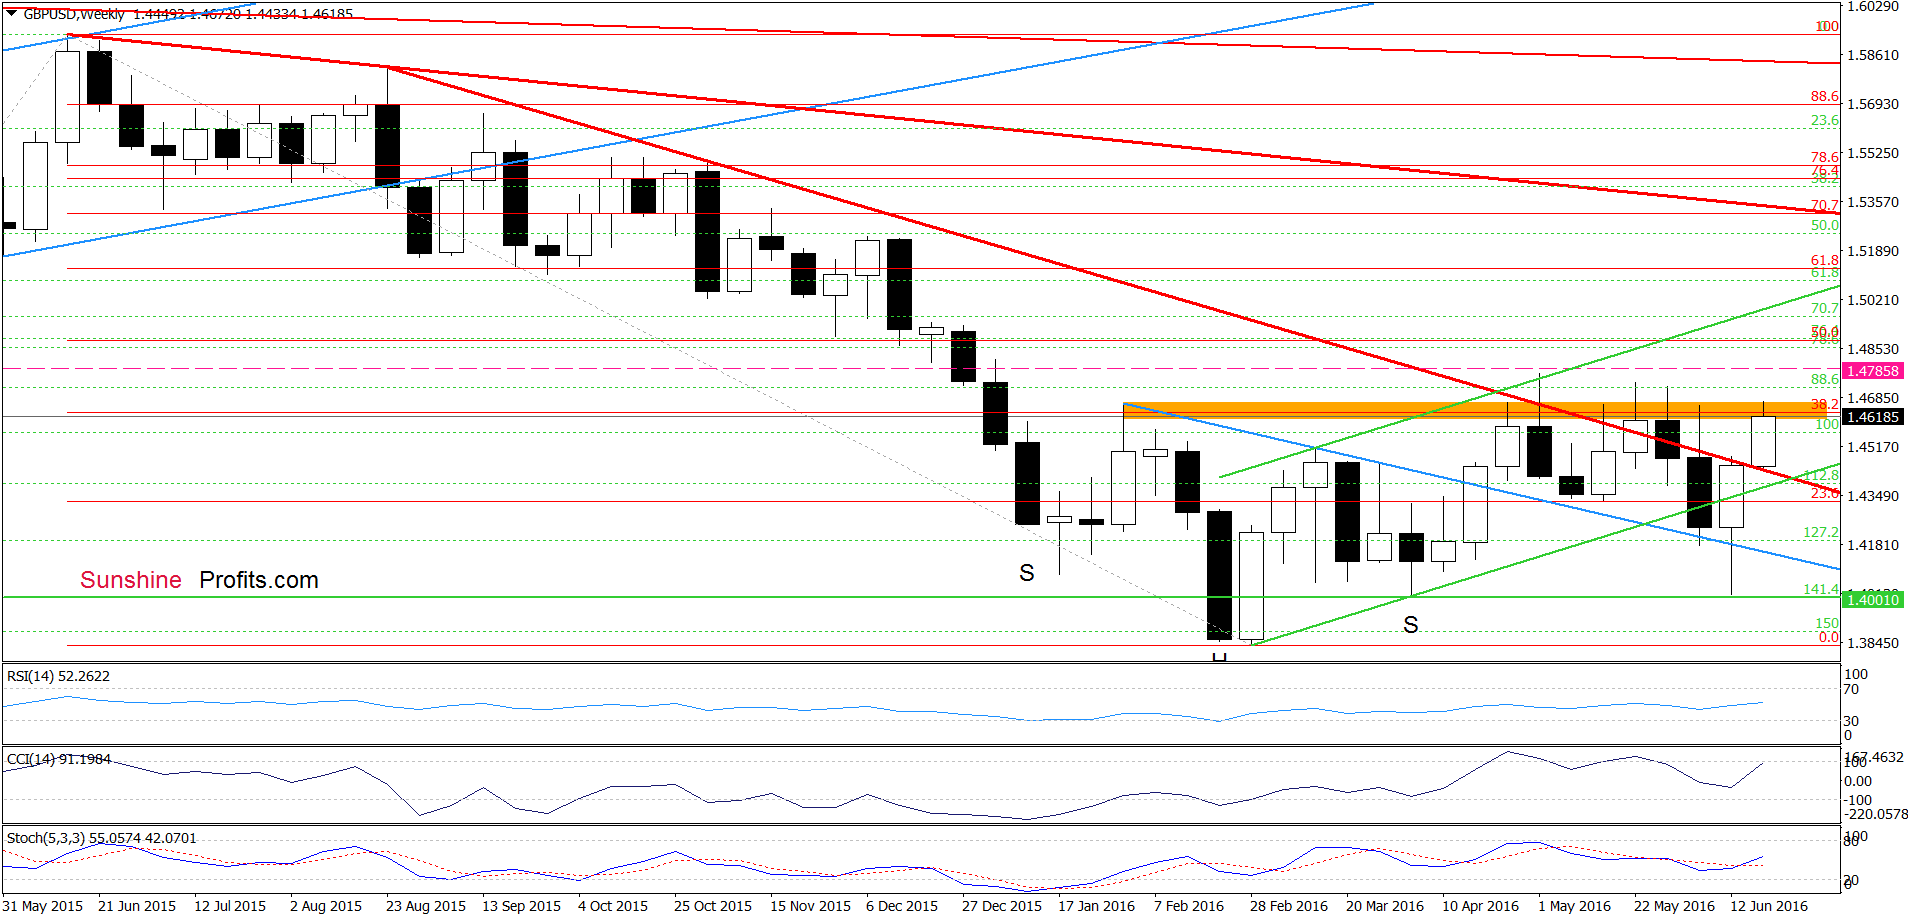
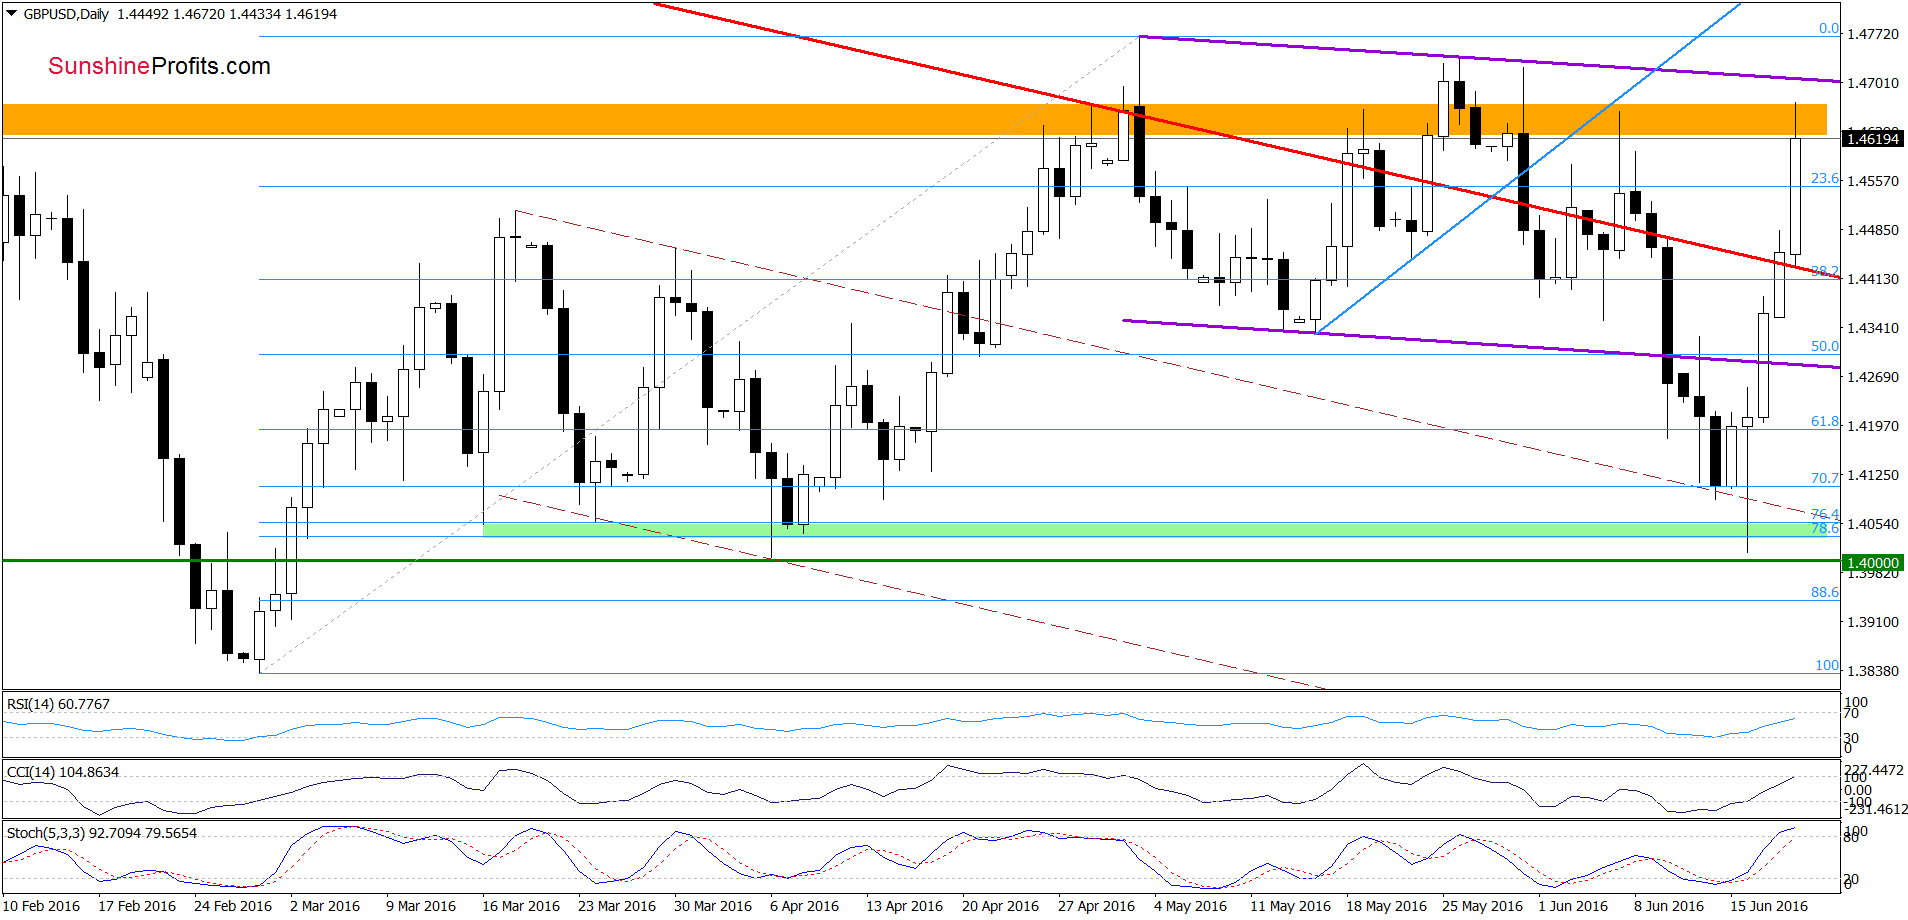
(…) sell signals are still in play, supporting another attempt to move lower (at this point, please note that they are very close to generating buy signals, which suggests that the space for further declines may be limited). Taking this fact into account and another drop under the blue support line seen on the weekly chart, we think that the exchange rate will drop to the green support zone (created by the 76.4% and 78.6% Fibonacci retracement levels) in the coming day(s).
Looking at the daily chart, we see that the situation developed in line with the above scenario and GBP/USD reached our downside target. As you see, the green support area encouraged currency bulls to act, which resulted in a sharp rebound in the following day. With this move, the pair came back above the long-term red declining resistance line (marked on the weekly chart), which triggered further improvement earlier today. Thanks to this increase GBP/USD climbed to the orange resistance zone once again, which suggests that we may see another reversal in the coming days – similarly to what we saw in previous weeks. Nevertheless, before we see such price action, another attempt to move higher and a re-test of recent highs can’t be ruled out as buy signals are still in play.
Very short-term outlook: mixed
Short-term outlook: mixed
MT outlook: mixed
LT outlook: mixed
Trading position (short-term; our opinion): No positions are justified from the risk/reward perspective at the moment. We will keep you informed should anything change, or should we see a confirmation/invalidation of the above.
USD/JPY
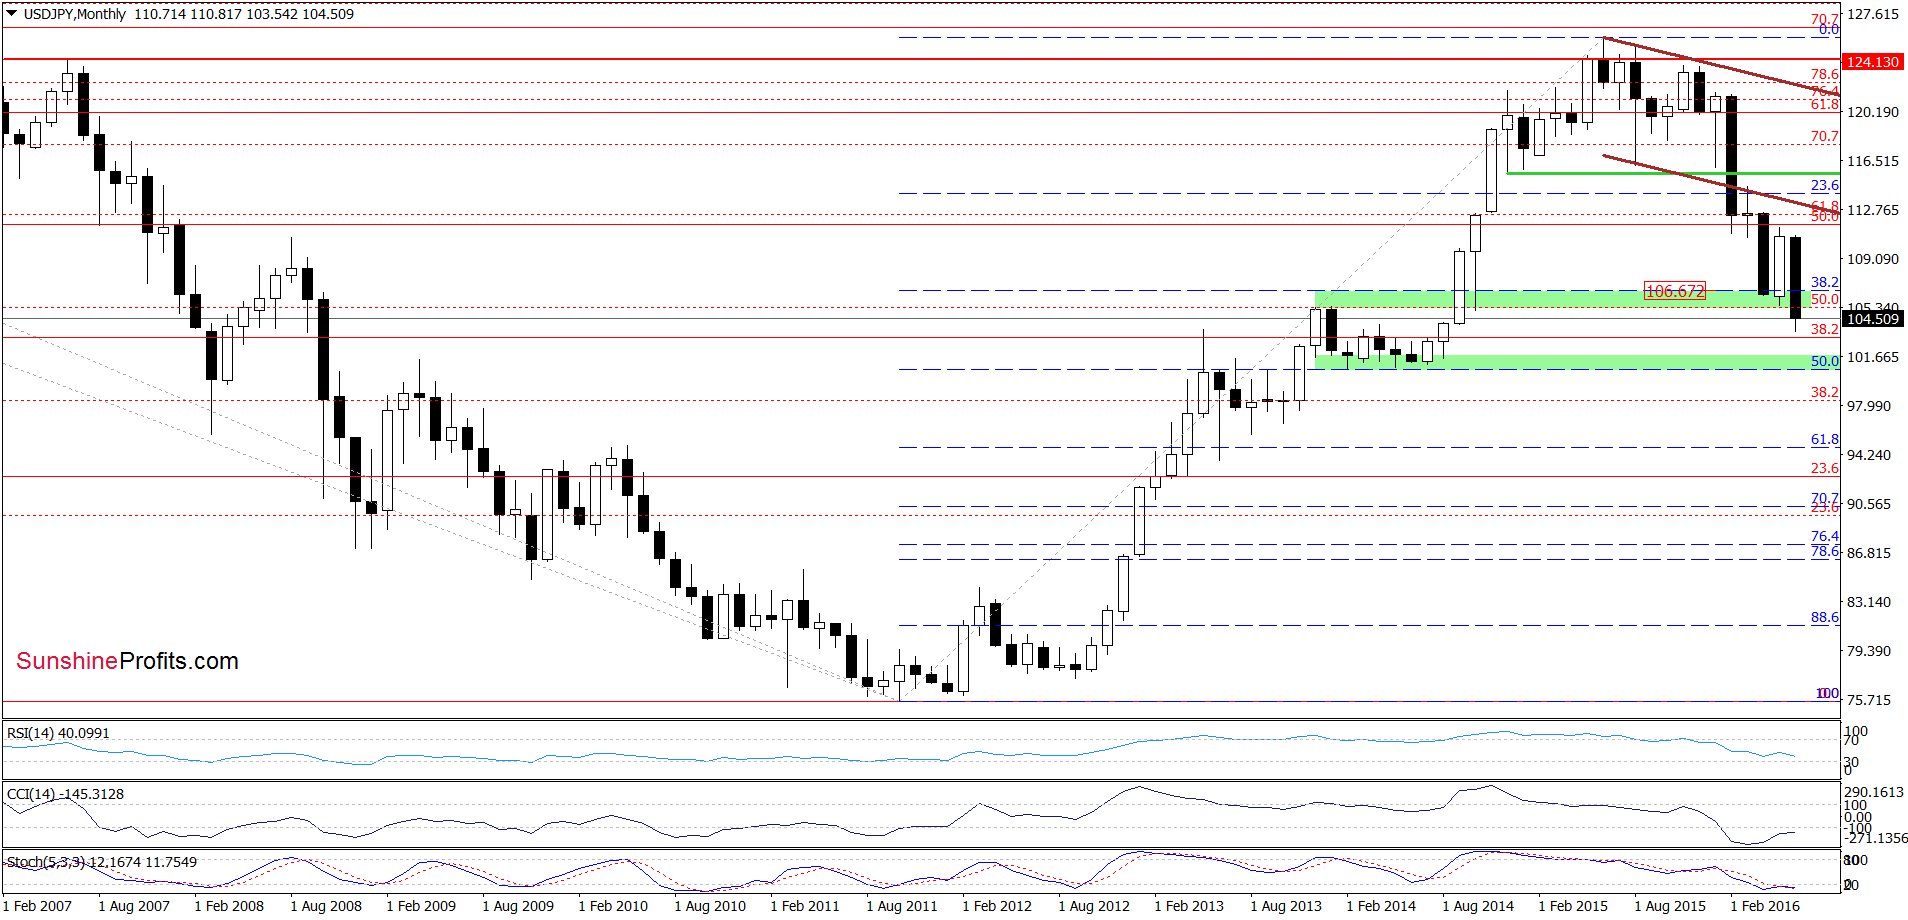
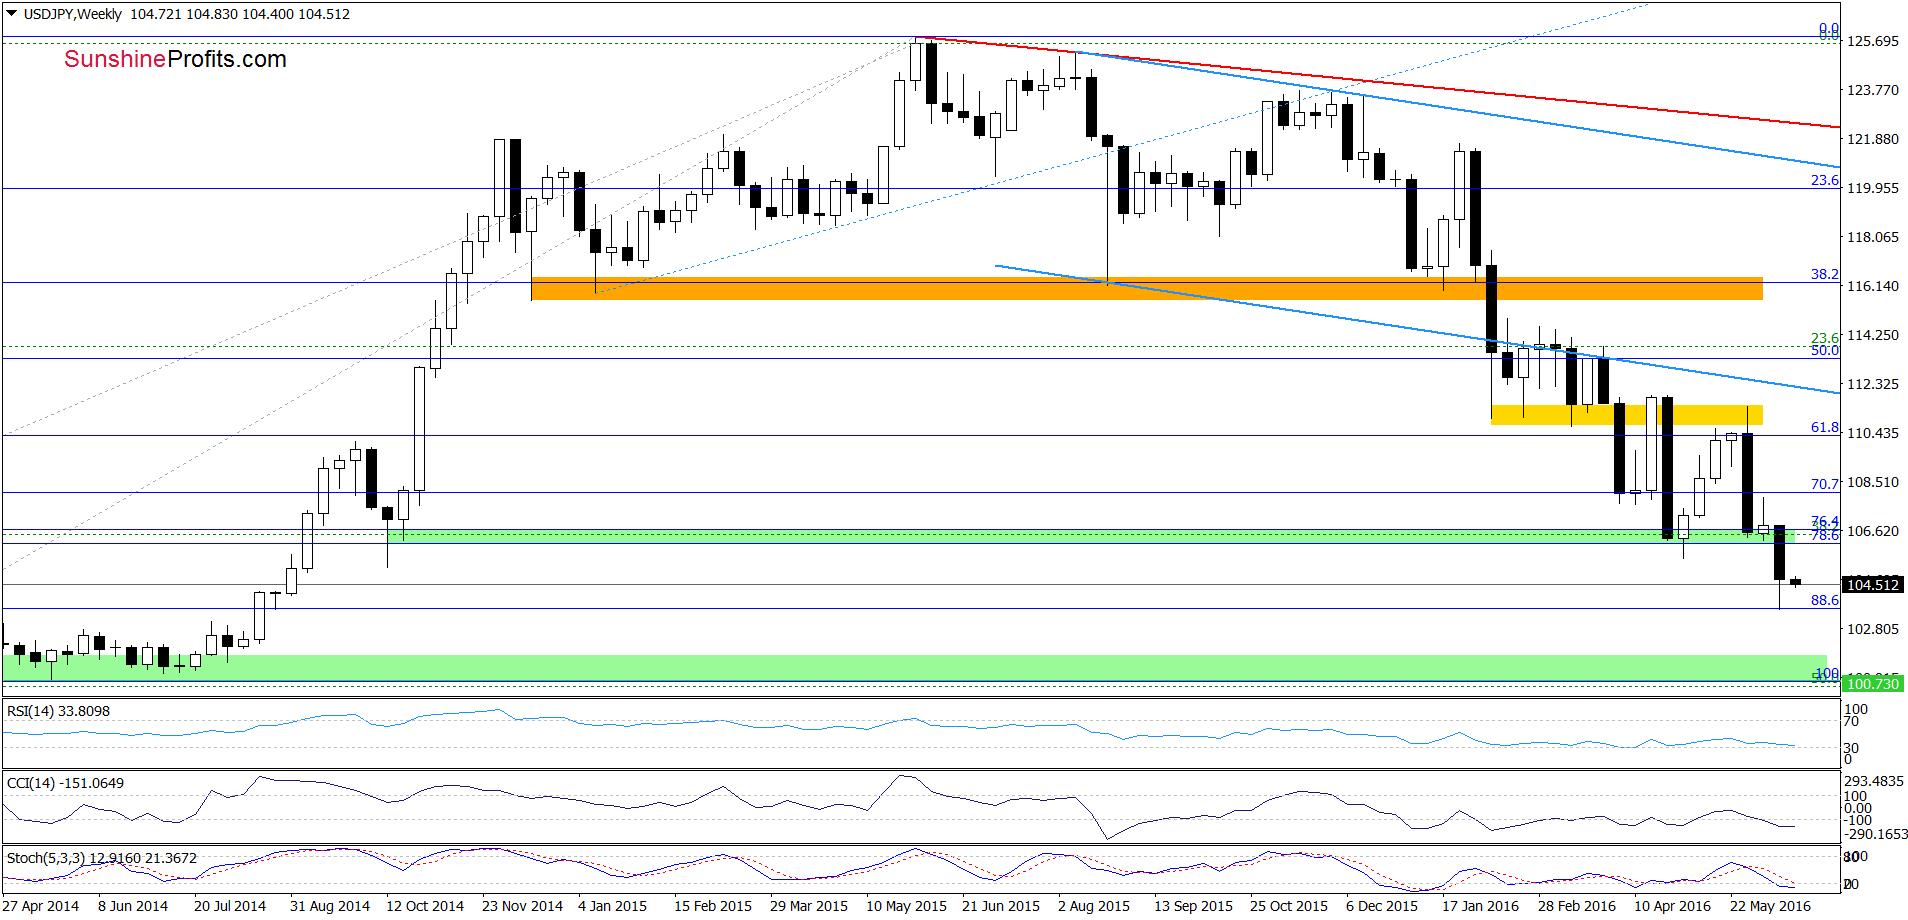
The first thing that catches the eye on the above charts is breakdown under the green support zone created by the 76.4% and 78.6% Fibonacci retracement levels (marked on the weekly chart) and the 38.2% retracement based on the entire 2011-2015 upward move (seen on the monthly chart). Although the 88.6% retracement triggered a rebound on Friday, the above-mentioned bearish signal continues to weigh on the exchange rate, suggesting a re-test of the recent low in the coming week. Nevertheless, if it is broken, we may see further deterioration – even to the next green support zone around 100.74-102 in the following days.
Very short-term outlook: mixed with bearish bias
Short-term outlook: mixed
MT outlook: mixed
LT outlook: mixed
Trading position (short-term; our opinion): No positions are justified from the risk/reward perspective at the moment. We will keep you informed should anything change, or should we see a confirmation/invalidation of the above.
USD/CAD
Quoting our Tuesday’s alert:
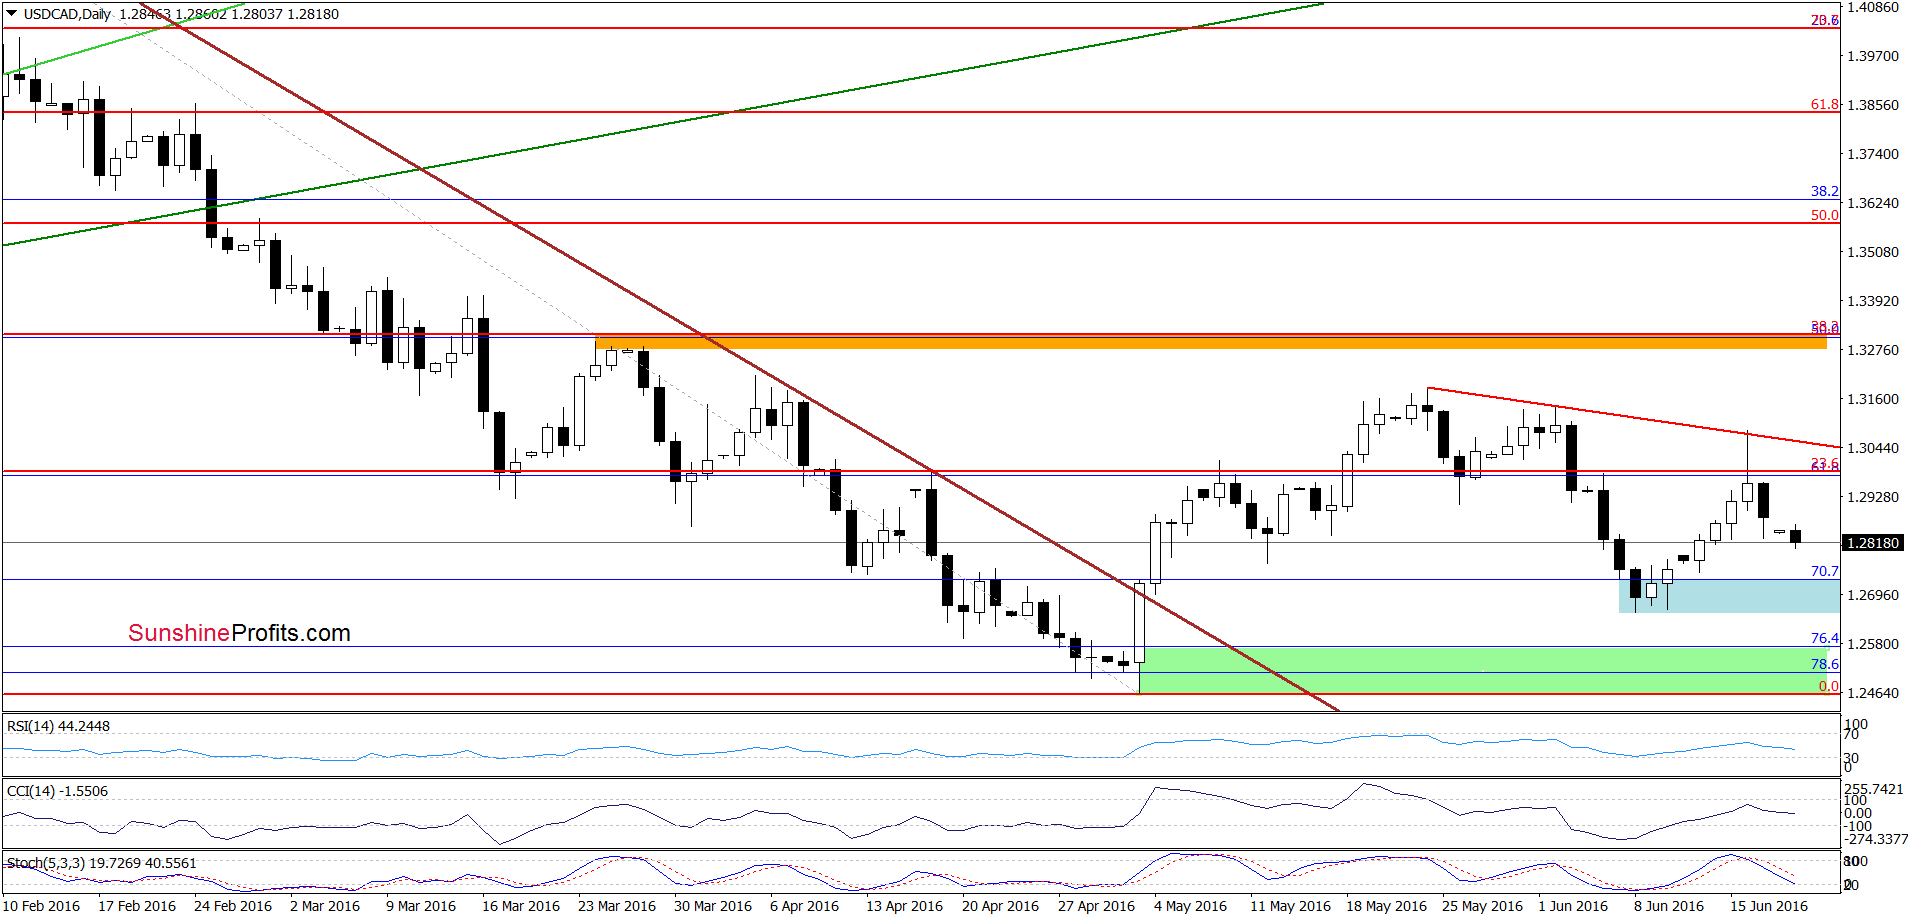
(…) Although the barrier of 1.3000 could trigger a pullback later in the day, buy signals are still in play, supporting another attempt to move higher. If this is the case, and the exchange rate breaks above 1.300, we’ll likely see an increase to around 1.3071, where the short-term red declining resistance line (based on the previous highs) currently is. Nevertheless, at this point it is also worth noting that the Stochastic Oscillator is overbought, which suggests that the space for gains may be limited and reversal in near future should not surprise us.
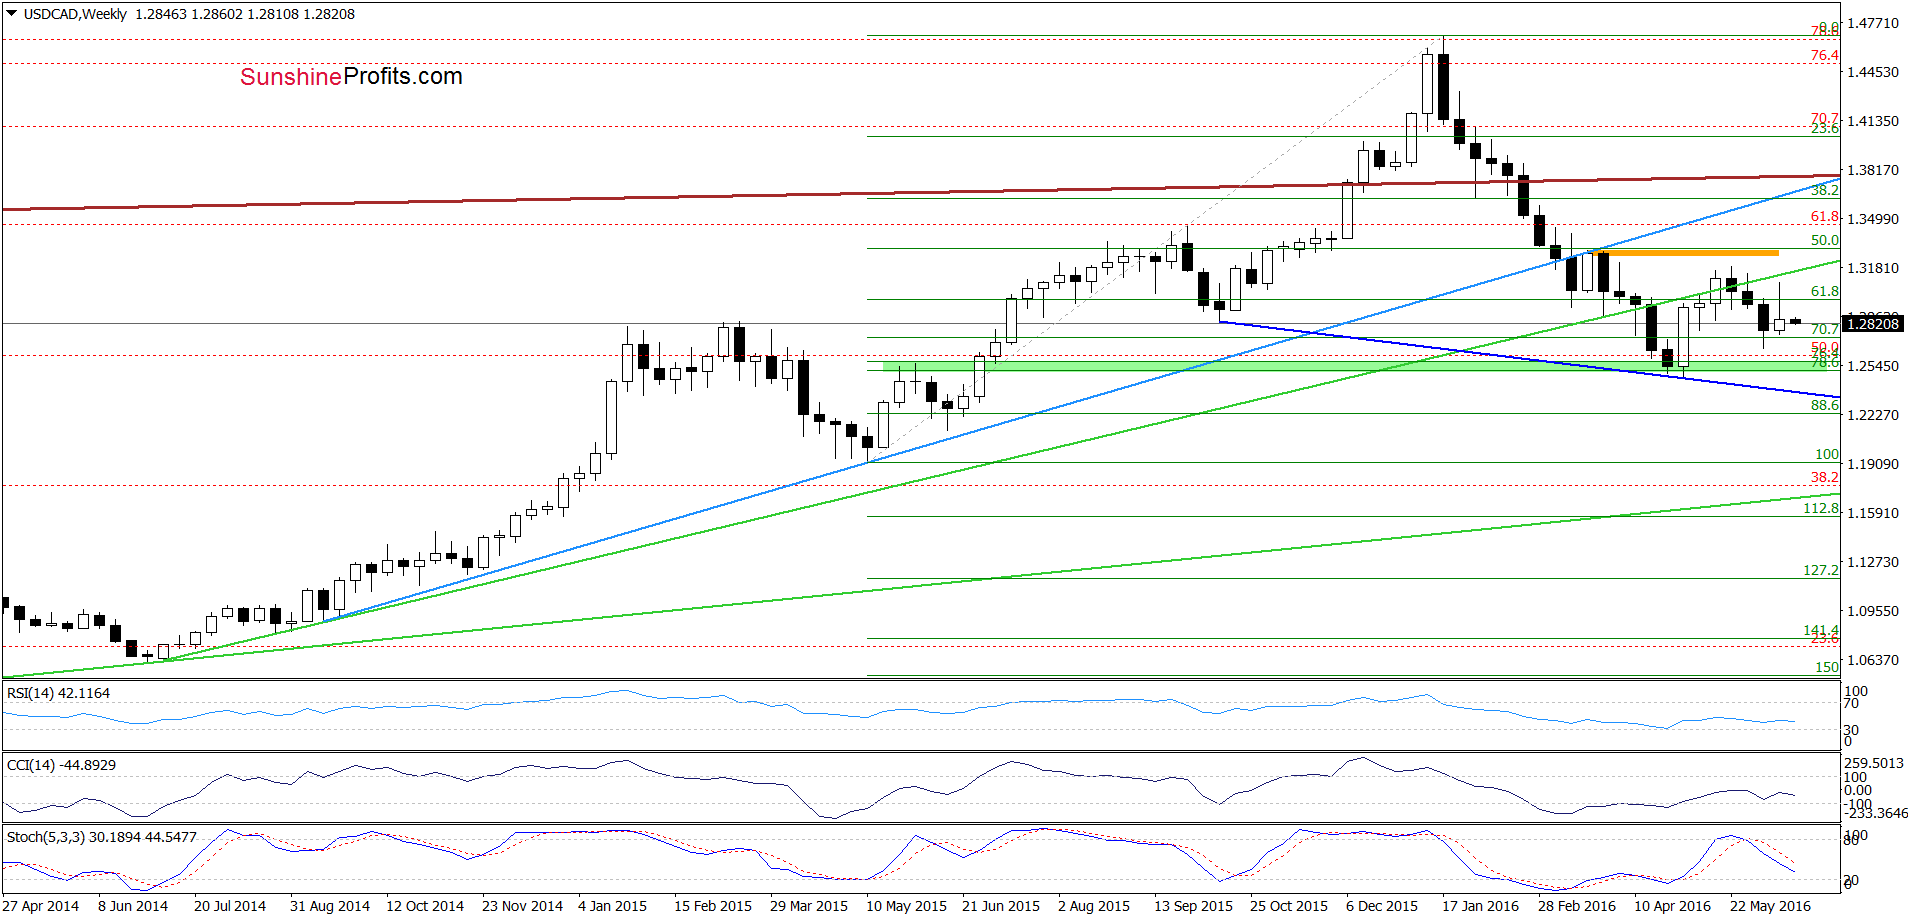
From today’s point of view, we see that the situation developed in line with the above scenario and USD/CAD reversed after an increase to the short-term red declining resistance line based on the previous highs. Thanks to this drop, the pair invalidated earlier breakout above the barrier of 1.3000, which suggests further deterioration and a test of the recent lows and the 70.7% Fibonacci retracement in the coming days.
Very short-term outlook: mixed with bearish bias
Short-term outlook: mixed
MT outlook: mixed
LT outlook: mixed
USD/CHF
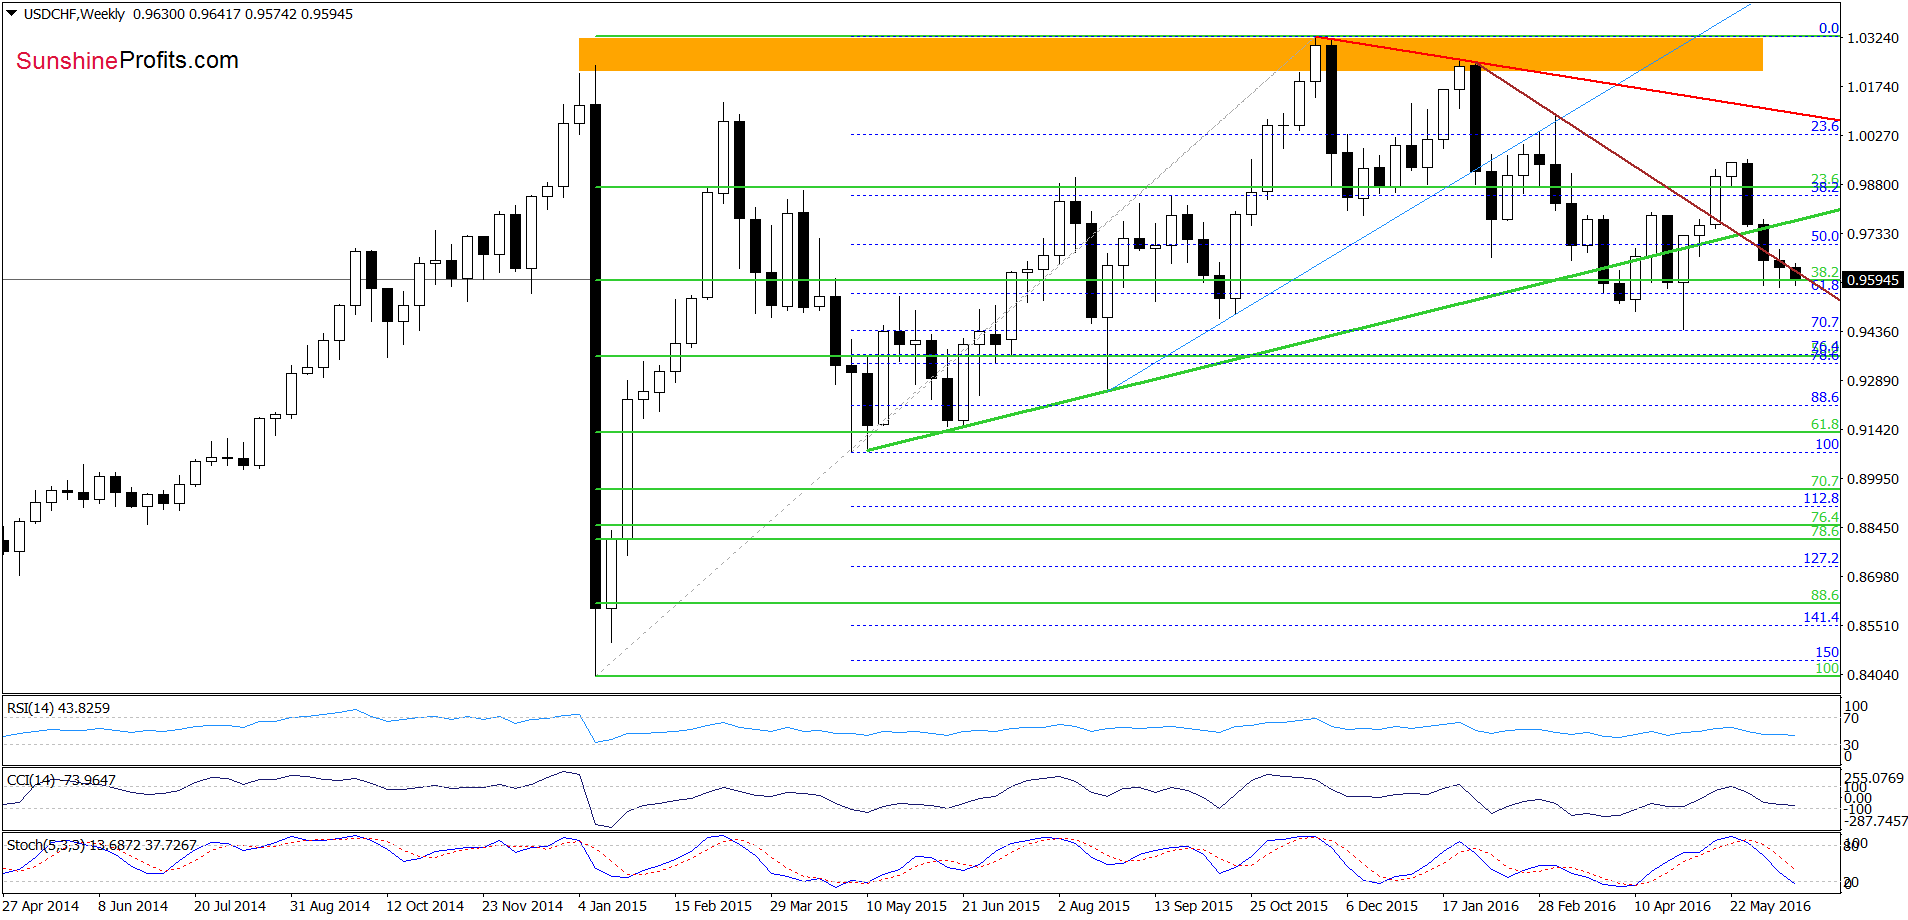
Looking at the weekly chart, we see that USD/CHF declined under the brown declining support/resistance line once again, which encouraged currency bears to act. How did this drop affect the very short-term picture? Let’s check below.
On Friday, we wrote the following:
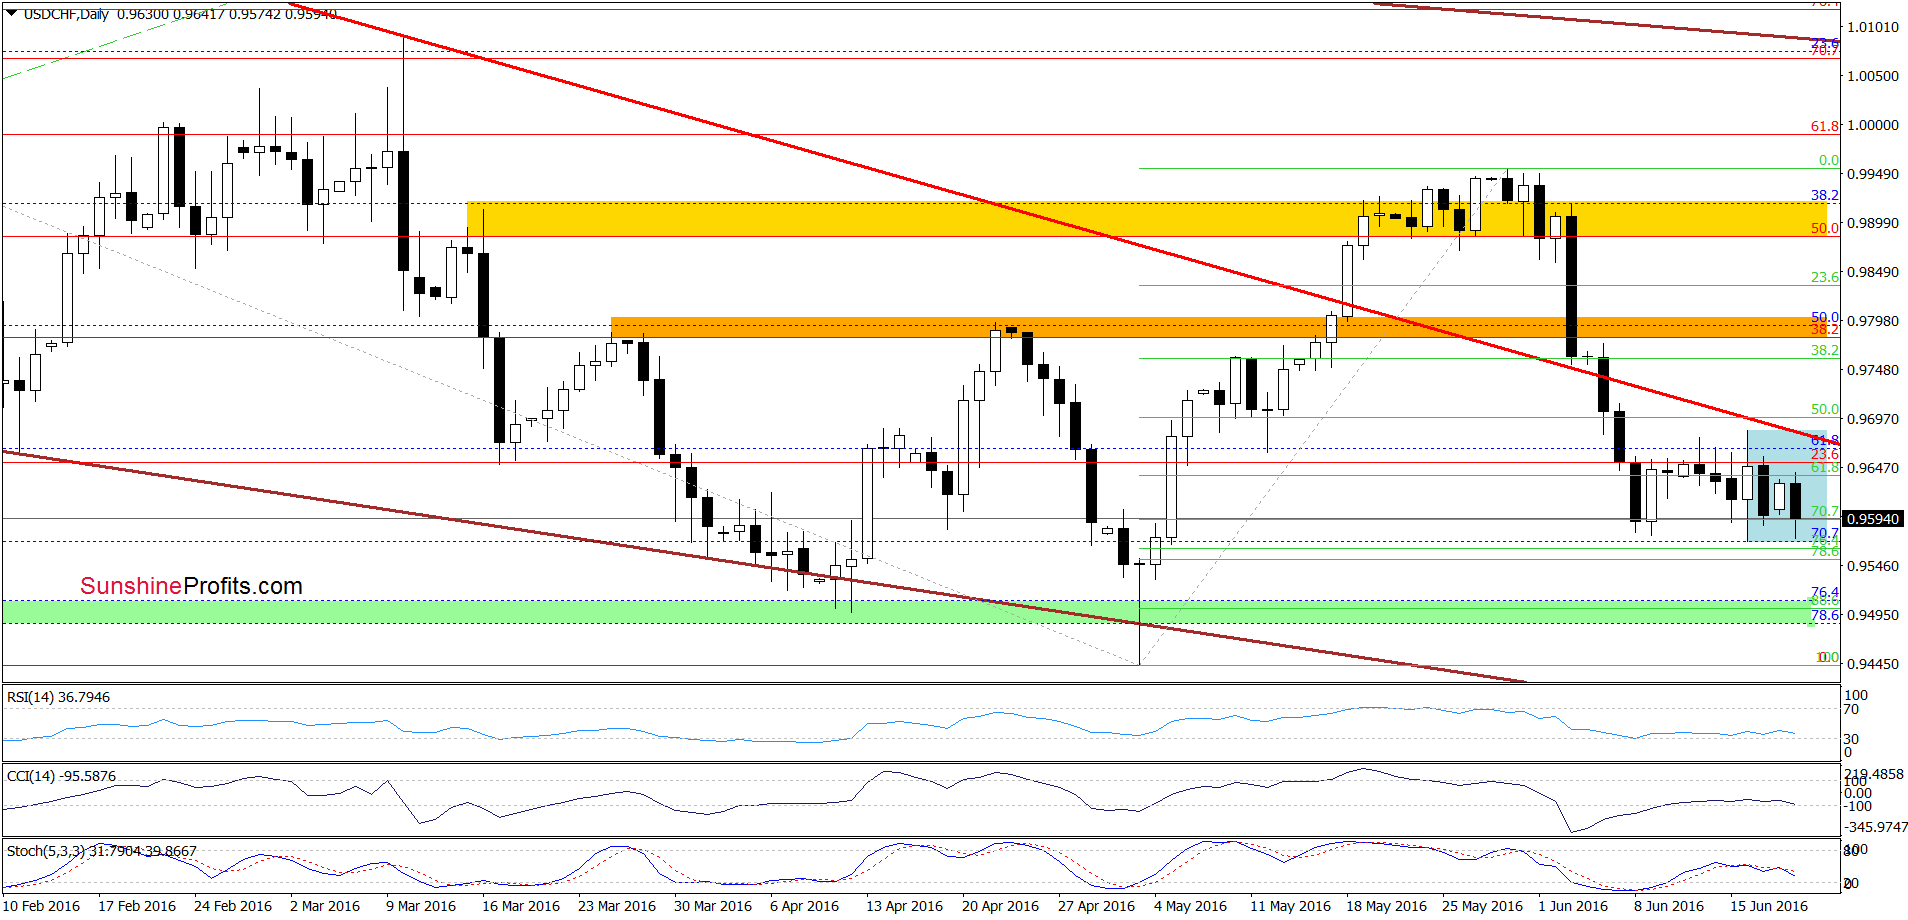
(…) the proximity to the red declining resistance line in combination with the medium-term picture pushed the pair lower earlier today. As a result, USD/CHF invalidated breakout above the previously-broken 61.8% Fibonacci retracement, which suggests a test of recent lows in the coming day(s).
As you see on the daily chart, the situation developed in line with the above scenario and USD/CHF reached our downside target. What’s next? Taking into account the fact that the exchange rate remains in a blue consolidation, we think that as long as there won’t be breakdown under the lower line of the formation (or a breakout above the upper border), another bigger move is not likely to be seen.
Very short-term outlook: mixed
Short-term outlook: mixed
MT outlook: mixed
LT outlook: mixed
Trading position (short-term; our opinion): No positions are justified from the risk/reward perspective. We will keep you informed should anything change, or should we see a confirmation/invalidation of the above.
AUD/USD
Quoting our Friday’s alert:
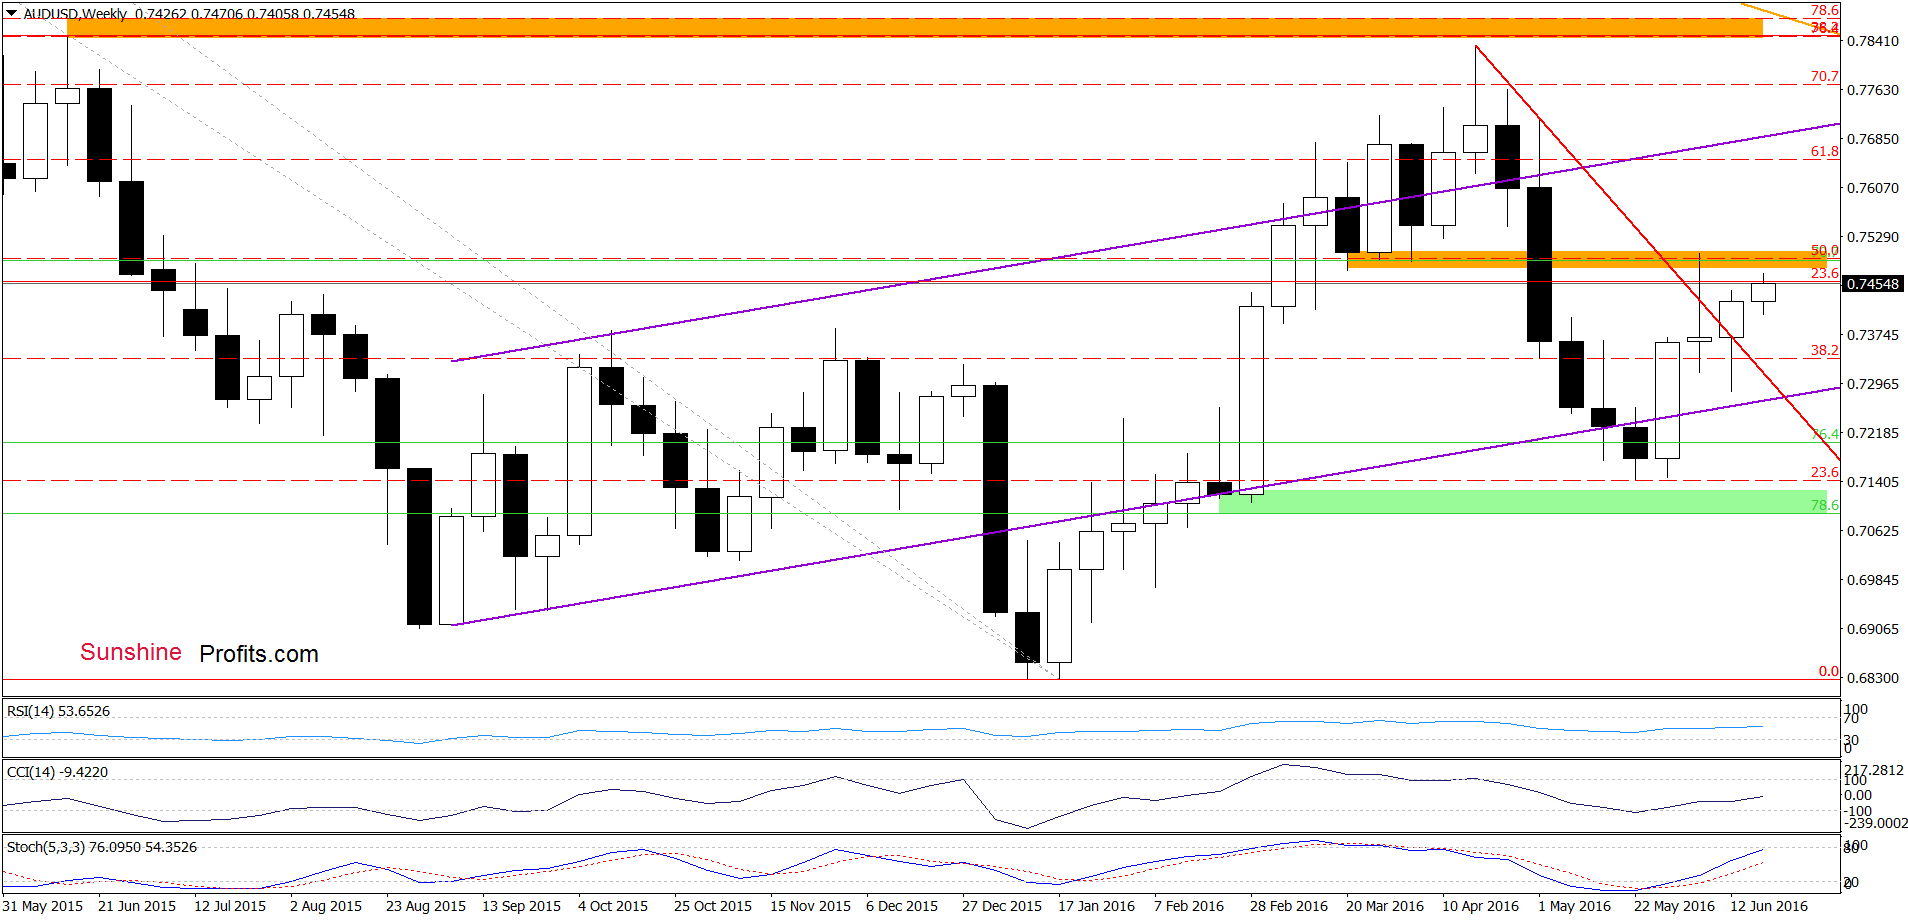
(…) AUD/USD came back above the red declining resistance line, which in combination with buy signals generated by the indicators, suggests further improvement in the coming days. Nevertheless, such price action would be more likely and reliable if the pair closes this week above this line.
From today’s point of view, we see that currency bulls pushed the pair higher and AUD/USD closed the previous week above the red declining resistance line, which is a positive signal that suggests further improvement.
How high could the exchange rate go in the coming days?
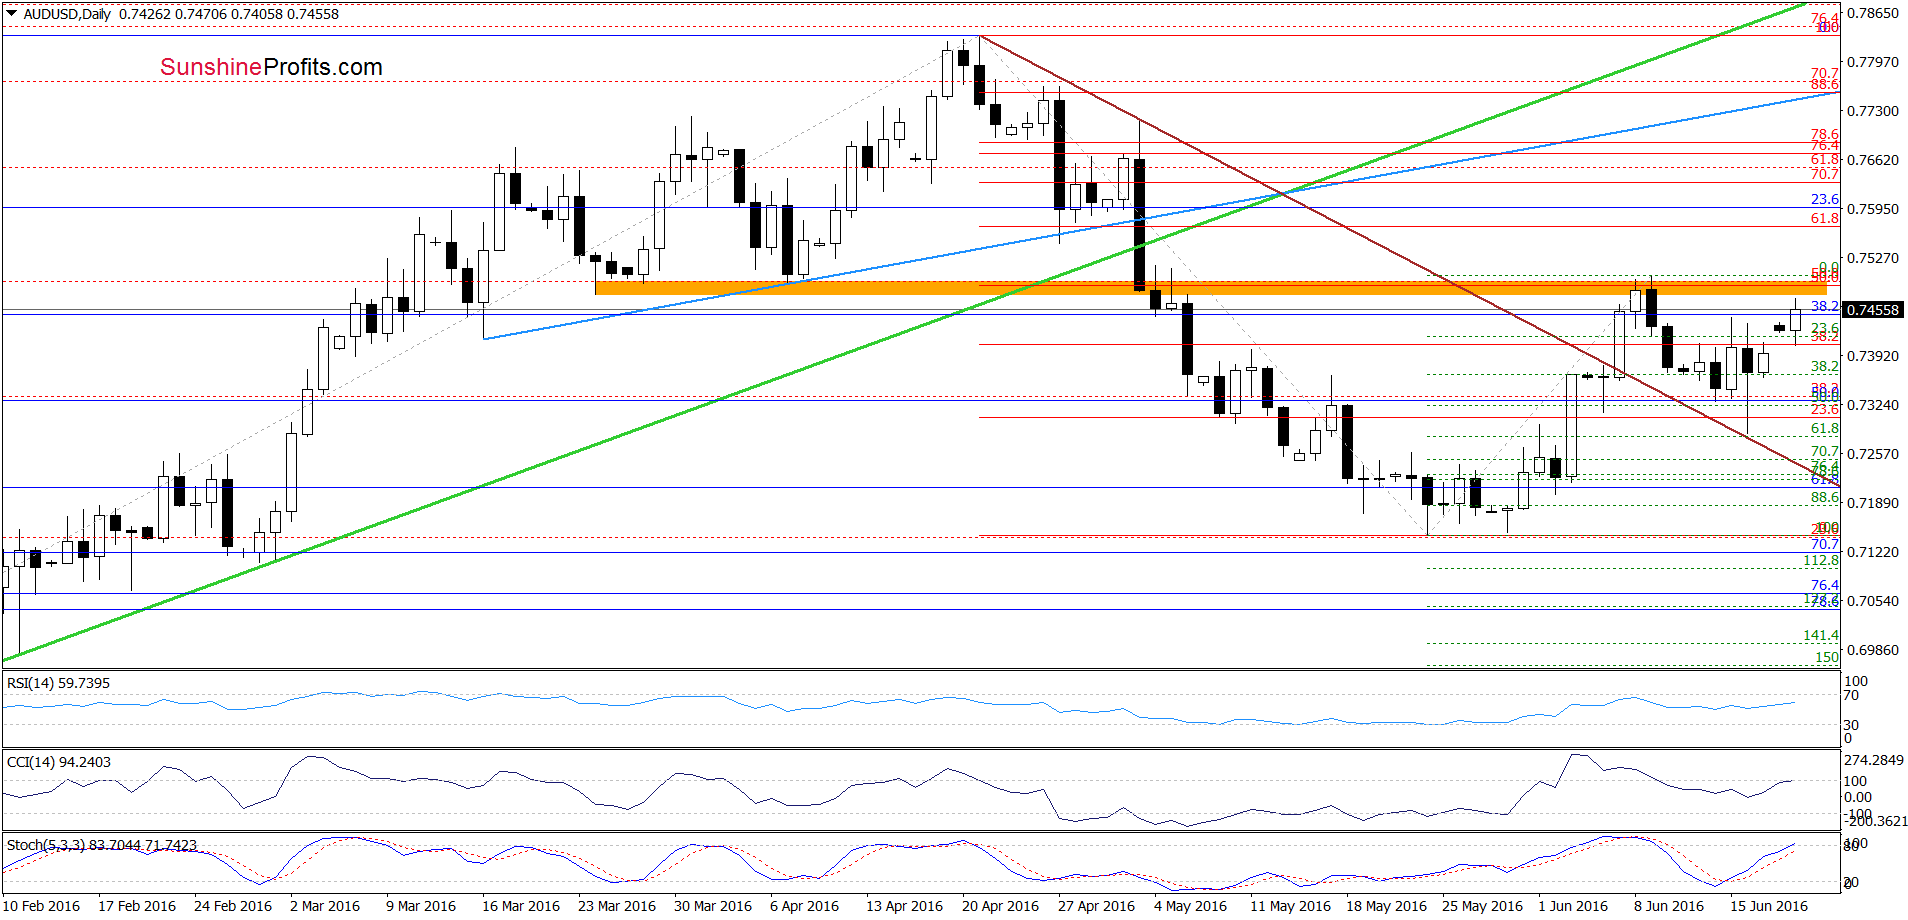
If the pair increases from here, the initial upside target would be the orange resistance zone, which stopped currency bulls earlier this month. However, as long as there won’t be sell signals another attempt to move higher is likely. Therefore, if currency bulls manage to push the pair above this resistance zone, the next upside target would be around 0.7570, where the 61.8% Fibonacci retracement based on the entire recent downward move currently is.
Very short-term outlook: mixed with bullish bias
Short-term outlook: mixed
MT outlook: mixed
LT outlook: mixed
Trading position (short-term; our opinion): No positions are justified from the risk/reward perspective. We will keep you informed should anything change, or should we see a confirmation/invalidation of the above.
Thank you.
Nadia Simmons
Forex & Oil Trading Strategist
Przemyslaw Radomski, CFA
Founder, Editor-in-chief
Gold & Silver Trading Alerts
Forex Trading Alerts
Oil Investment Updates
Oil Trading Alerts

