

Earlier today, official data showed that the euro area’s gross domestic product increased by 0.6% in the first quarter of the year, beating expectations for a growth of 0.4%. Additionally, the euro zone’s GDP (on a year-on-year basis) increased by 1.6% in the first quarter, also beating forecasts for a 1.4% growth. Thanks to these solid numbers, the euro extended gains against the greenback, which resulted in a comeback above the Feb high. Will we see a test of the recent peak in the coming week?
In our opinion the following forex trading positions are justified - summary:
- EUR/USD: short (stop-loss order at 1.1512; initial downside target at 1.0572)
- GBP/USD: none
- USD/JPY: none
- USD/CAD: none
- USD/CHF: none
- AUD/USD: none
EUR/USD
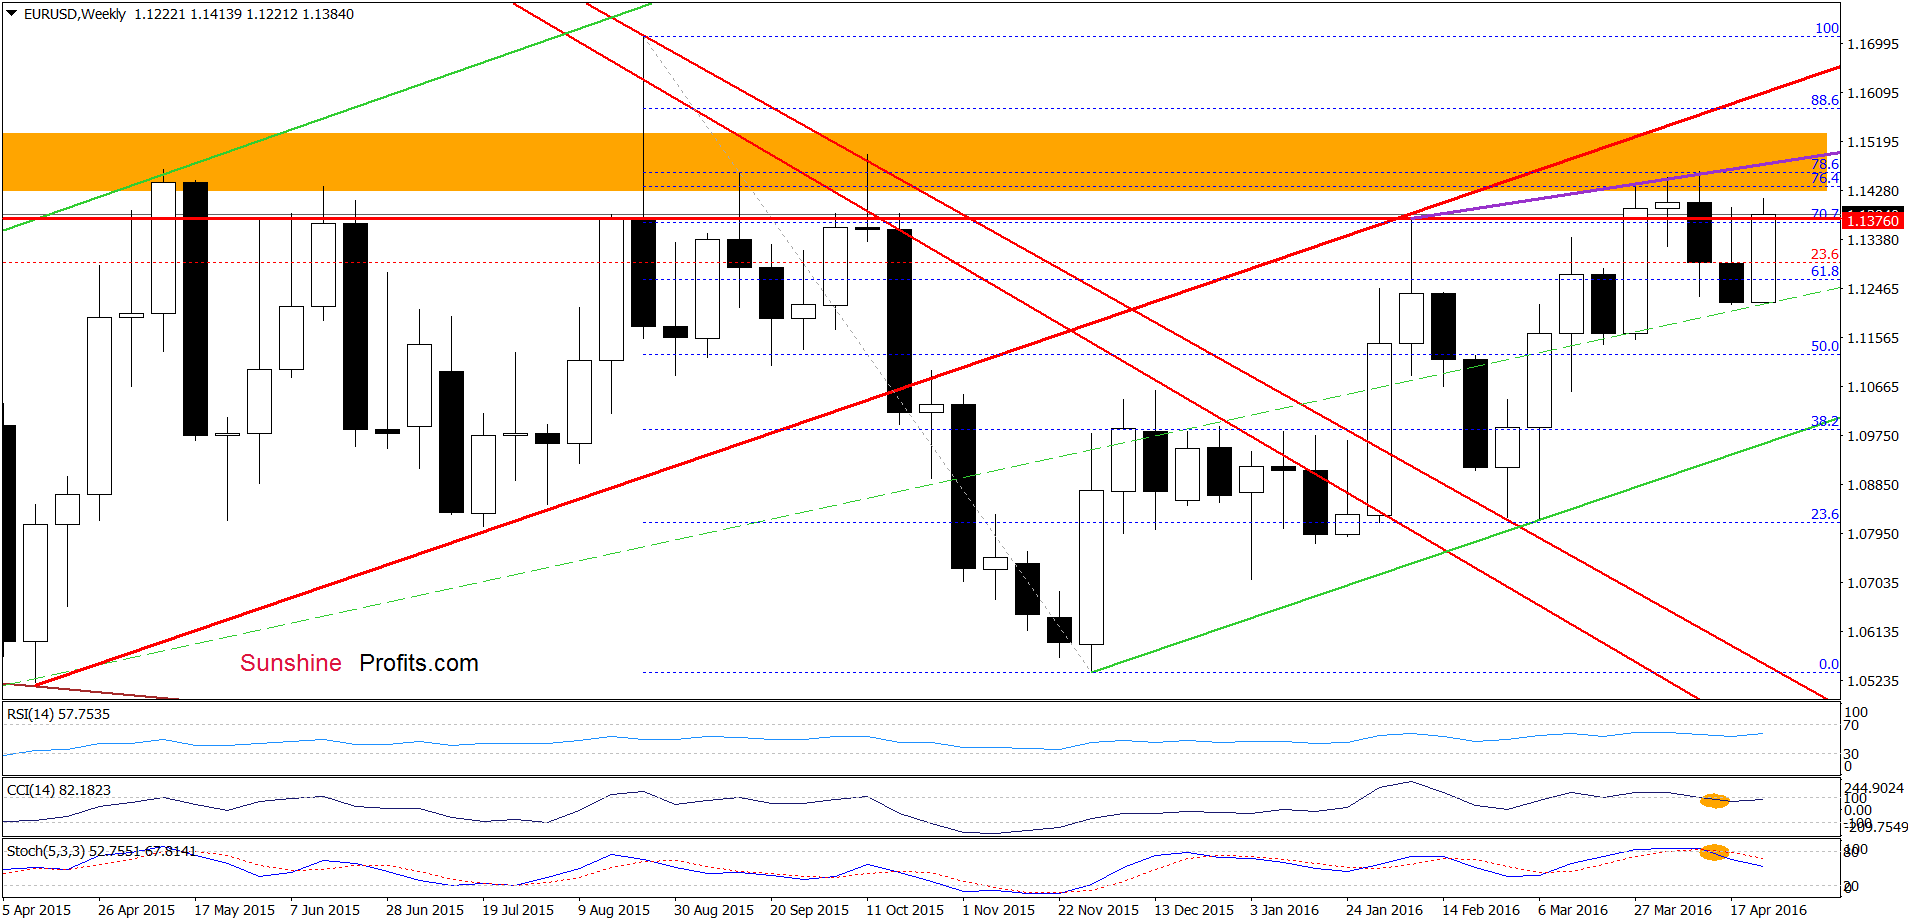
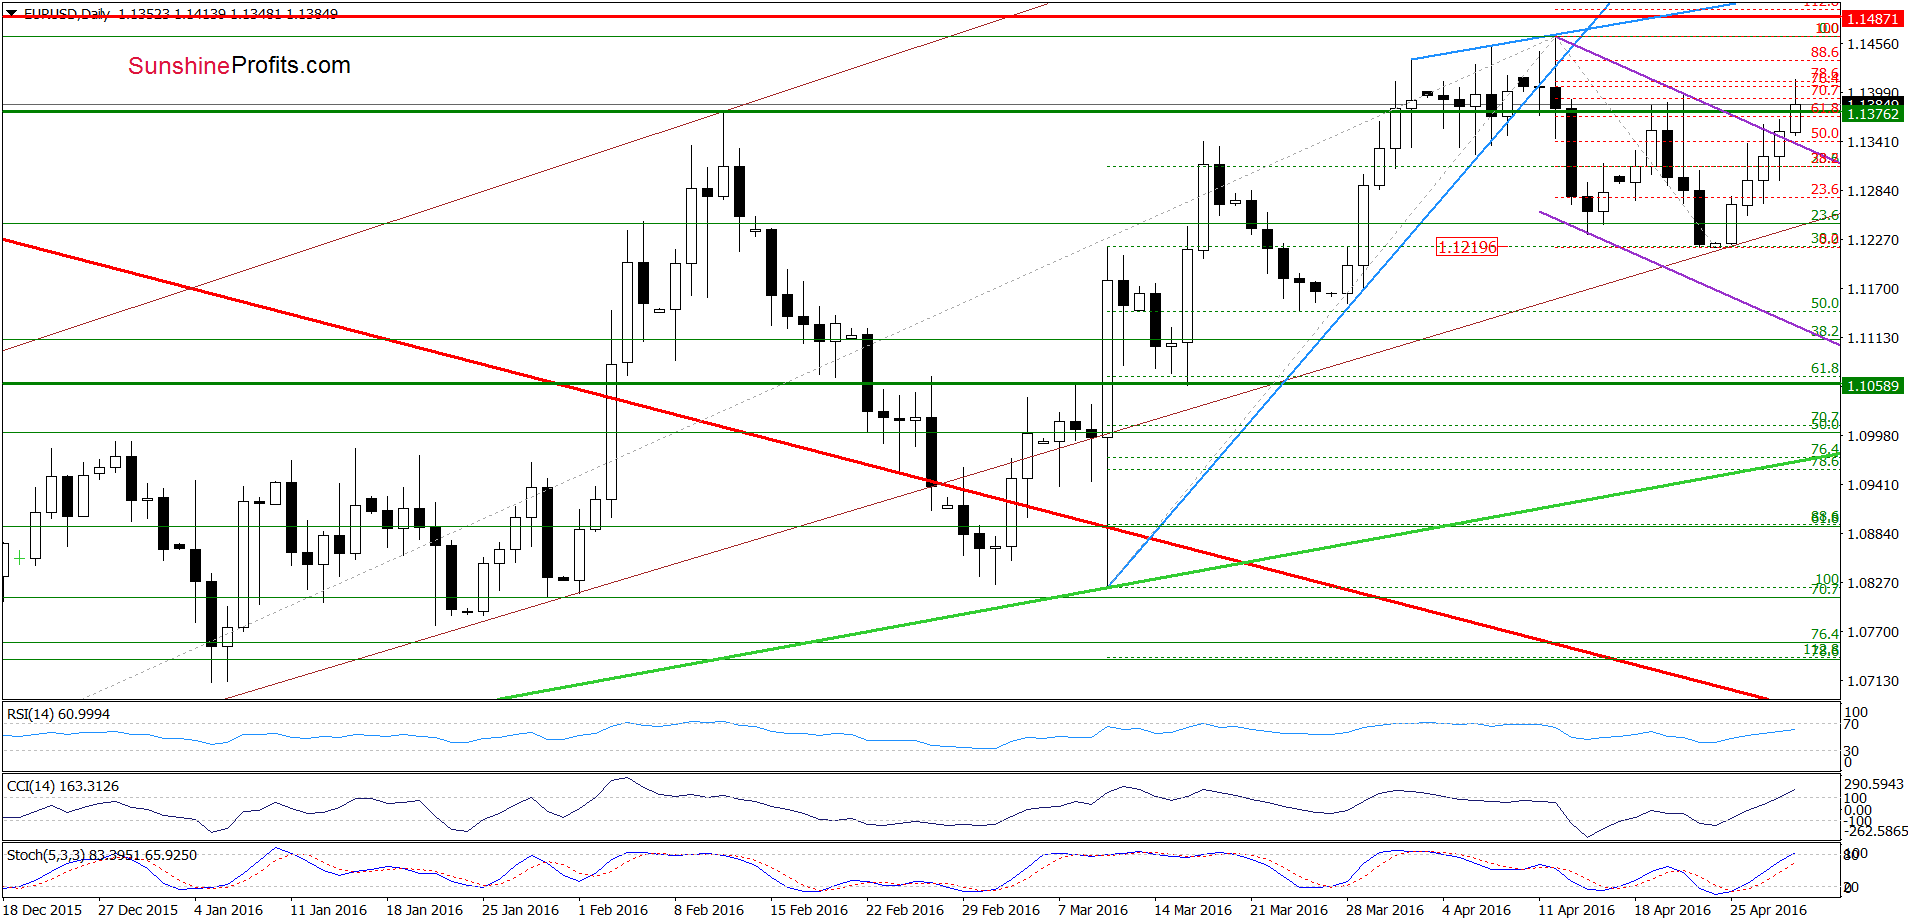
From today’s point of view, we see that that the exchange rate extended gains and climbed to the resistance zone created by the 76.4% and 78.6% Fibonacci retracements (based on the entire recent decline). Although this area triggered a pullback earlier today, buy signals generated by the daily indicators remain in place, supporting currency bulls. Therefore, it seems that EUR/USD could test even the Apr high in the coming days. Nevertheless, even if we see such price action, sell signals generated by the weekly indicators suggest that another attempt to move lower is just a matter of time.
Very short-term outlook: bearish
Short-term outlook: bearish
MT outlook: mixed with bearish bias
LT outlook: mixed
Trading position (short-term; our opinion): Short positions (with a stop-loss order at 1.1512 and the initial downside target at 1.0572) are justified from the risk/reward perspective. We will keep you informed should anything change, or should we see a confirmation/invalidation of the above.
USD/CHF
Quoting our previous commentary on this currency pair:
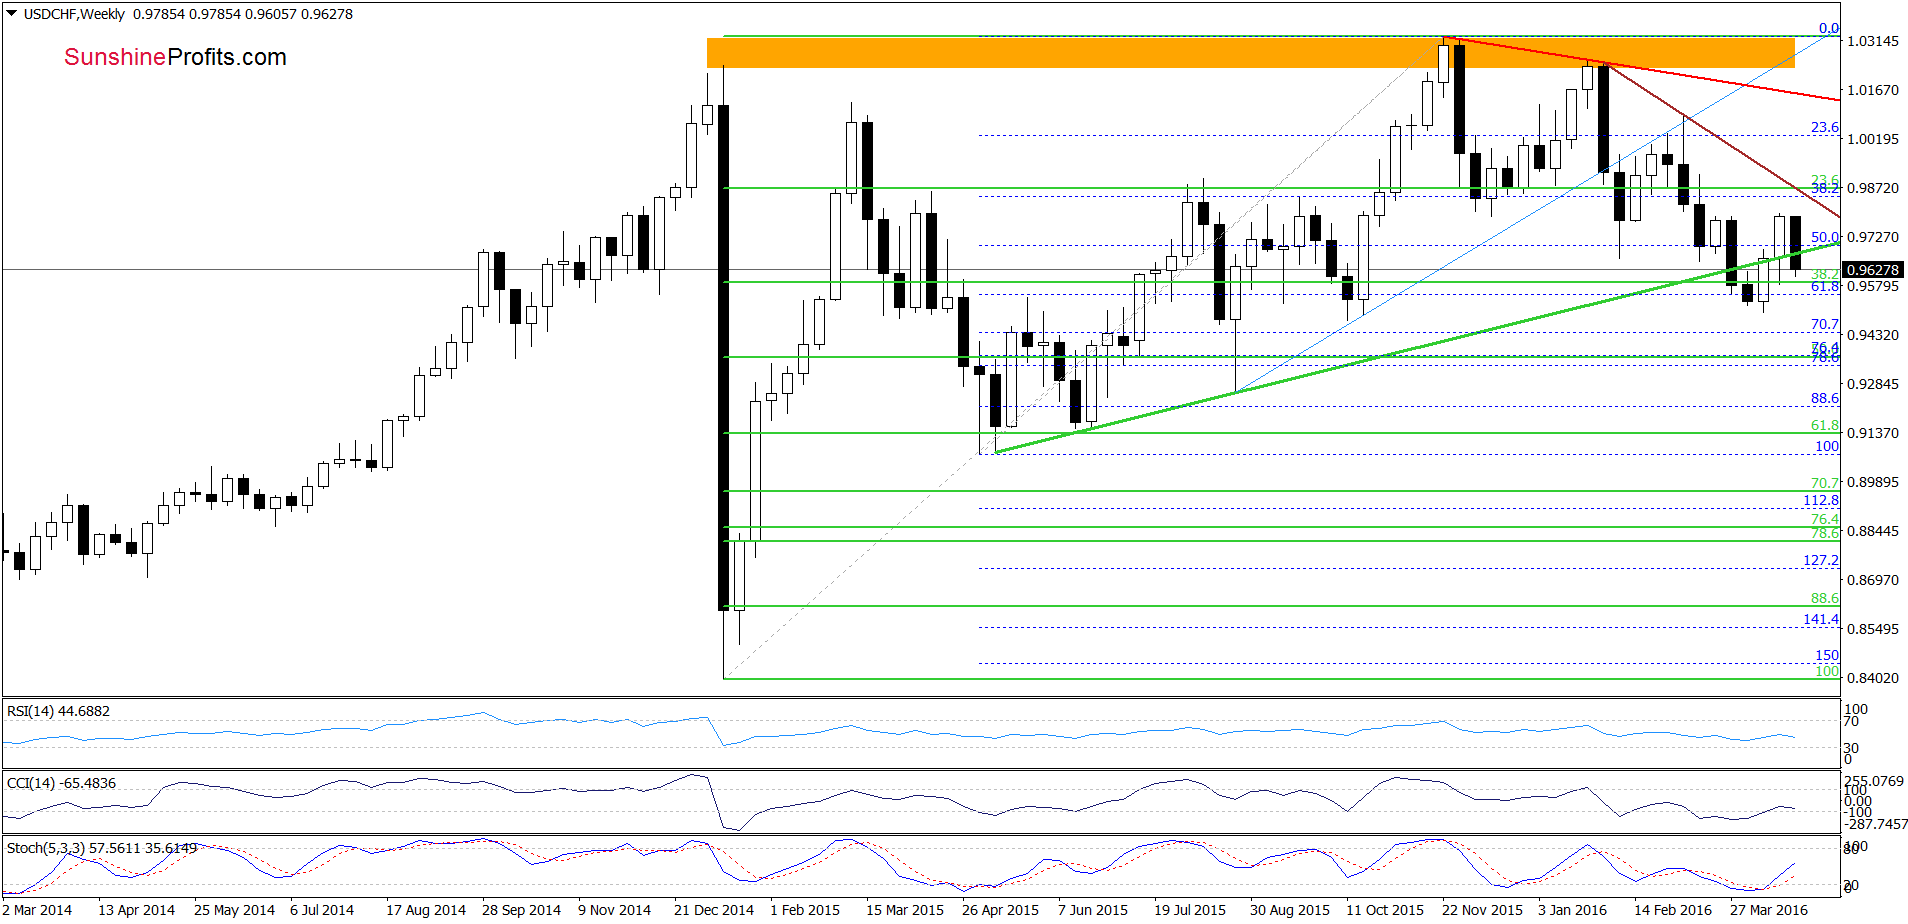
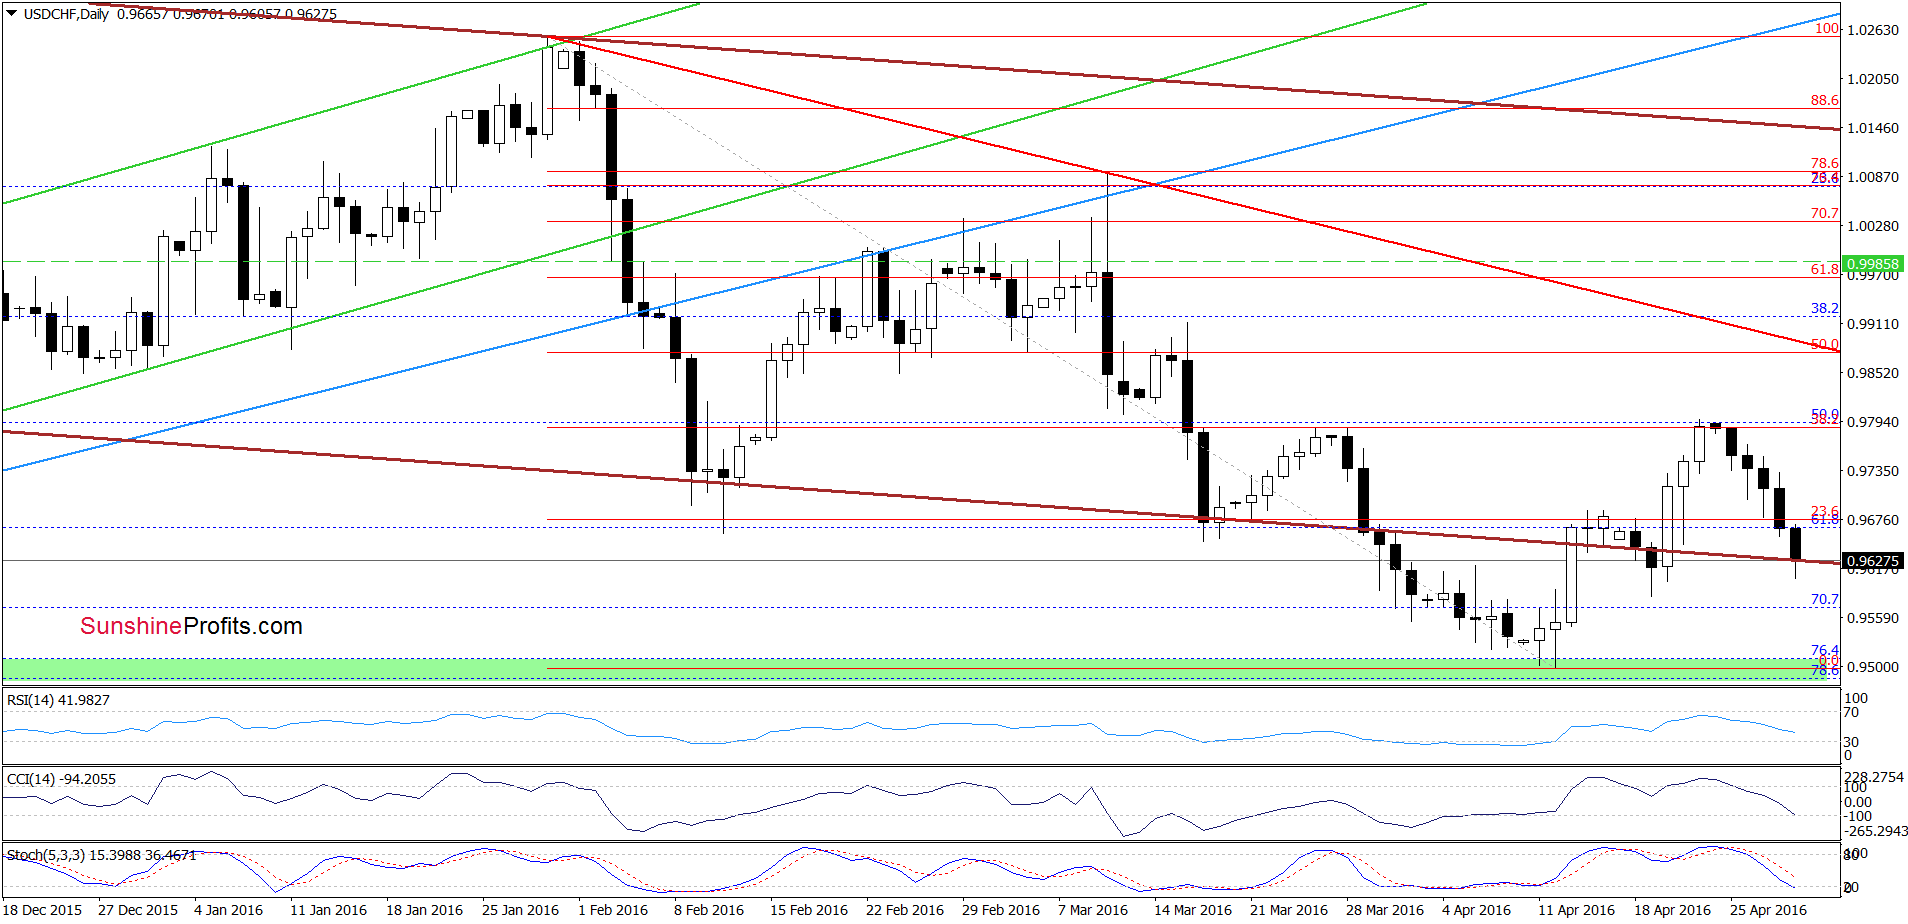
(…) USD/CHF extended losses earlier today, which in combination with the current position of the indicators (sell signals remain in play) suggests that lower values of the exchange rate are still very likely. If this is the case and the pair declines further, the initial downside target would be around 0.9670, where the green support line (marked on the weekly chart) currently is.
Looking at the above charts, we see that currency bears pushed USD/CHF lower as we had expected. With this downswing, the pair not only reached our downside target, but also declined below it. In this way, the exchange rate invalidated earlier climb above the medium-term green support line, which resulted in a drop to the lower border of the brown declining trend channel marked on the daily chart. What’s next? Although the pair could rebound from here – similarly to what we saw in the previous week, we should keep in mind that sell signals are still in play, which in combination with the medium-term picture suggests further deterioration. If this is the case and USD/CHF drops under the brown support line, we’ll likely see a re-test of the green support zone (created by the 76.4% and 78.6% Fibonacci retracements and recent lows) in the coming week.
Very short-term outlook: mixed with bearish bias
Short-term outlook: mixed
MT outlook: mixed
LT outlook: mixed
Trading position (short-term; our opinion): No positions are justified from the risk/reward perspective. We will keep you informed should anything change, or should we see a confirmation/invalidation of the above.
AUD/USD
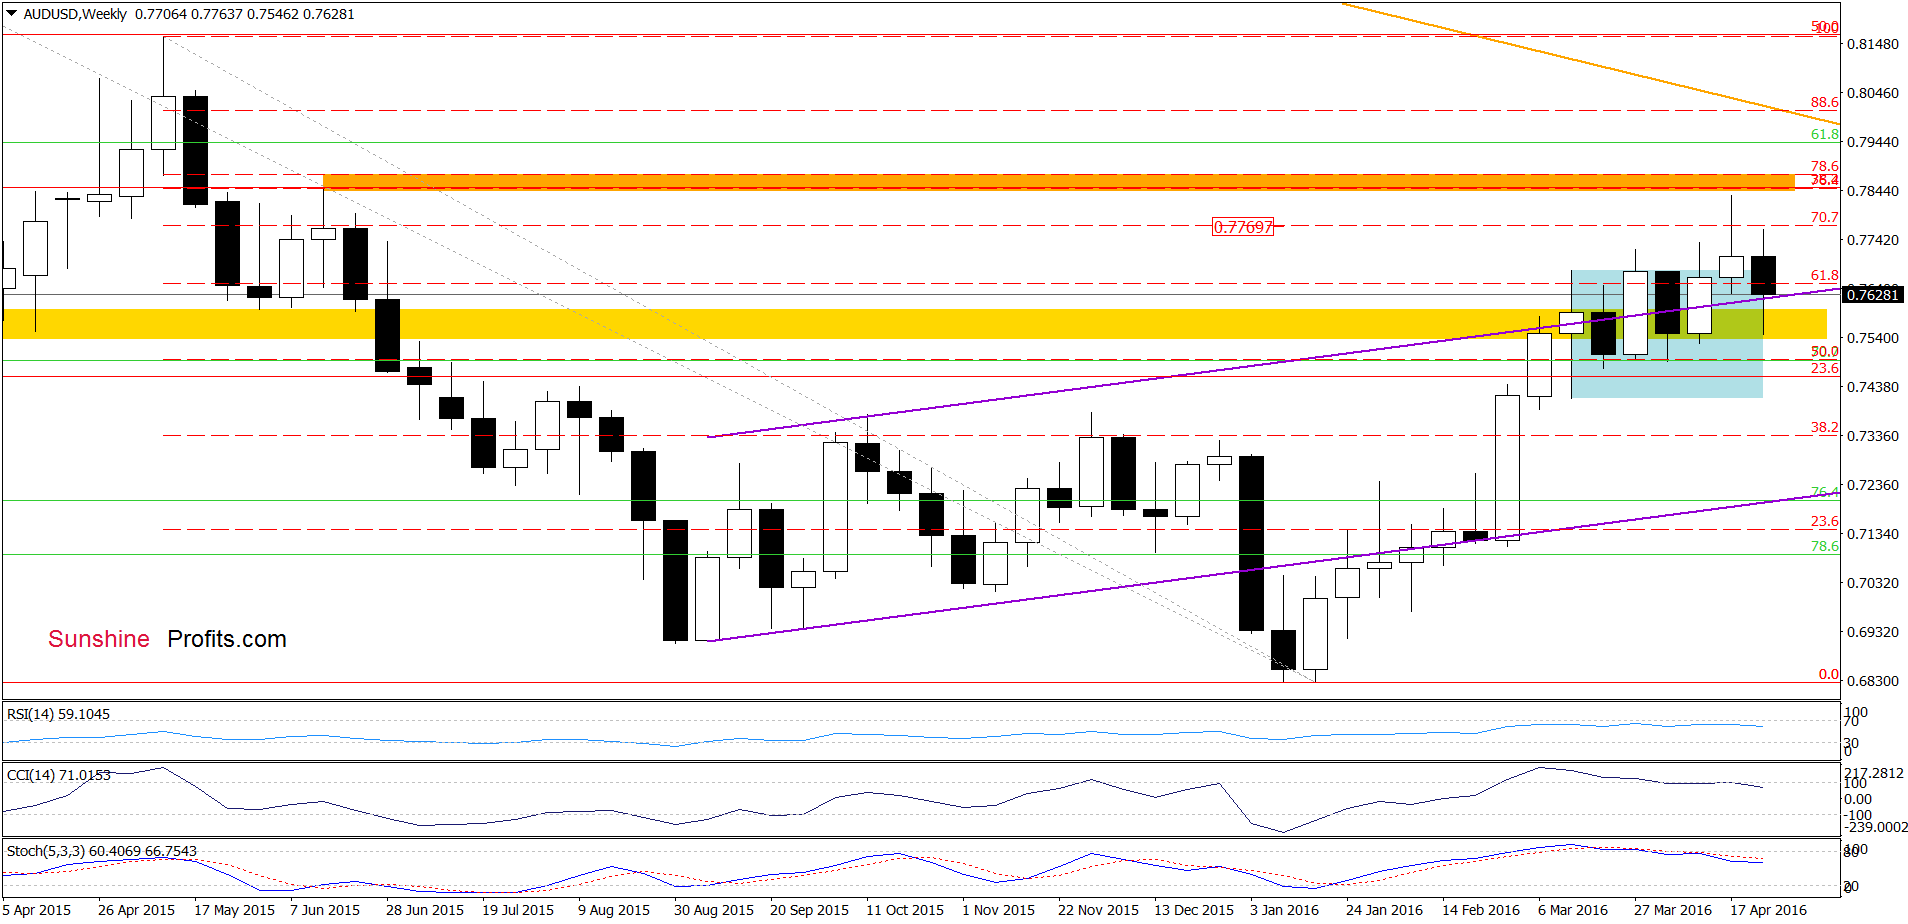
The first thing that catches the eye on the weekly chart is invalidation of the breakdown under the upper border of the rising purple trend channel, which is a positive signal. Nevertheless, in our opinion it would be more important if we see a weekly closure above this line.
Will the daily chart give us more clues about future moves? Let’s check.
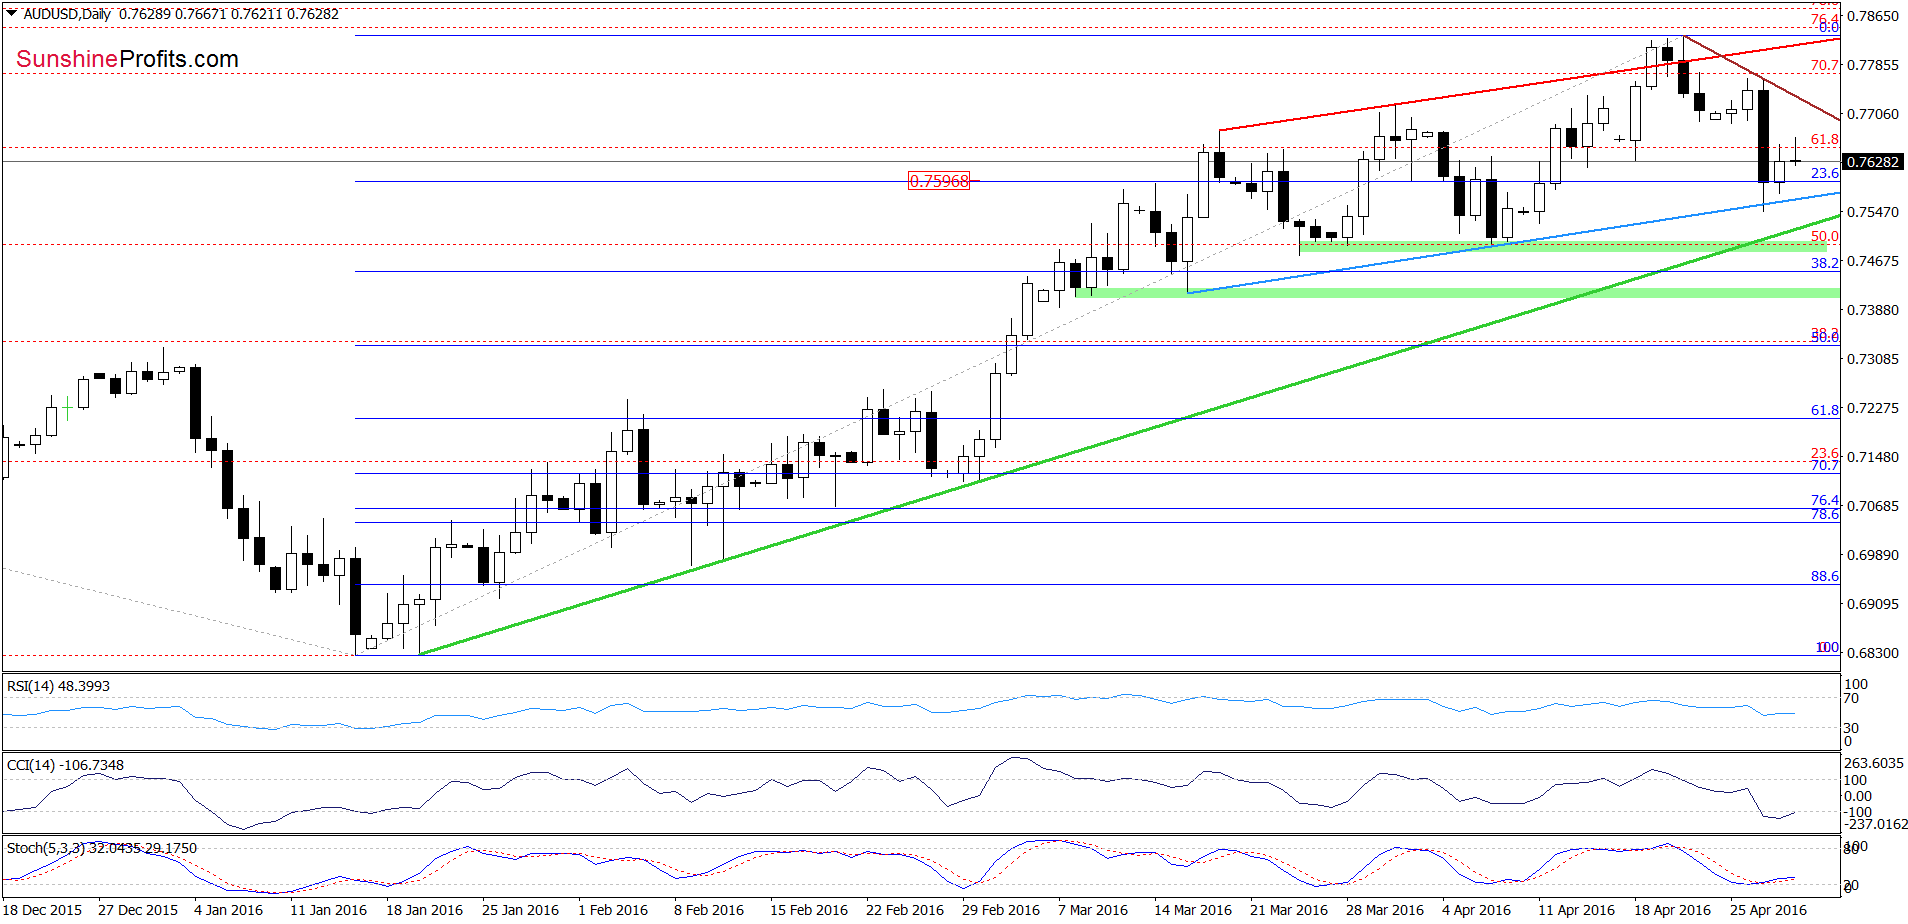
On Wednesday, we wrote the following:
(…) the pair approached our downside target, however, there are no buy signals that could encourage currency bulls to act, which suggests that we may see a test of the blue support line based on the previous lows in the coming day(s).
On the chart, we see the situation developed in tune with the above scenario and AUD/USD reached our target. As you see this support line encouraged currency bulls to act, which resulted in a rebound. Additionally, the Stochastic Oscillator generated a buy signal, which suggests that we may see a test of the brown declining resistance line (based on previous highs) in the coming days.
Very short-term outlook: mixed
Short-term outlook: mixed
MT outlook: mixed
LT outlook: mixed
Trading position (short-term; our opinion): No positions are justified from the risk/reward perspective. We will keep you informed should anything change, or should we see a confirmation/invalidation of the above.
Thank you.
Nadia Simmons
Forex & Oil Trading Strategist
Przemyslaw Radomski, CFA
Founder, Editor-in-chief
Gold & Silver Trading Alerts
Forex Trading Alerts
Oil Investment Updates
Oil Trading Alerts

