

Although the U.S. Department of Labor reported that the number of initial jobless claims in the week ending January 22 dropped by 14,000 (beating expectations for a 12,000 decline, the U.S. Commerce Department showed that total durable goods orders declined by 5.1% in the previous month, missing forecasts for a decline of 0.6%. Additionally, core durable goods orders (without volatile transportation items) fell by 1.2% in Dec, also disappointing expectations for a drop of 0.1%. Thanks to these mixed data, the USD Index extended losses and slipped under the level of 99. What impact did this drop have on the euro, Canadian and Australian dollars?
In our opinion the following forex trading positions are justified - summary:
- EUR/USD: short (stop-loss order at 1.1363; initial downside target at 1.0462)
- GBP/USD: none
- USD/JPY: none
- USD/CAD: none
- USD/CHF: none
- AUD/USD: none
EUR/USD
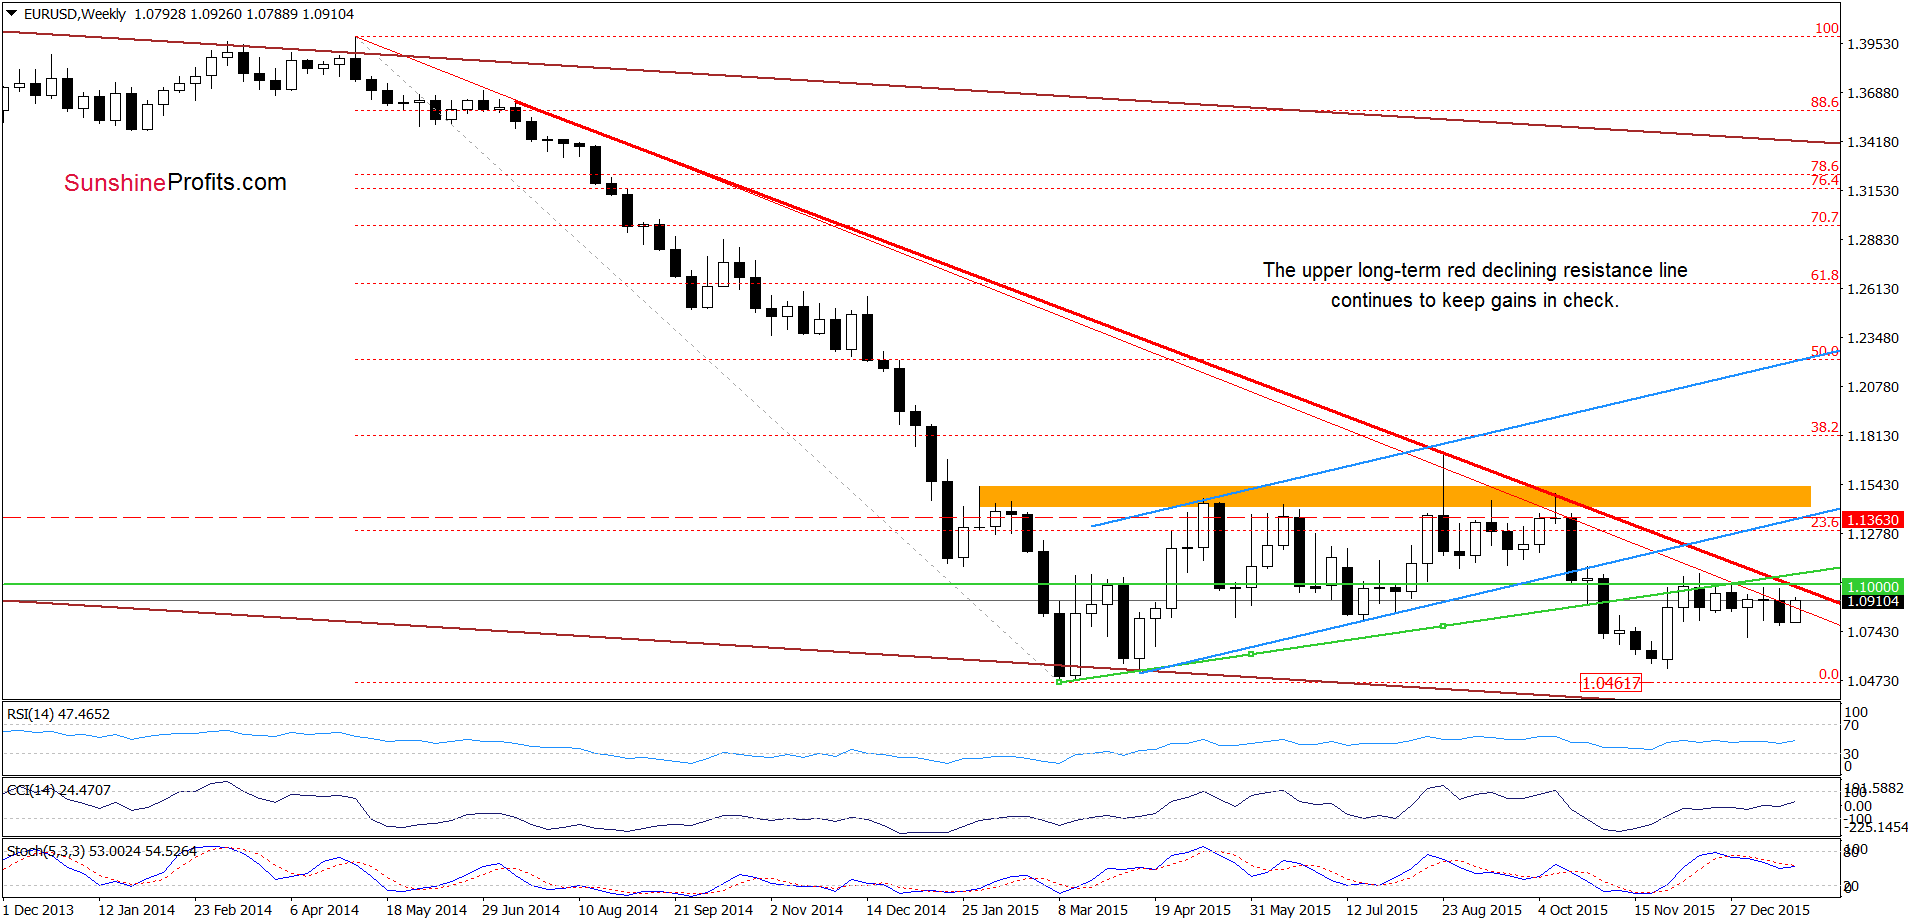
Looking at the weekly chart, we see that EUR/USD broke above the lower red line. Although this is a positive signal, the upper long-term resistance line, which stopped currency bulls in Aug and Oct, continues to keep gains in check.
What impact did this increase have on the daily chart? Let’s check.
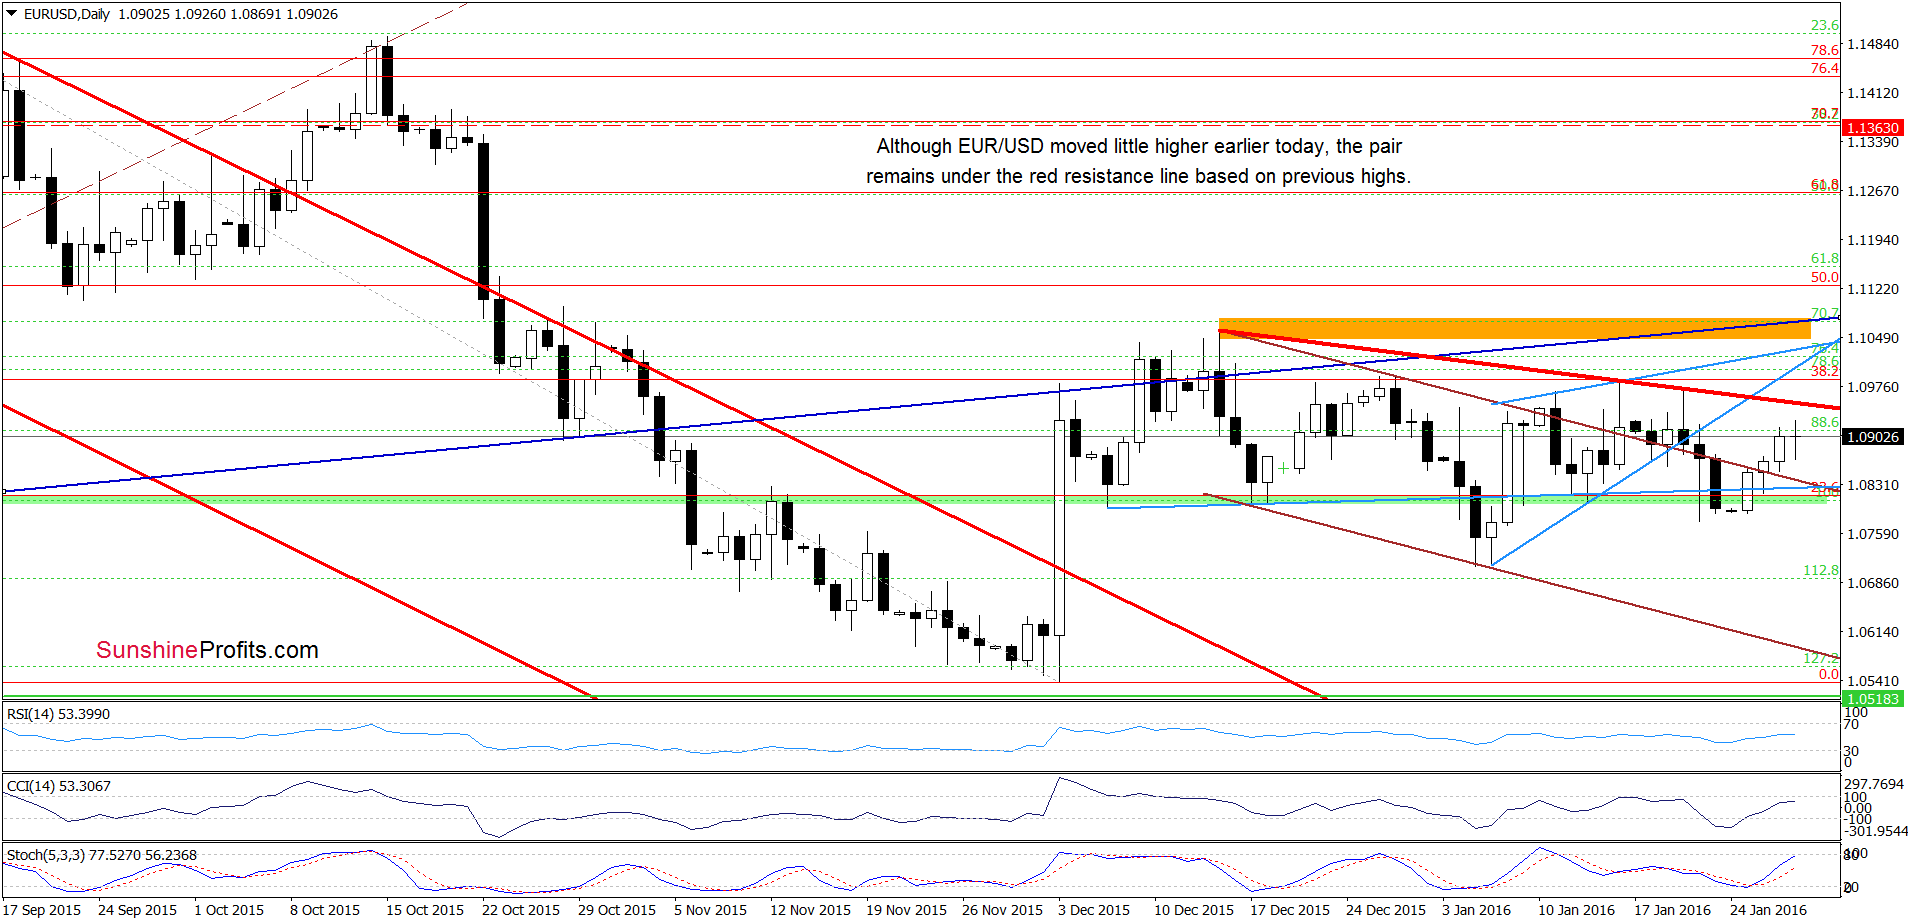
From this perspective, we see that EUR/USD came back above the upper border of the brown declining trend channel in previous days. Although this is a positive signal, which suggests further improvement, we should keep in mind that the pair remains under the previously-broken lower border of the rising wedge (marked with blue), the red resistance line based on the recent highs and the 38.2% Fibonacci retracement. This suggests that as long as there is no breakout above the orange resistance zone, another sizable rally is not likely to be seen.
Very short-term outlook: bearish
Short-term outlook: bearish
MT outlook: bearish
LT outlook: mixed
Trading position (short-term; our opinion): Short positions (with a stop-loss order at 1.1363 and the initial downside target at 1.0462) are justified from the risk/reward perspective. We will keep you informed should anything change, or should we see a confirmation/invalidation of the above.
USD/CAD
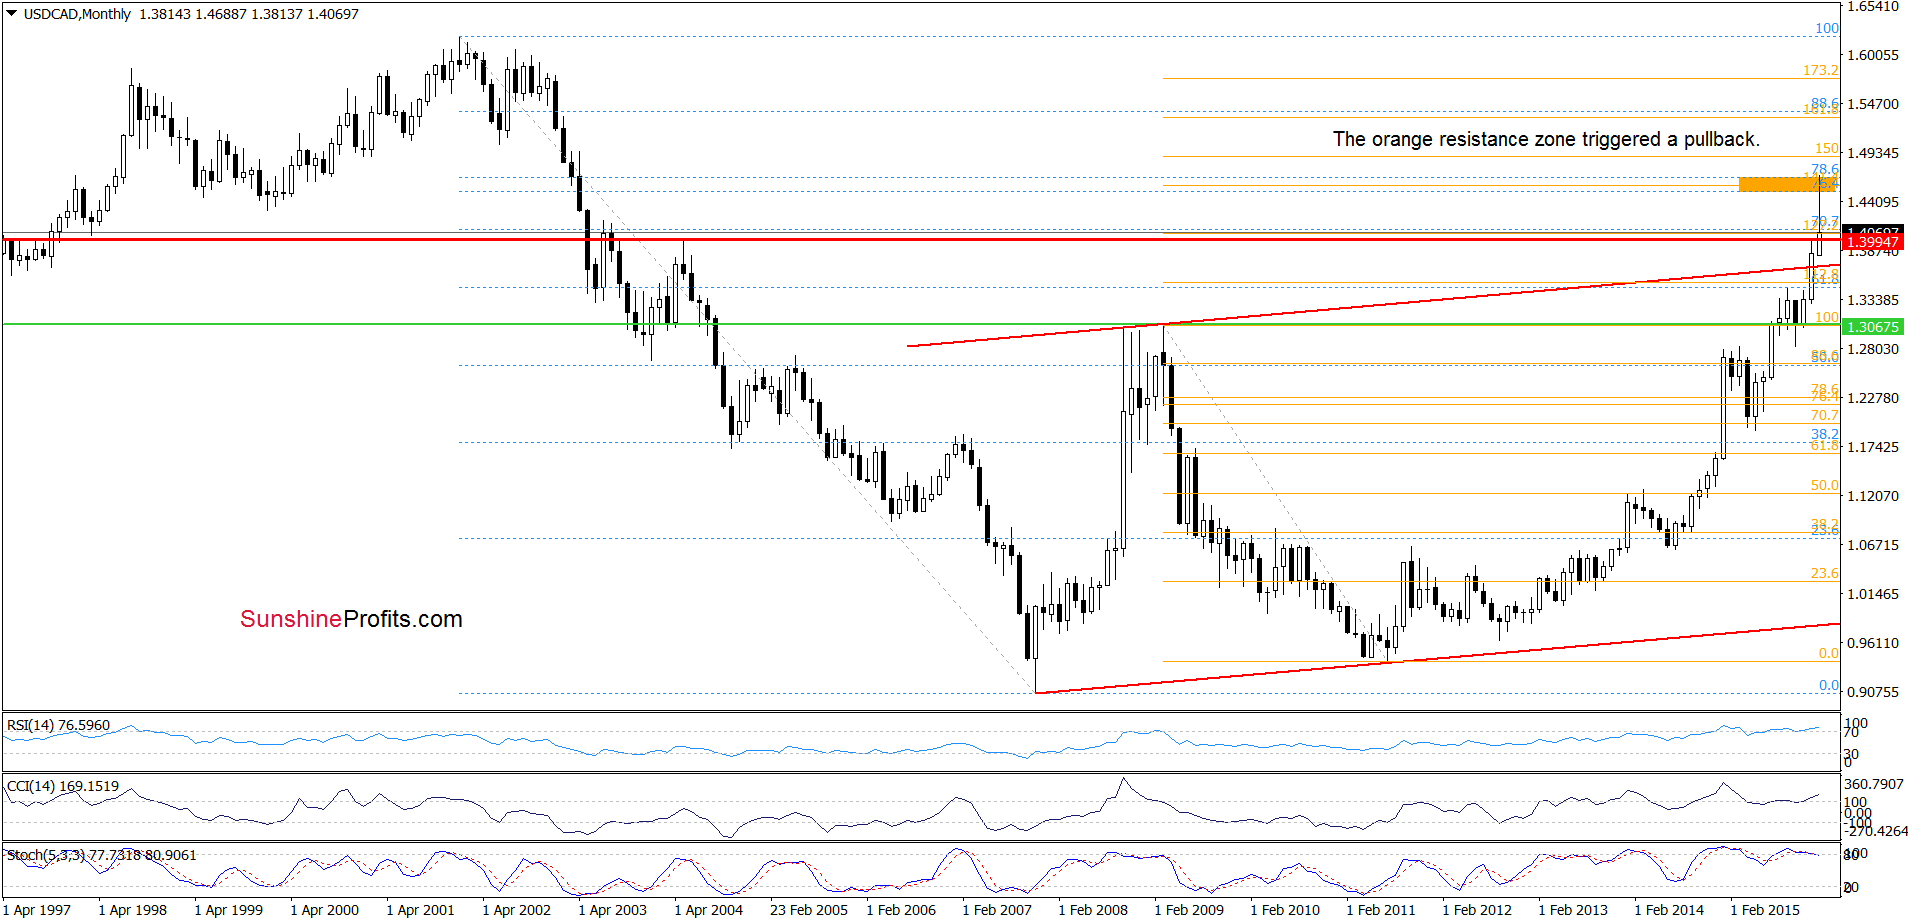
On the weekly chart we see that the orange resistance zone triggered a sharp pullback. How did this drop affect the very short-term picture? Let’s examine the daily chart and find out.
On Tuesday, we wrote:
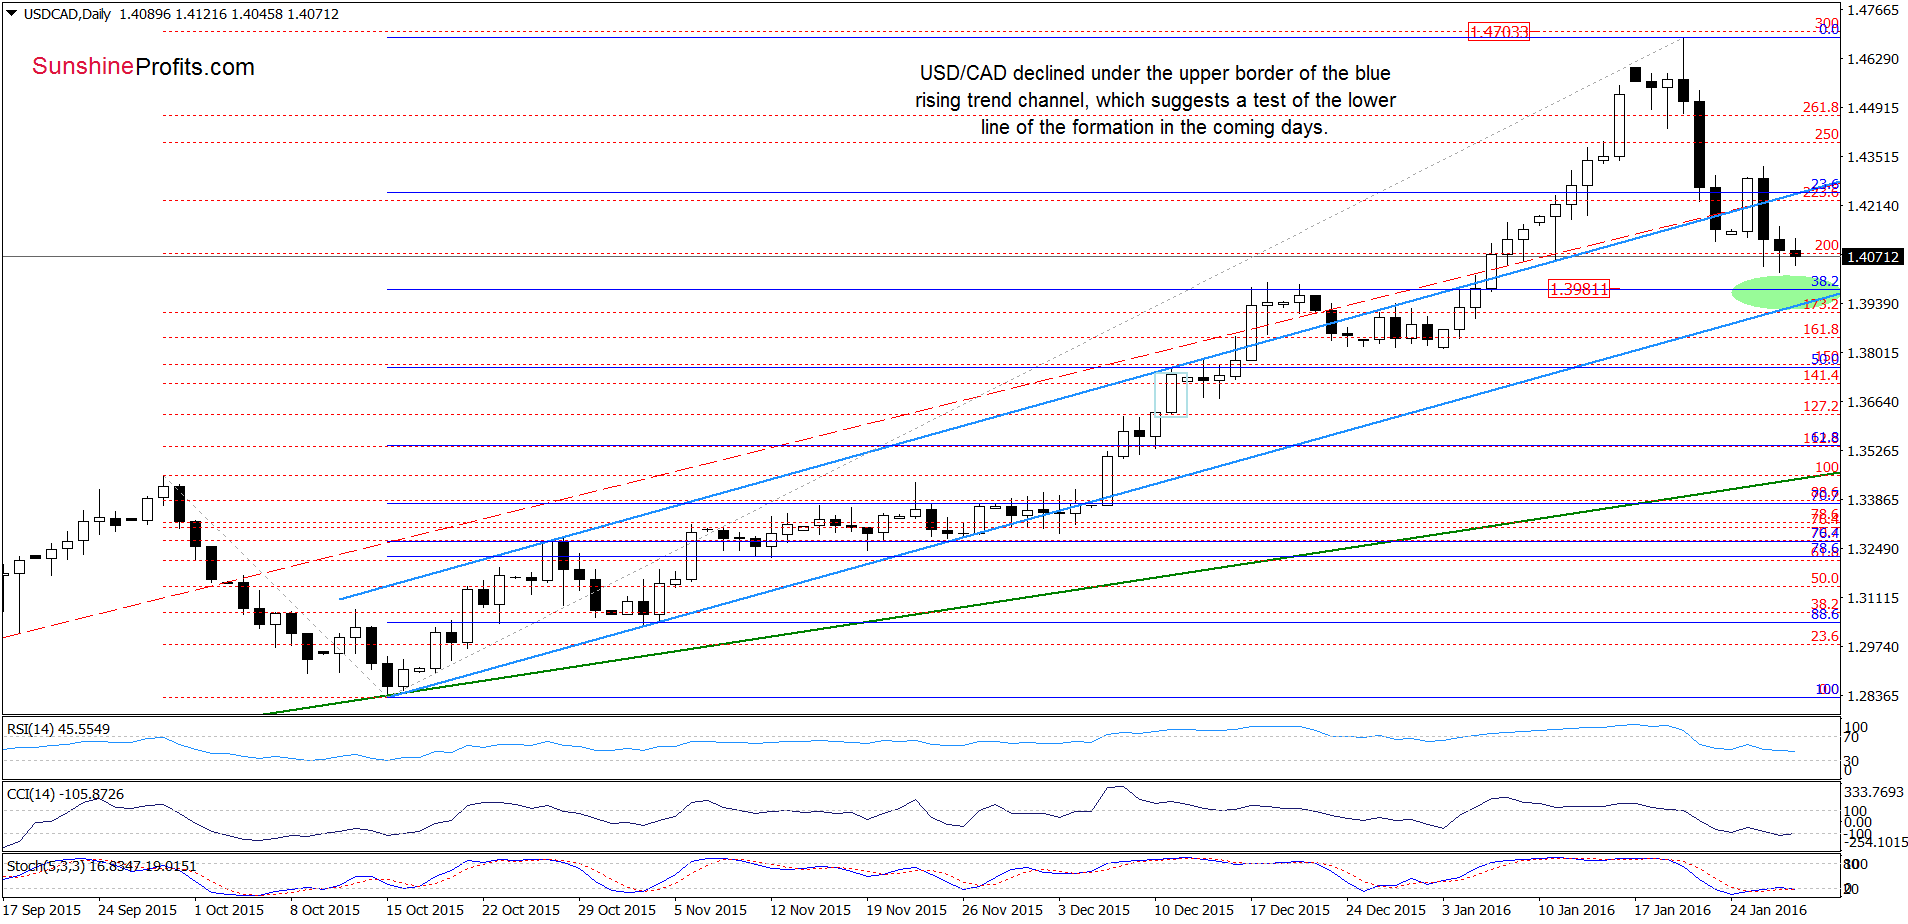
(…) the proximity to the 38.2% Fibonacci retracement (based on the recent decline) triggered a pullback earlier today, which will likely translate into a drop to the blue support line later in the day. (…) if currency bears manage to push the exchange rate below it, the next downside target would be around 1.4000, where the Dec highs and the 38.2% Fibonacci retracement (based on the Oct-Jan rally) are.
On the daily chart, we see that USD/CAD broke below the blue line and moved sharply lower, which means that our downside target would be in play in the coming day(s). At this point, it is worth noting that if it is broken, we’ll see a test of the lower border of the blue rising trend channel.
Very short-term outlook: mixed with bearish bias
Short-term outlook: mixed
MT outlook: mixed
LT outlook: mixed
Trading position (short-term; our opinion): No positions are justified from the risk/reward perspective at the moment. We will keep you informed should anything change, or should we see a confirmation/invalidation of the above.
AUD/USD
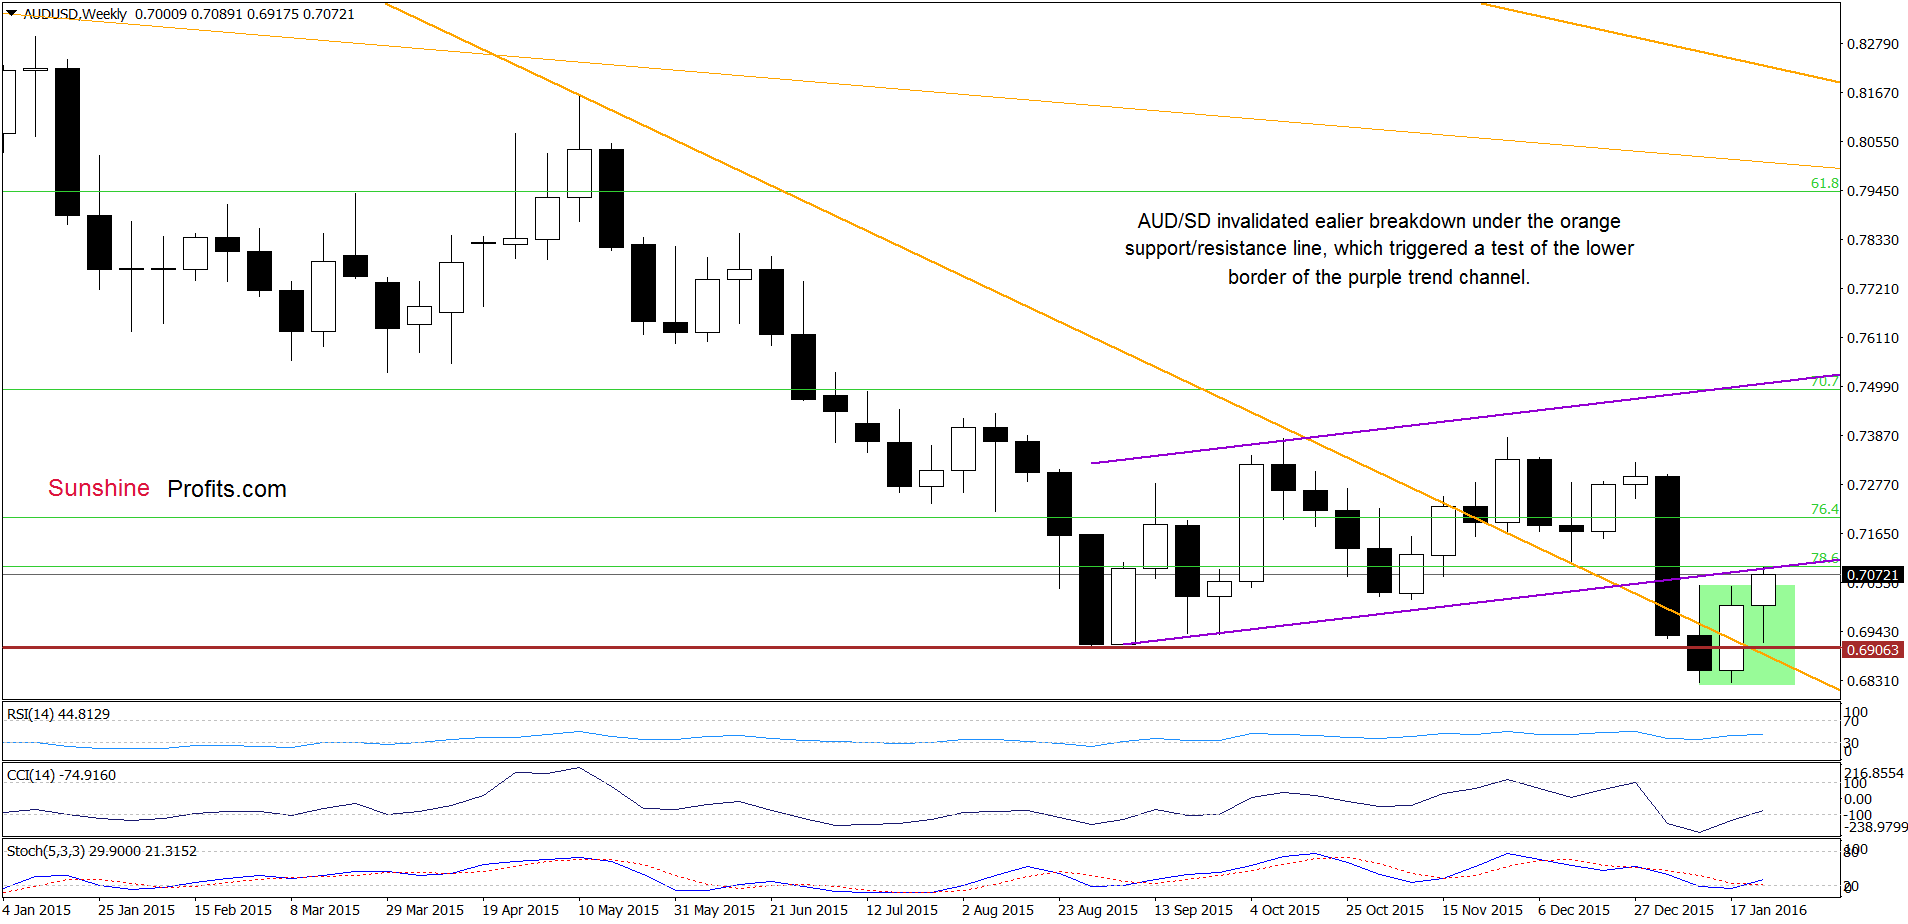
Quoting our last commentary on this currency pair:
(…) the 38.2% Fibonacci retracement (based on the Dec-Jan declines) triggered a pullback to the previously-broken purple horizontal line and the upper border of the blue declining trend channel. As you see on the chart, the exchange rate bounced off this support area earlier today, which looks like a verification of the Thursday’s breakout. If this is the case, and the pair extends gains from here, we may see an increase to around 0.7090, where the size of the upward move will correspond to the high of the double bottom formation (marked with yellow) and where the 50% Fibonacci retracement (based on the Dec-Jan declines) is.
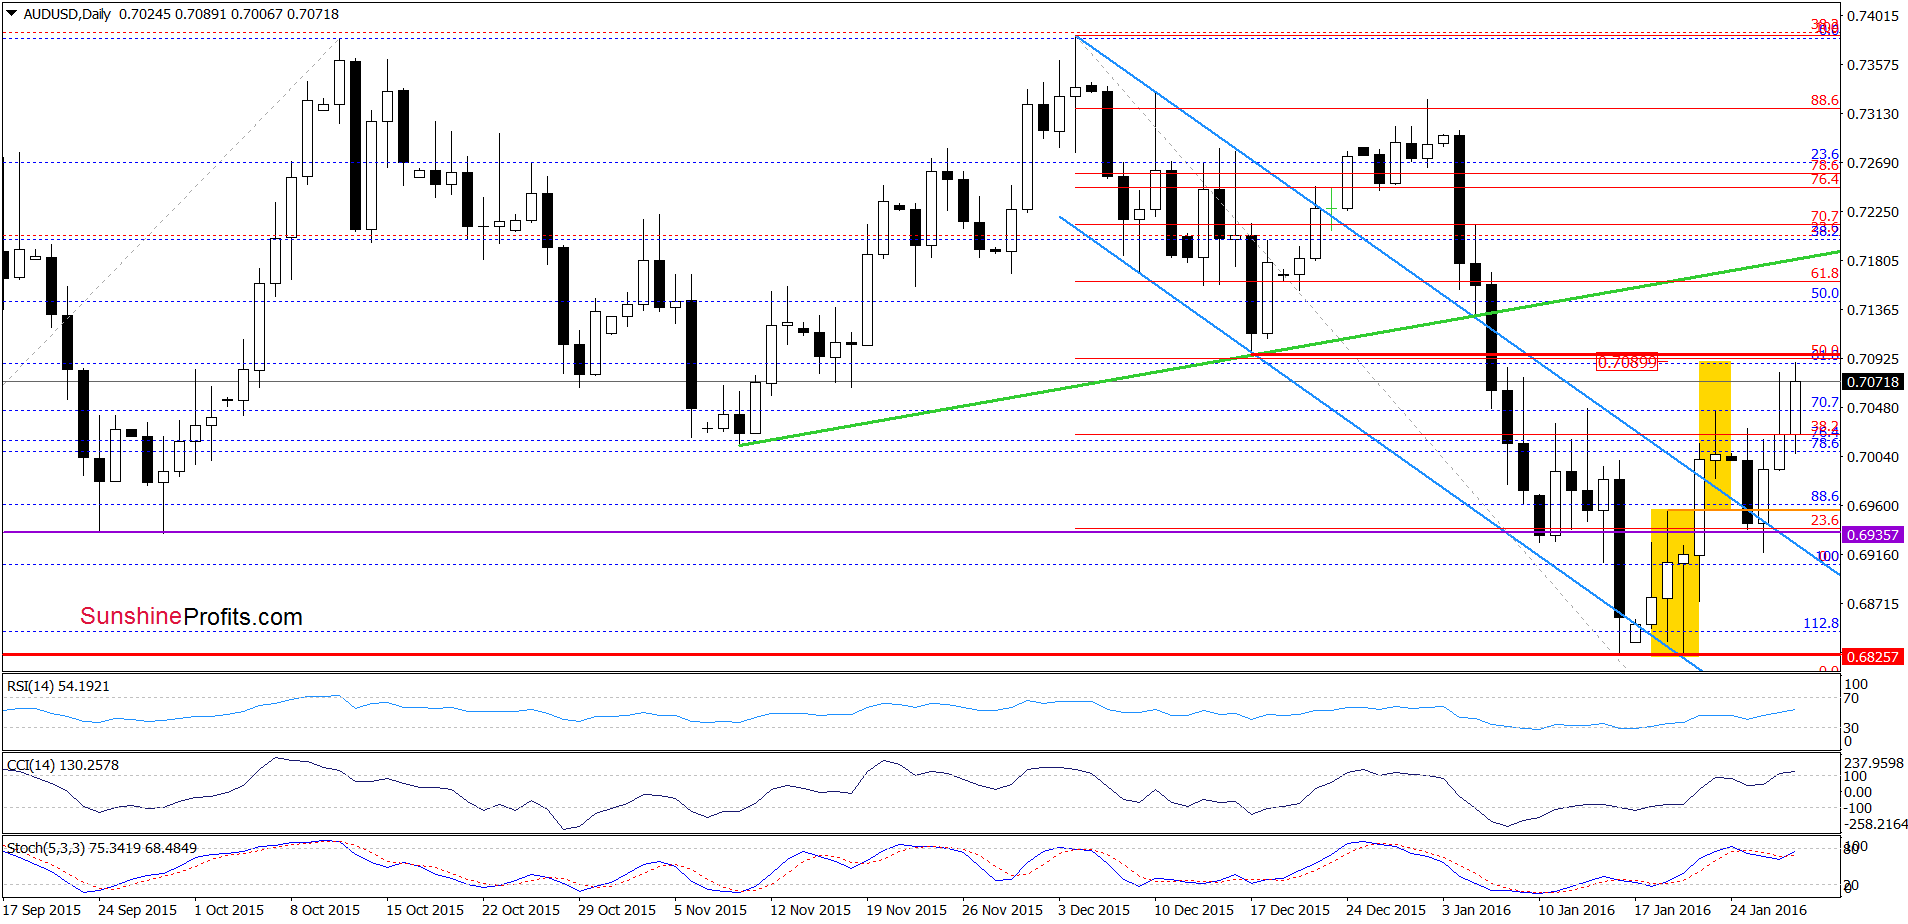
As you see on the daily chart, the situation developed in line with the above scenario and AUD/USD reached our upside target earlier today. With this upward move, the pair also climbed to the mid-Dec low and the previously-broken lower border of the purple rising trend channel, which suggests that we may see a pullback from here in the coming day(s). If we see such price action, the pair will decline to the purple horizontal line and the upper border of the blue declining trend channel once again. Nevertheless, if currency bulls manage to push the pair higher, the next upside target would be the 61.8% Fibonacci retracement and the green line based on the Nov and Dec lows.
Very short-term outlook: mixed
Short-term outlook: mixed
MT outlook: mixed
LT outlook: mixed
Trading position (short-term; our opinion): No positions are justified from the risk/reward perspective. We will keep you informed should anything change, or should we see a confirmation/invalidation of the above.
Thank you.
Nadia Simmons
Forex & Oil Trading Strategist
Przemyslaw Radomski, CFA
Founder, Editor-in-chief
Gold & Silver Trading Alerts
Forex Trading Alerts
Oil Investment Updates
Oil Trading Alerts

