

Yesterday’s data showed that U.S. consumer prices dropped in the previous month. Additionally, U.S. housing starts and building permits declined, pushing the USD Index below 99. Thanks to this drop, EUR/USD climbed above the long-term resistance line. However, as it turned out, this improvement was only temporary and the pair slipped under this key resistance in the following hours. Does it mean that lower values of the exchange rate are still ahead us?
In our opinion the following forex trading positions are justified - summary:
- EUR/USD: short (stop-loss order at 1.1363; initial downside target at 1.0462)
- GBP/USD: none
- USD/JPY: none
- USD/CAD: none
- USD/CHF: none
- AUD/USD: none
EUR/USD
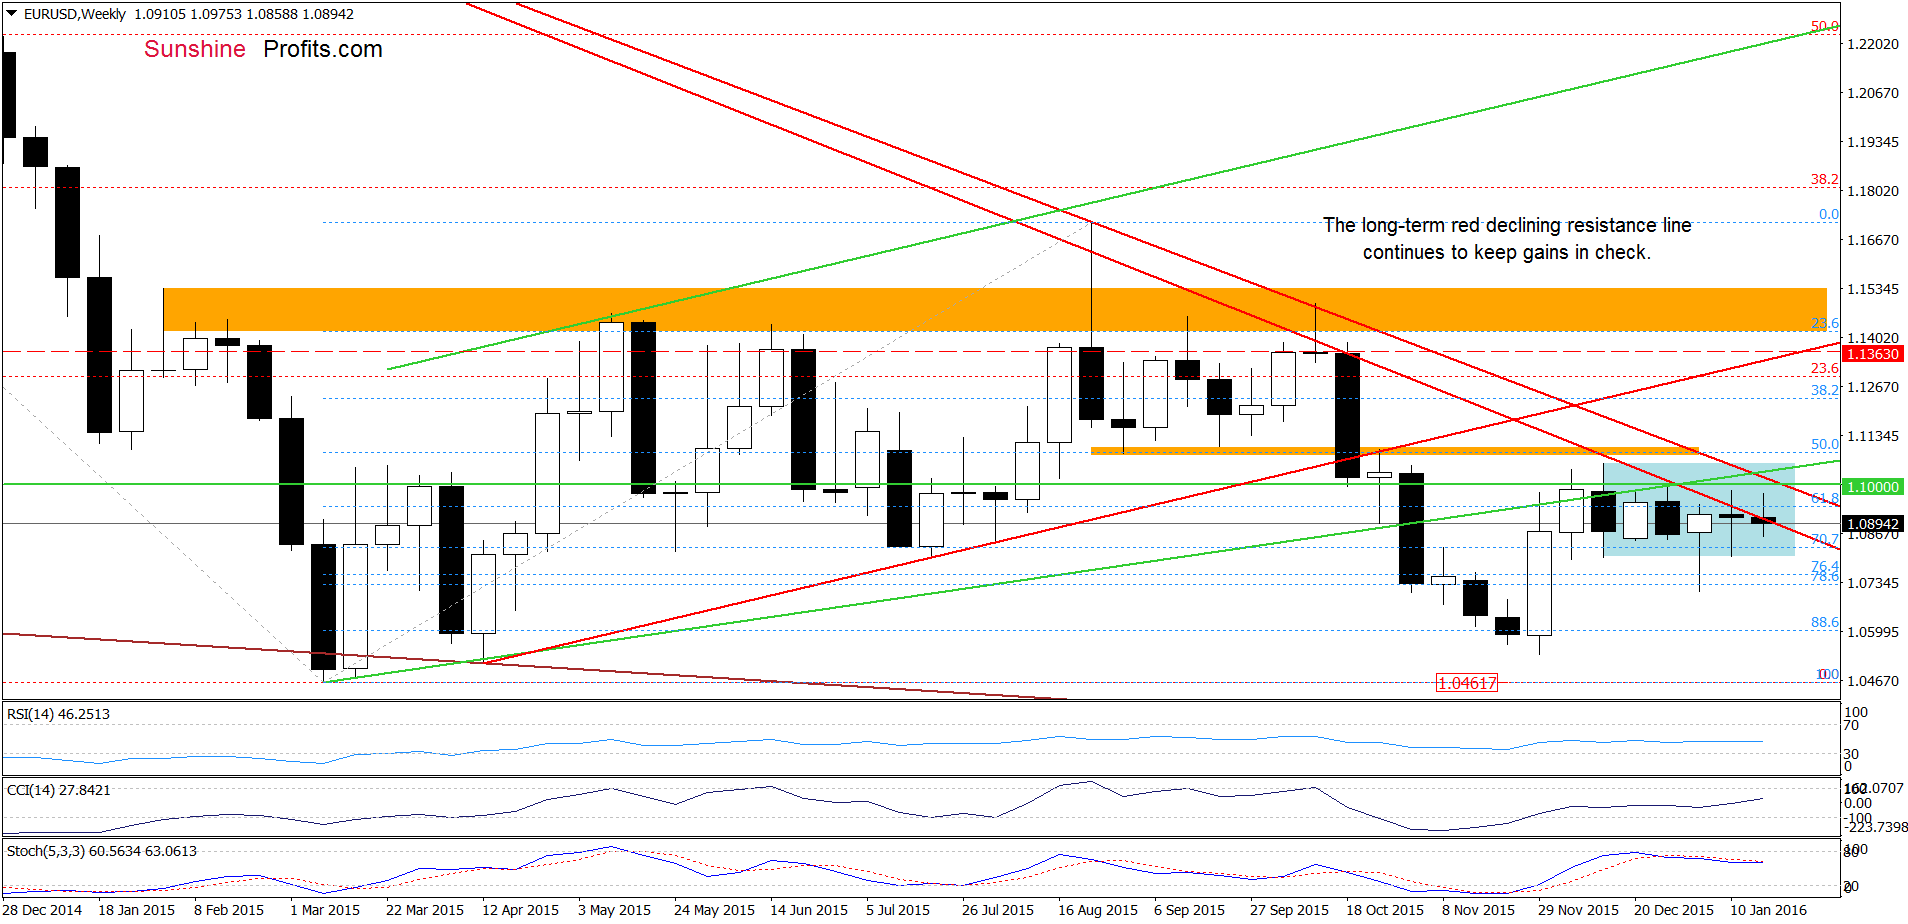
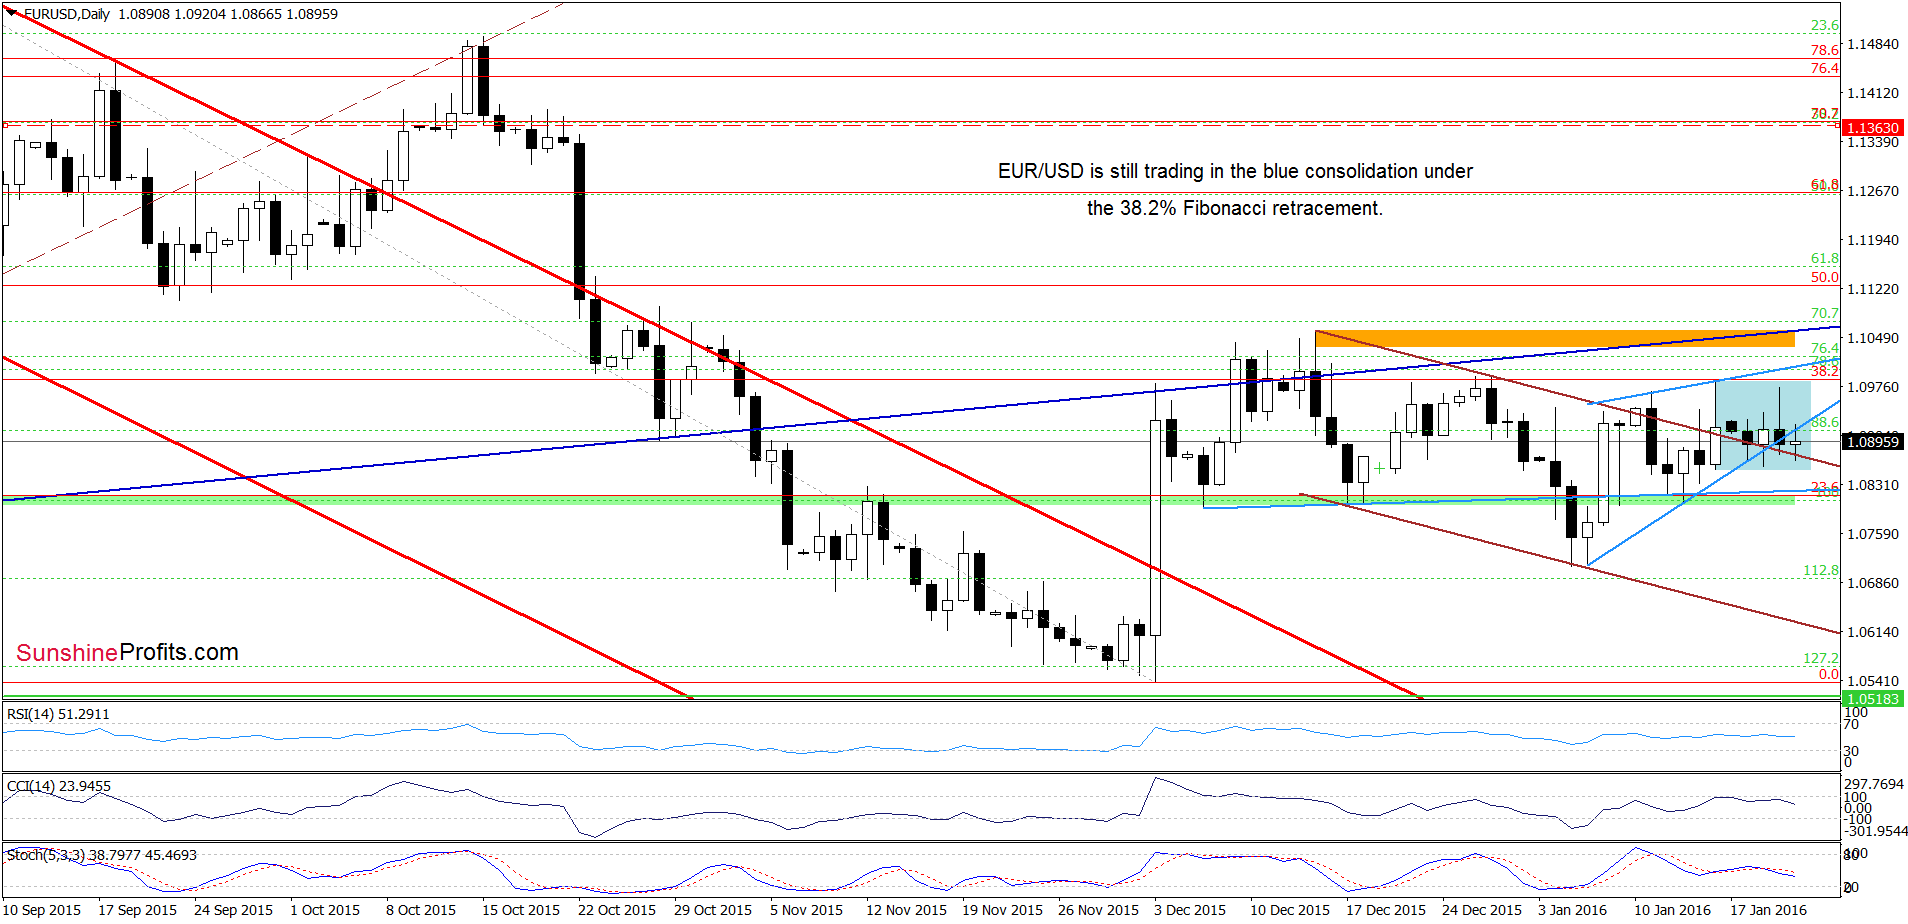
Looking at the charts, we see that the overall situation hasn’t changed much as EUR/USD is still trading in the blue consolidation under the 38.2% Fibonacci retracement and the long-term red declining resistance line. Therefore, what we wrote yesterday remains up-to-date also today:
(...) although currency bulls pushed EUR/USD above the long-term red declining resistance line, this improvement was only temporary and the pair erased earlier gains.
(…) What does it mean for the exchange rate? When we take a closer look at the weekly chart, we can notice see that there were similar situations in Aug and Oct. Back then, an invalidation of earlier breakout above the long-term red line was the first bearish signal before bigger decline. Taking this fact into account, we think that history will repeat itself once again and we’ll see another downward move in the coming week(s).
How did this move affect the very short-term picture? (…) the combination of the 38.2% Fibonacci retracement and the late Dec highs stopped further improvement – similarly to what we saw on Friday. Therefore, it seems that the pair will extend losses and we’ll see another attempt to break below the previously-broken upper border of the brown declining trend channel. If we see such price action, the initial downside target would be the green support zone.
Very short-term outlook: bearish
Short-term outlook: bearish
MT outlook: bearish
LT outlook: mixed
Trading position (short-term; our opinion): Short positions (with a stop-loss order at 1.1363 and the initial downside target at 1.0462) are justified from the risk/reward perspective. We will keep you informed should anything change, or should we see a confirmation/invalidation of the above.
GBP/USD

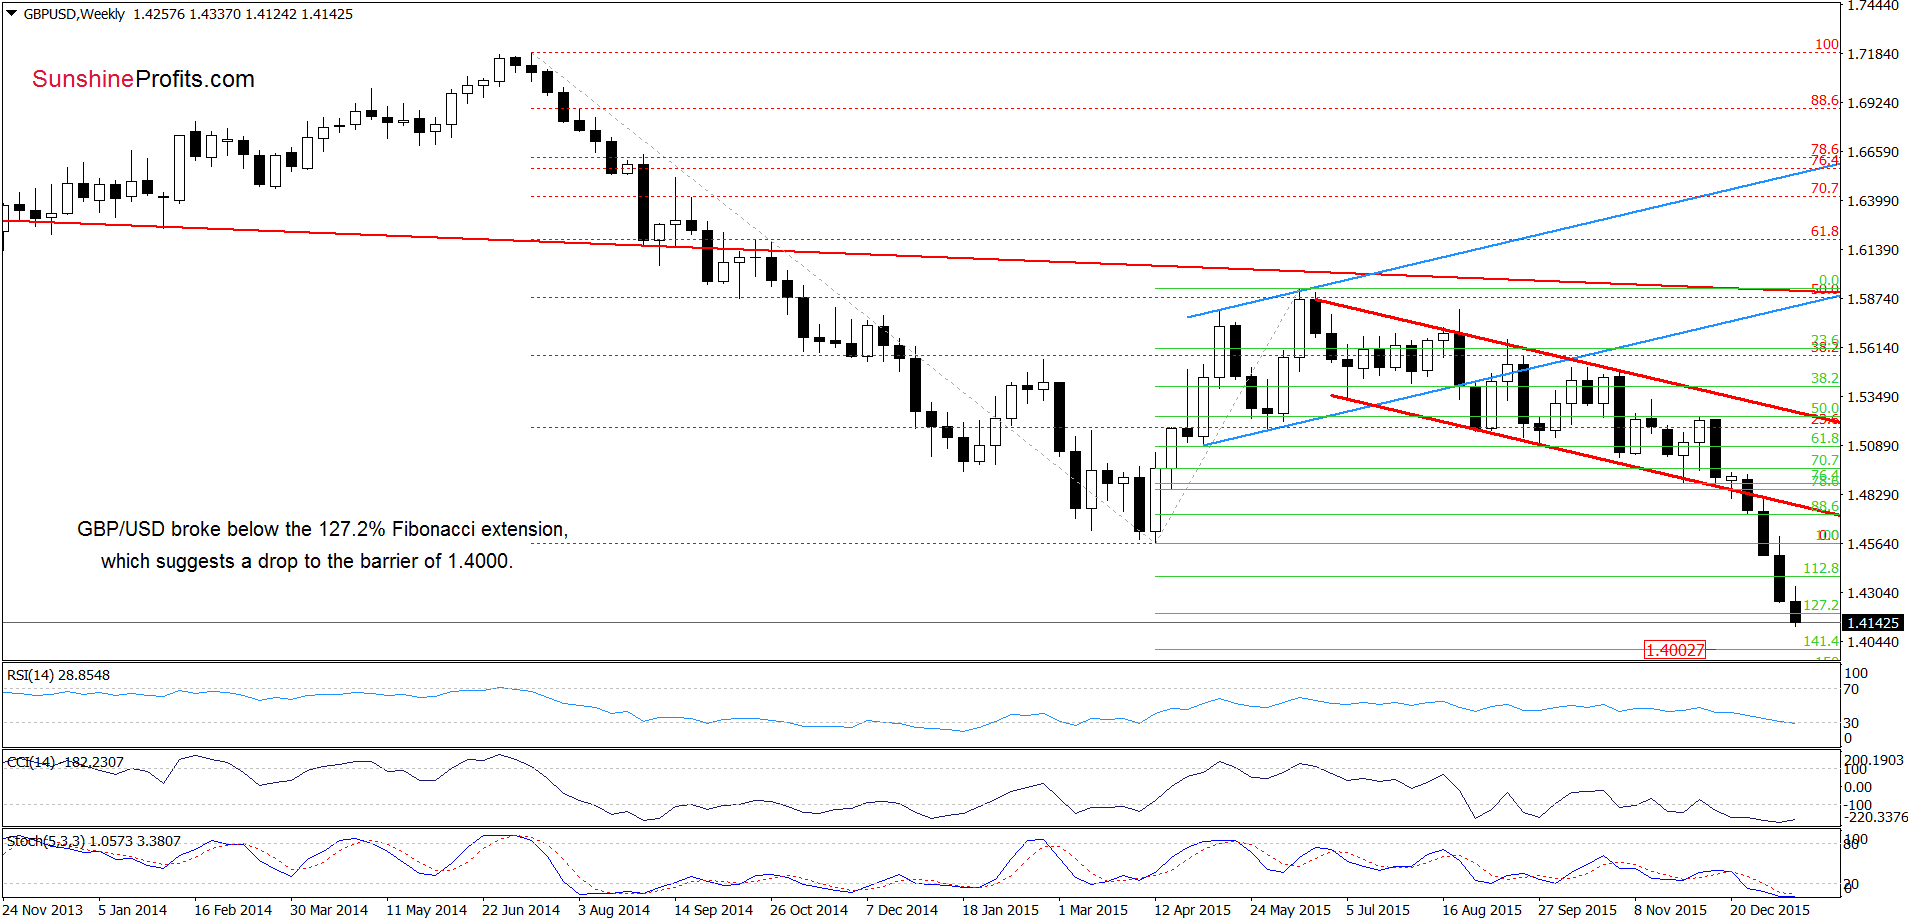
The situation in the long- and medium-term has deteriorated as GBP/USD broke below the May 2010 low and the 127.2% Fibonacci extension. This suggests that the pair will test the barrier of 1.4000 in the coming week (please note that this area is currently reinforced by the 141.4% Fibonacci extension at 1.4002). At this point it is worth noting that if this important support is broken, the next downside target would be the 88.6% Fibonacci retracement (based on the 2009-2014) around 1.3927.
Very short-term outlook: bearish
Short-term outlook: bearish
MT outlook: mixed with bearish bias
LT outlook: mixed with bearish bias
Trading position (short-term; our opinion): No positions are justified from the risk/reward perspective at the moment. We will keep you informed should anything change, or should we see a confirmation/invalidation of the above.
USD/CHF
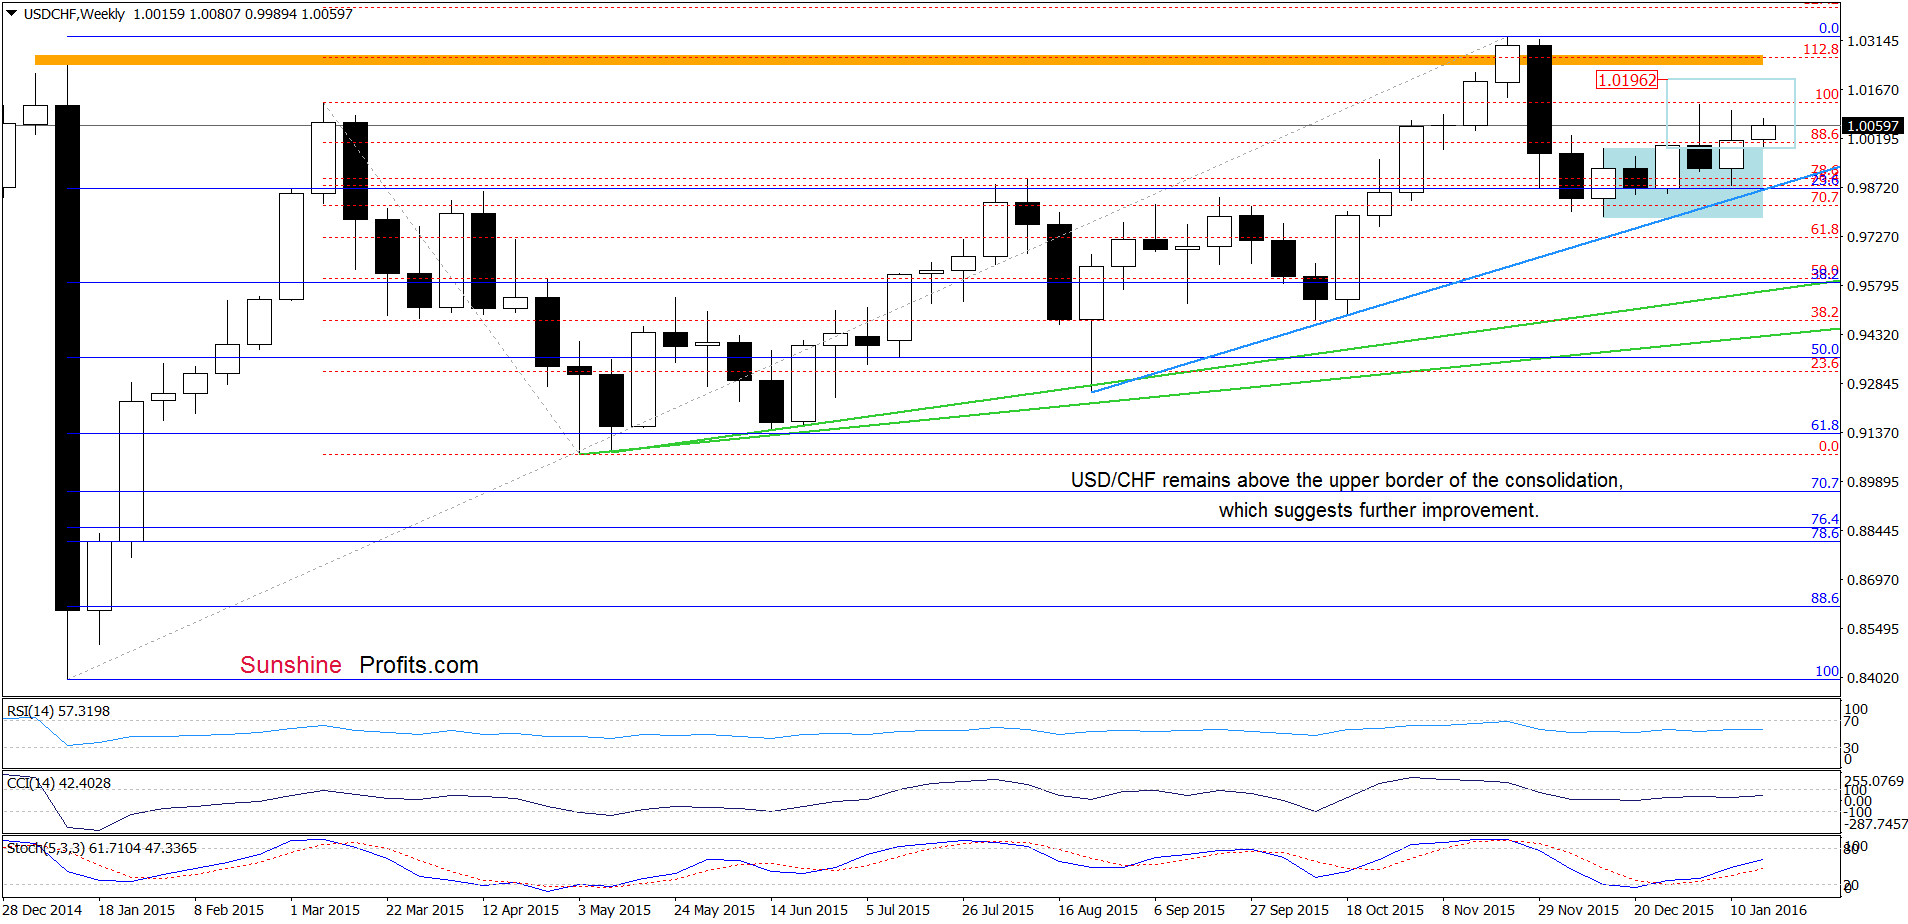
From the medium-term perspective, we see that USD/CHF climbed above the upper border of the blue consolidation once again, which in combination with buy signal generated by the Stochastic Oscillator suggests further improvement and an increase to around 1.0196, where the size of the upward move will correspond to the height of the formation.
Are there any short-term factors that could hinder the realization of the above scenario? Let’s examine the daily chart and find out.
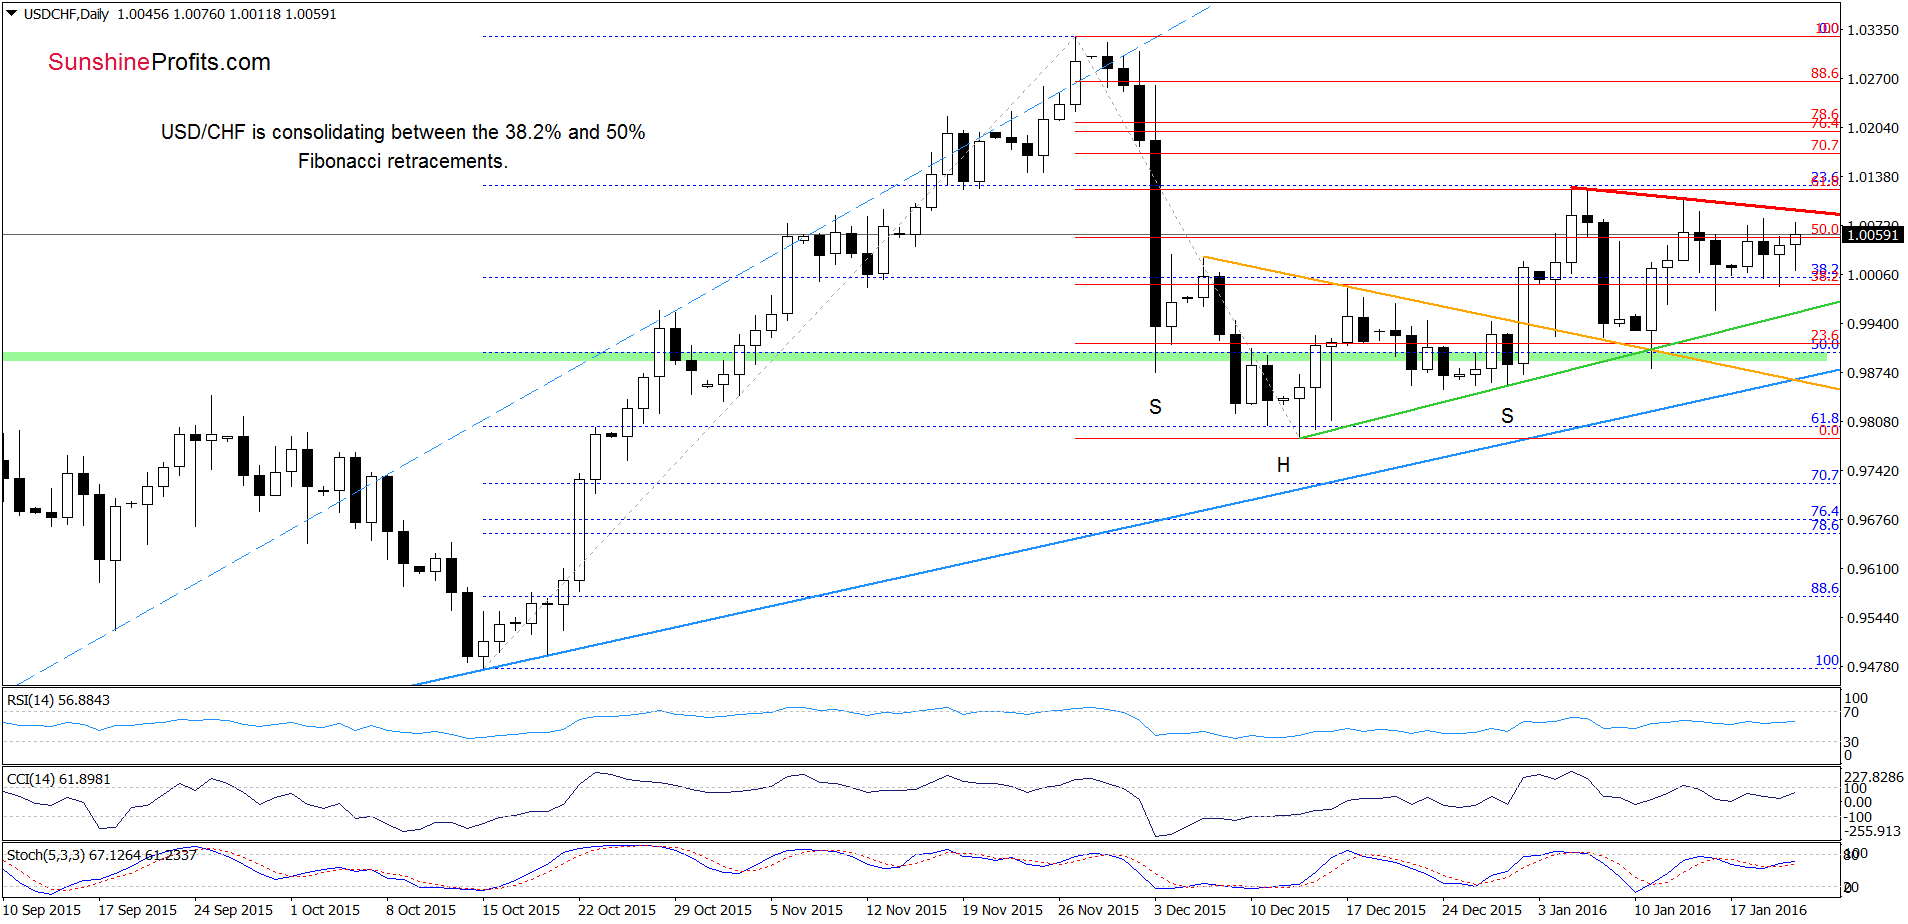
On the daily chart, we see that USD/CHF is consolidating between the 38.2% and 50% Fibonacci retracement levels, which suggests that as long as there is no breakout above the red declining resistance line (based on the previous highs) further improvement is not likely to be seen. Nevertheless, the current position of the indictors (buy signals remain in place) suggests that currency bulls will try to push the pair higher once again.
Very short-term outlook: mixed with bullish bias
Short-term outlook: mixed with bullish bias
MT outlook: mixed
LT outlook: mixed
Trading position (short-term; our opinion): No positions are justified from the risk/reward perspective at the moment. We will keep you informed should anything change, or should we see a confirmation/invalidation of the above.
Thank you.
Nadia Simmons
Forex & Oil Trading Strategist
Przemyslaw Radomski, CFA
Founder, Editor-in-chief
Gold & Silver Trading Alerts
Forex Trading Alerts
Oil Investment Updates
Oil Trading Alerts

