

Although the University of Michigan showed that its consumer sentiment index increased to 93.3 in Jan, this positive reading was overshadowed by other disappointing reports released on Friday. As a reminder, the U.S. Census Bureau reported that retail sales fell 0.1% in Dec, while core retail sales (without automobiles) dropped by 0.1% last month. Additionally, the U.S. producer price index slipped 0.2% in the previous month and U.S. industrial production declined by 0.4%. On top of that, the Federal Reserve of New York showed that its Empire State manufacturing index declined to minus 19.37 this month, well below forecasts. Tanks to these disappointing numbers, the USD Index declined under 99, which pushed the euro above important resistance line. What impact did this drop have on the technical picture of other currency pairs?
In our opinion the following forex trading positions are justified - summary:
- EUR/USD: short (stop-loss order at 1.1363; initial downside target at 1.0462)
- GBP/USD: none
- USD/JPY: none
- USD/CAD: none
- USD/CHF: none
- AUD/USD: none
EUR/USD
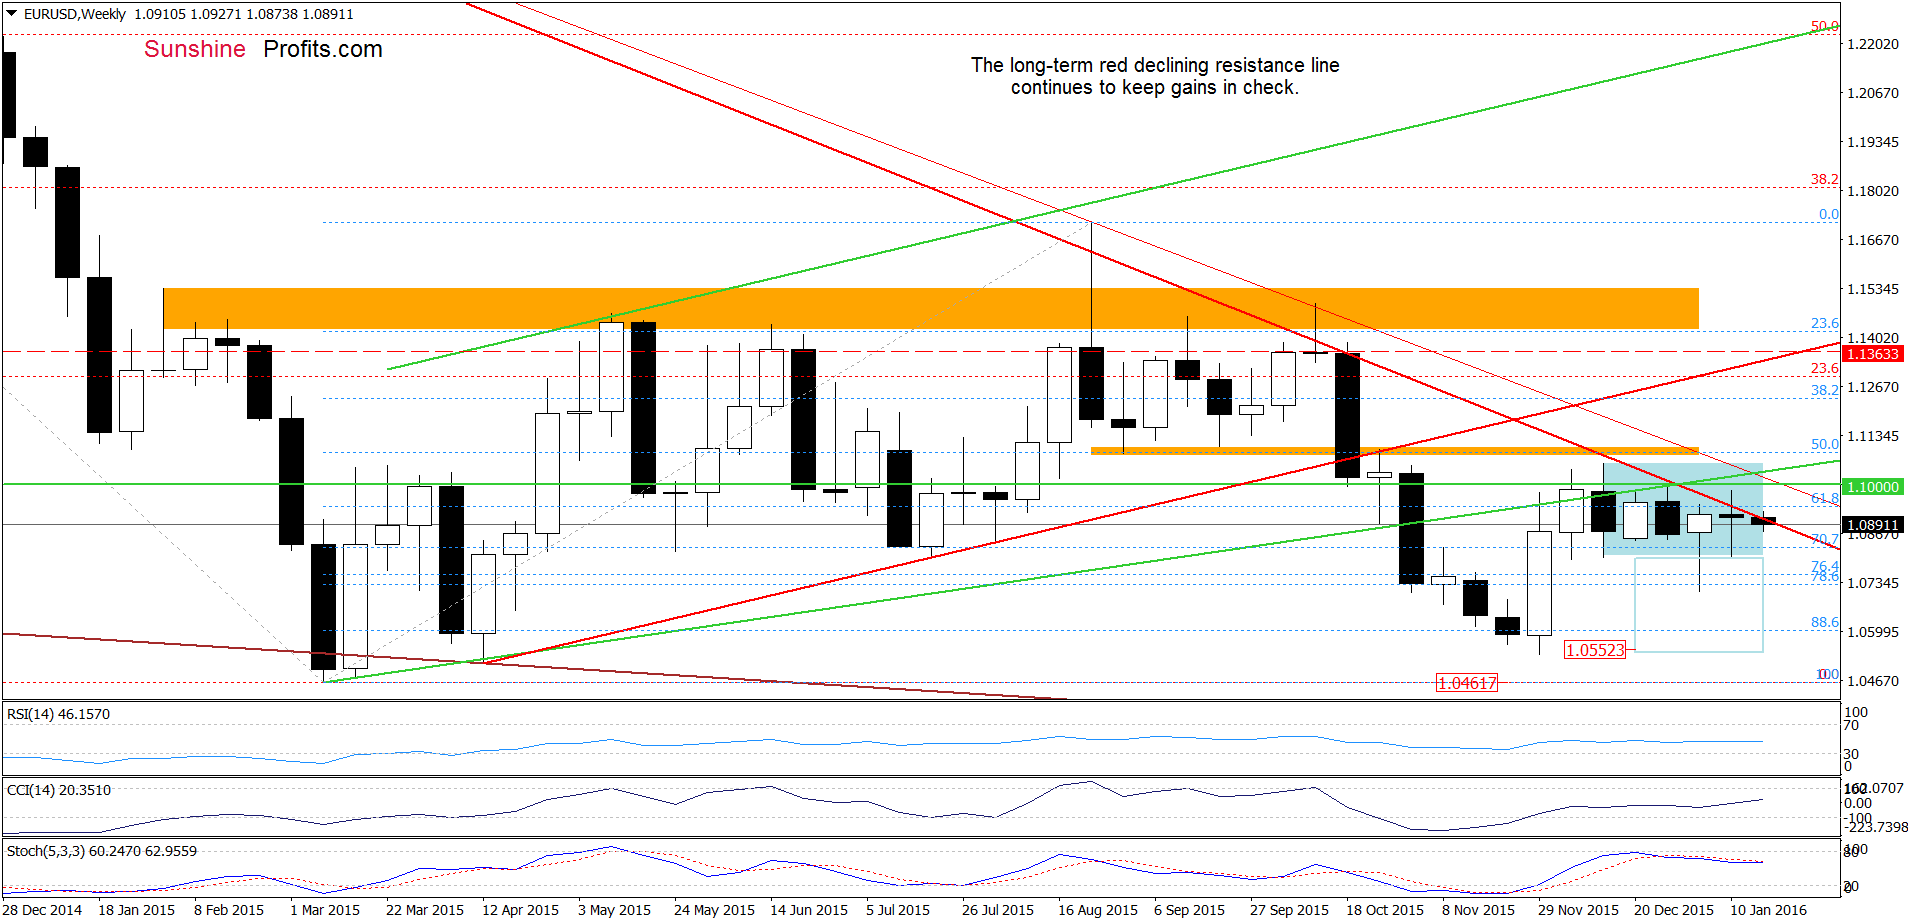
In the previous week, EUR/USD extended gains and climbed above the long-term red declining line. Despite this positive event, currency bulls didn’t manage to hold gained levels, which triggered a pullback that took the pair under this key resistance. What does it mean for the exchange rate? When we take a closer look at the weekly chart, we can notice see that there were similar situations in Aug and Oct. Back then, an invalidation of earlier breakout above the long-term red line was the first bearish signal before bigger decline. Taking this fact into account, we think that history will repeat itself once again and we’ll see another downward move in the coming week(s).
Having said that, let’s examine the daily chart and find out what impact did this drop have on the very short-term picture.
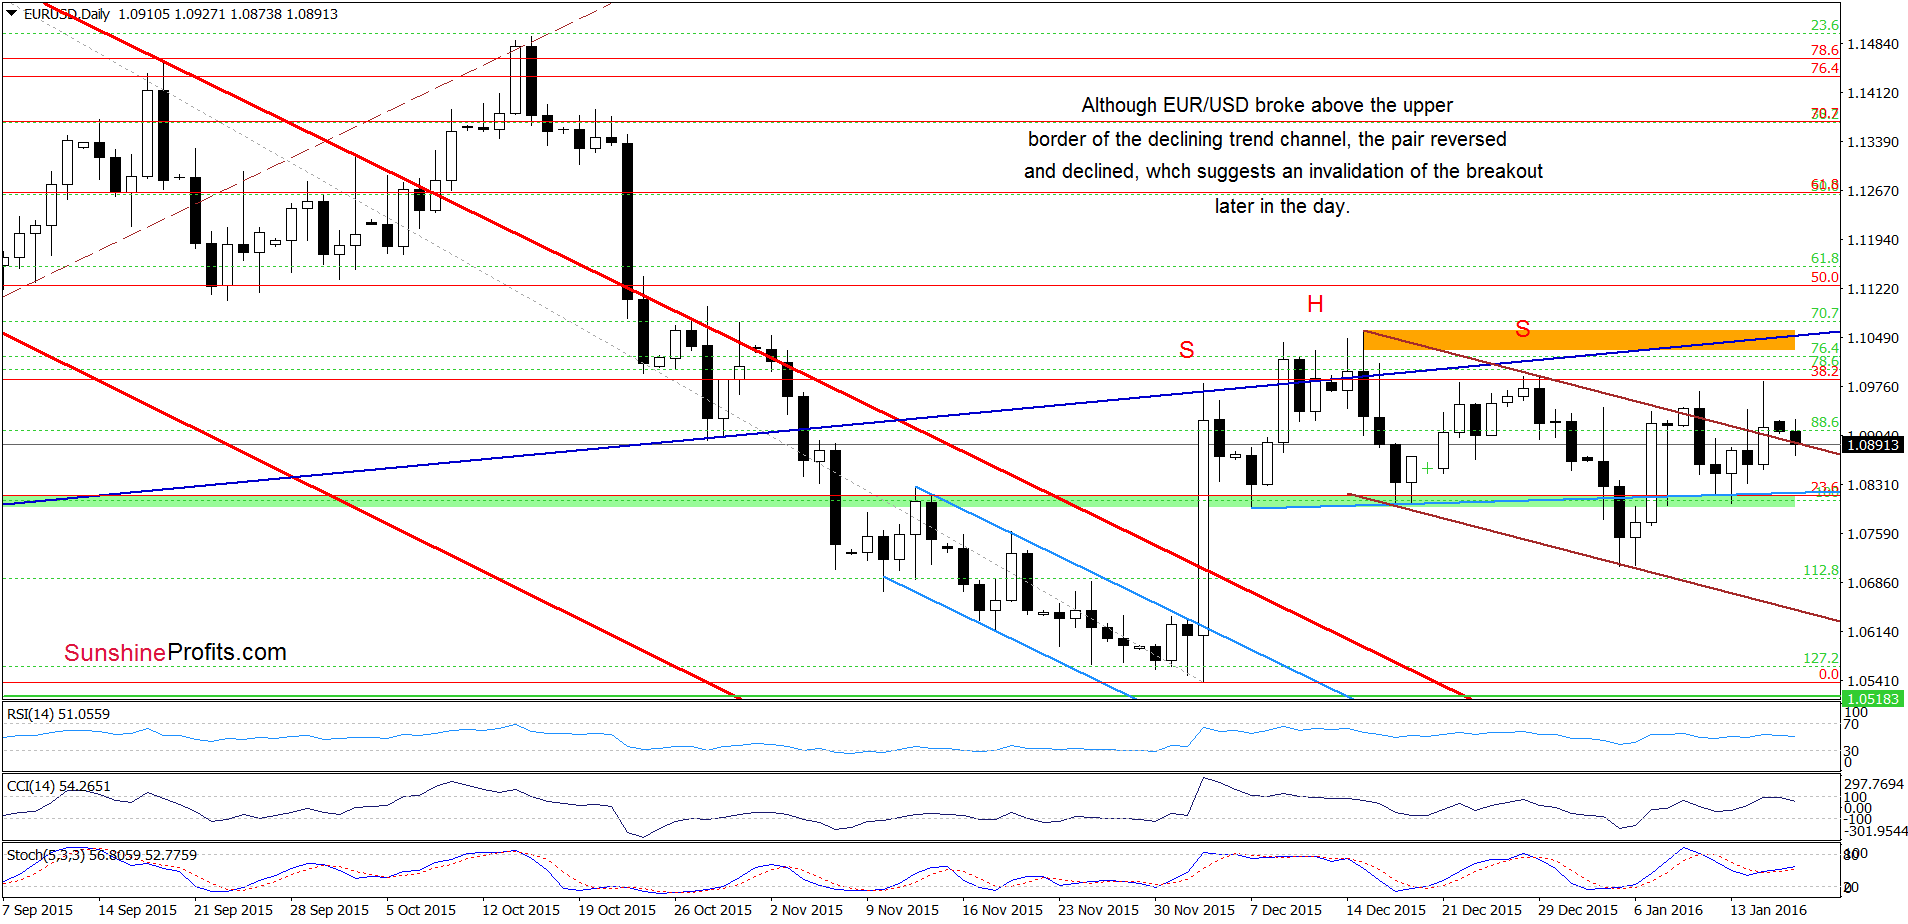
From this perspective, we see that although EUR/USD moved sharply higher on Friday, the 38.2% Fibonacci retracement in combination with the late Dec highs stopped further improvement. As a result, the pair gave up some gains and approached the previously-broken upper border of the brown declining trend channel. Earlier today, currency bears pushed the pair lower, which suggests an invalidation of the breakout in the coming day(s). If we see such price action and the exchange rate closes the day under this line, it would be a bearish signal, which will trigger another test of the green support zone.
Very short-term outlook: bearish
Short-term outlook: bearish
MT outlook: bearish
LT outlook: mixed
Trading position (short-term; our opinion): Short positions (with a stop-loss order at 1.1363 and the initial downside target at 1.0462) are justified from the risk/reward perspective. We will keep you informed should anything change, or should we see a confirmation/invalidation of the above.
GBP/USD
On Tuesday, we wrote the following:
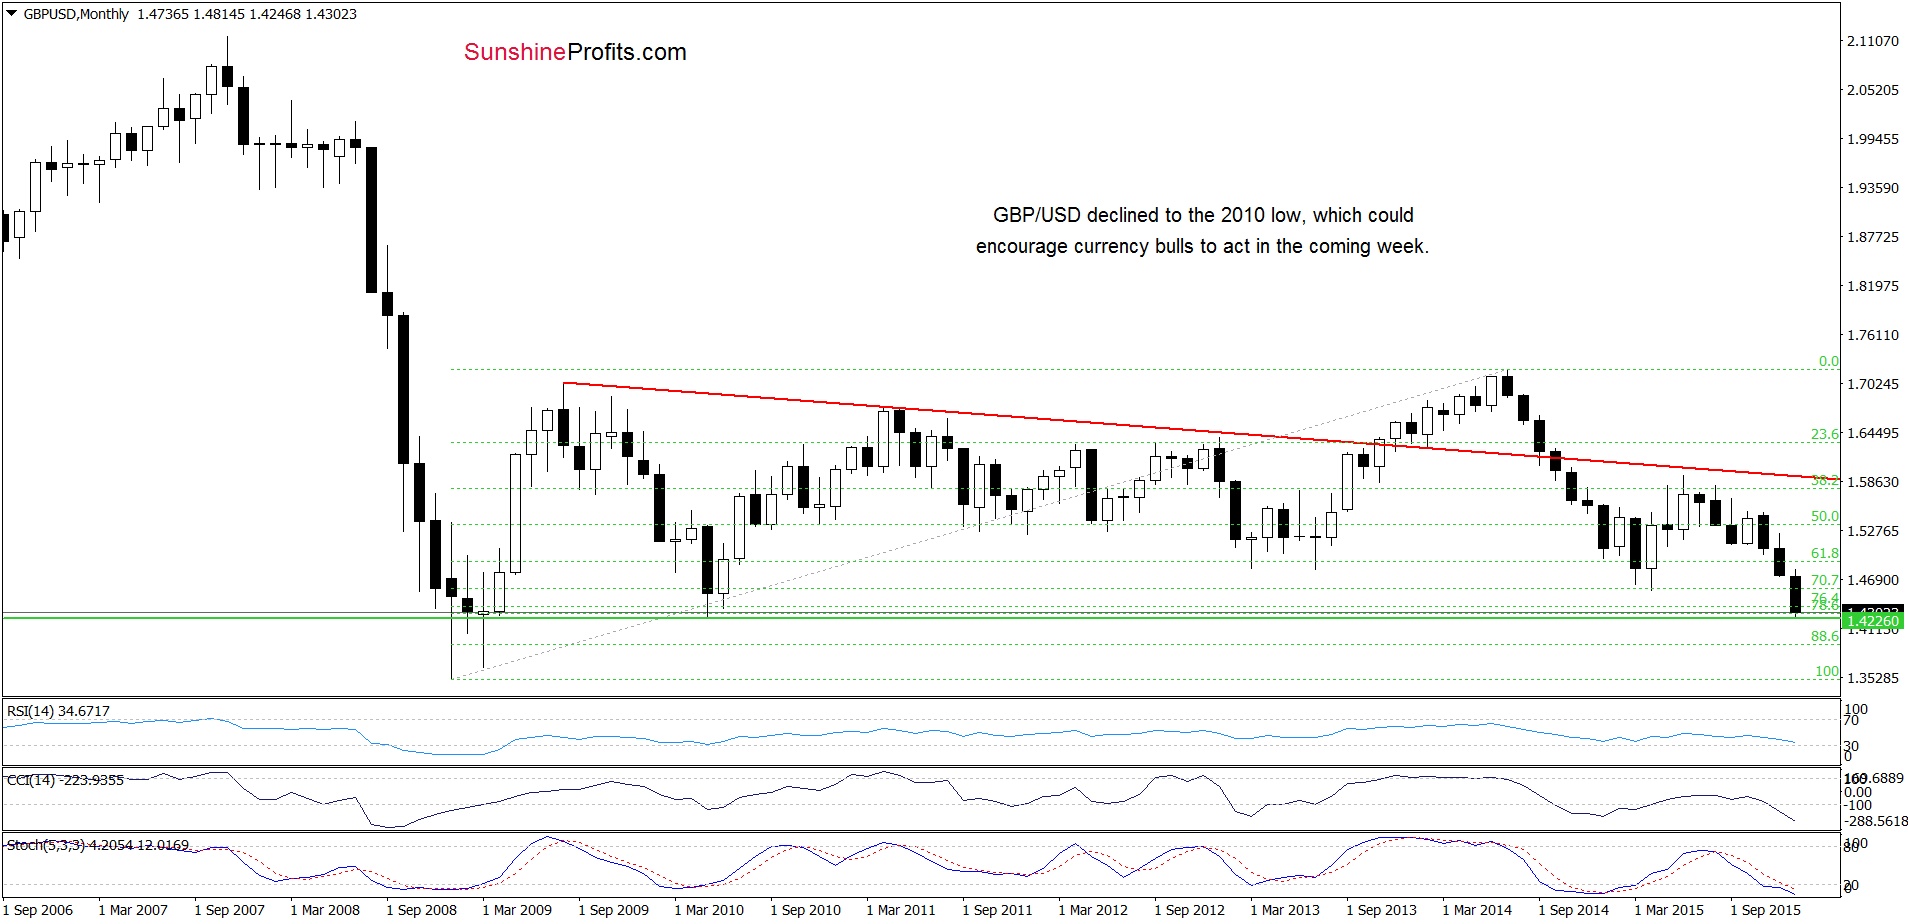
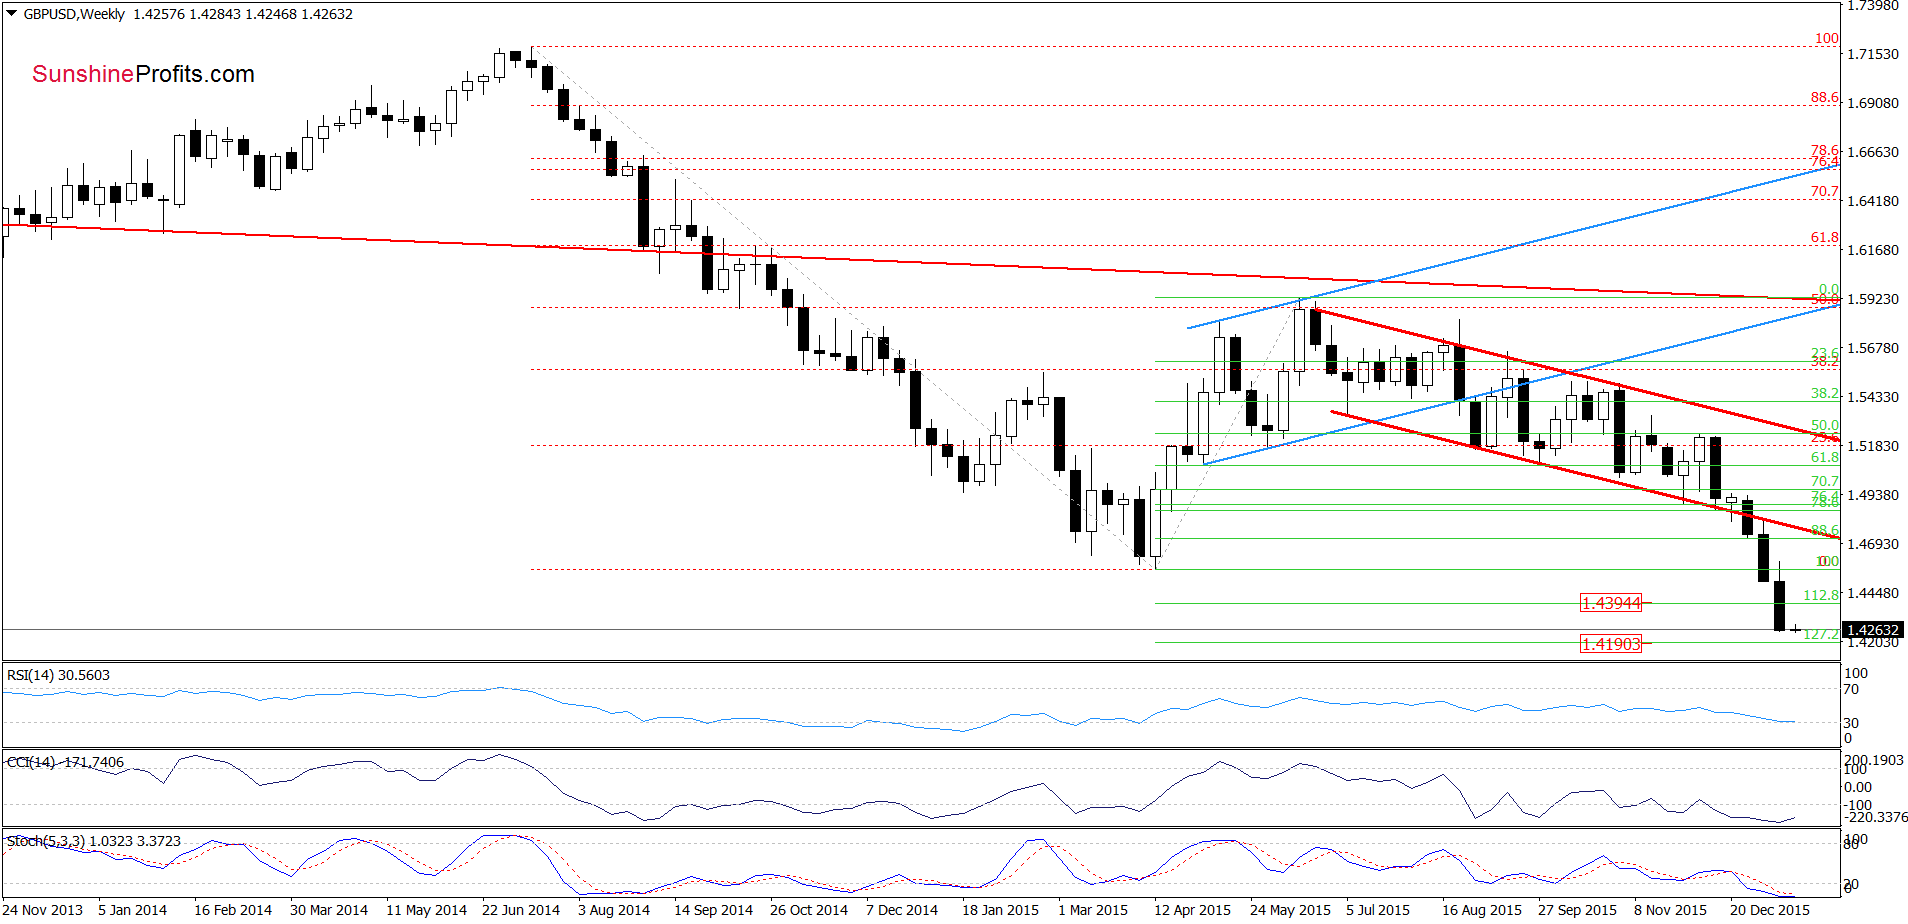
(…) GBP/USD (…) could drop to around 1.4190-1.4296, where the nearest support levels are.
Looking at the above charts, we see that the situation developed in line with the above scenario and the exchange rate reached our downside target. With this downward move, the pair approached the May 2010 low of 1.4226, which suggests that we may see a rebound from here in the coming week – especially when we factor in the current position of the weekly indicators. At this point, it is worth noting that even if the pair moves little lower from here, the next support level (the 127.2% Fibonacci extension around 1.4195) is quite close.
Very short-term outlook: mixed
Short-term outlook: mixed
MT outlook: mixed
LT outlook: mixed
Trading position (short-term; our opinion): No positions are justified from the risk/reward perspective at the moment. We will keep you informed should anything change, or should we see a confirmation/invalidation of the above.
USD/JPY
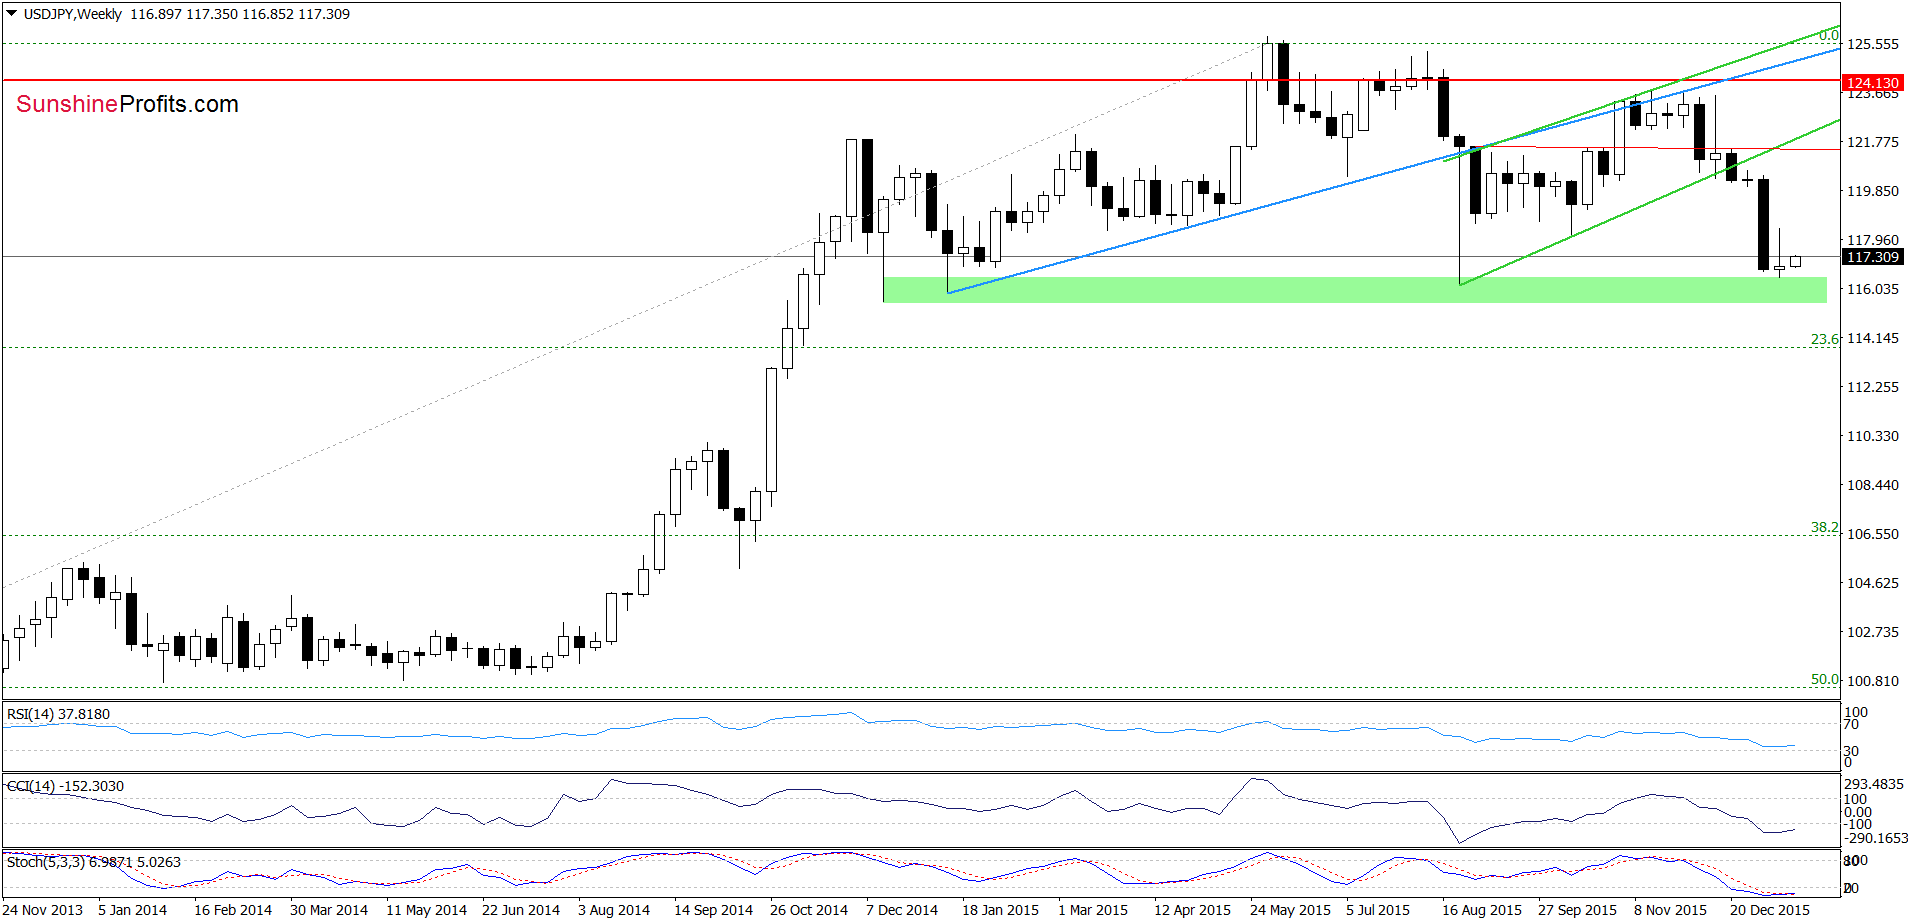
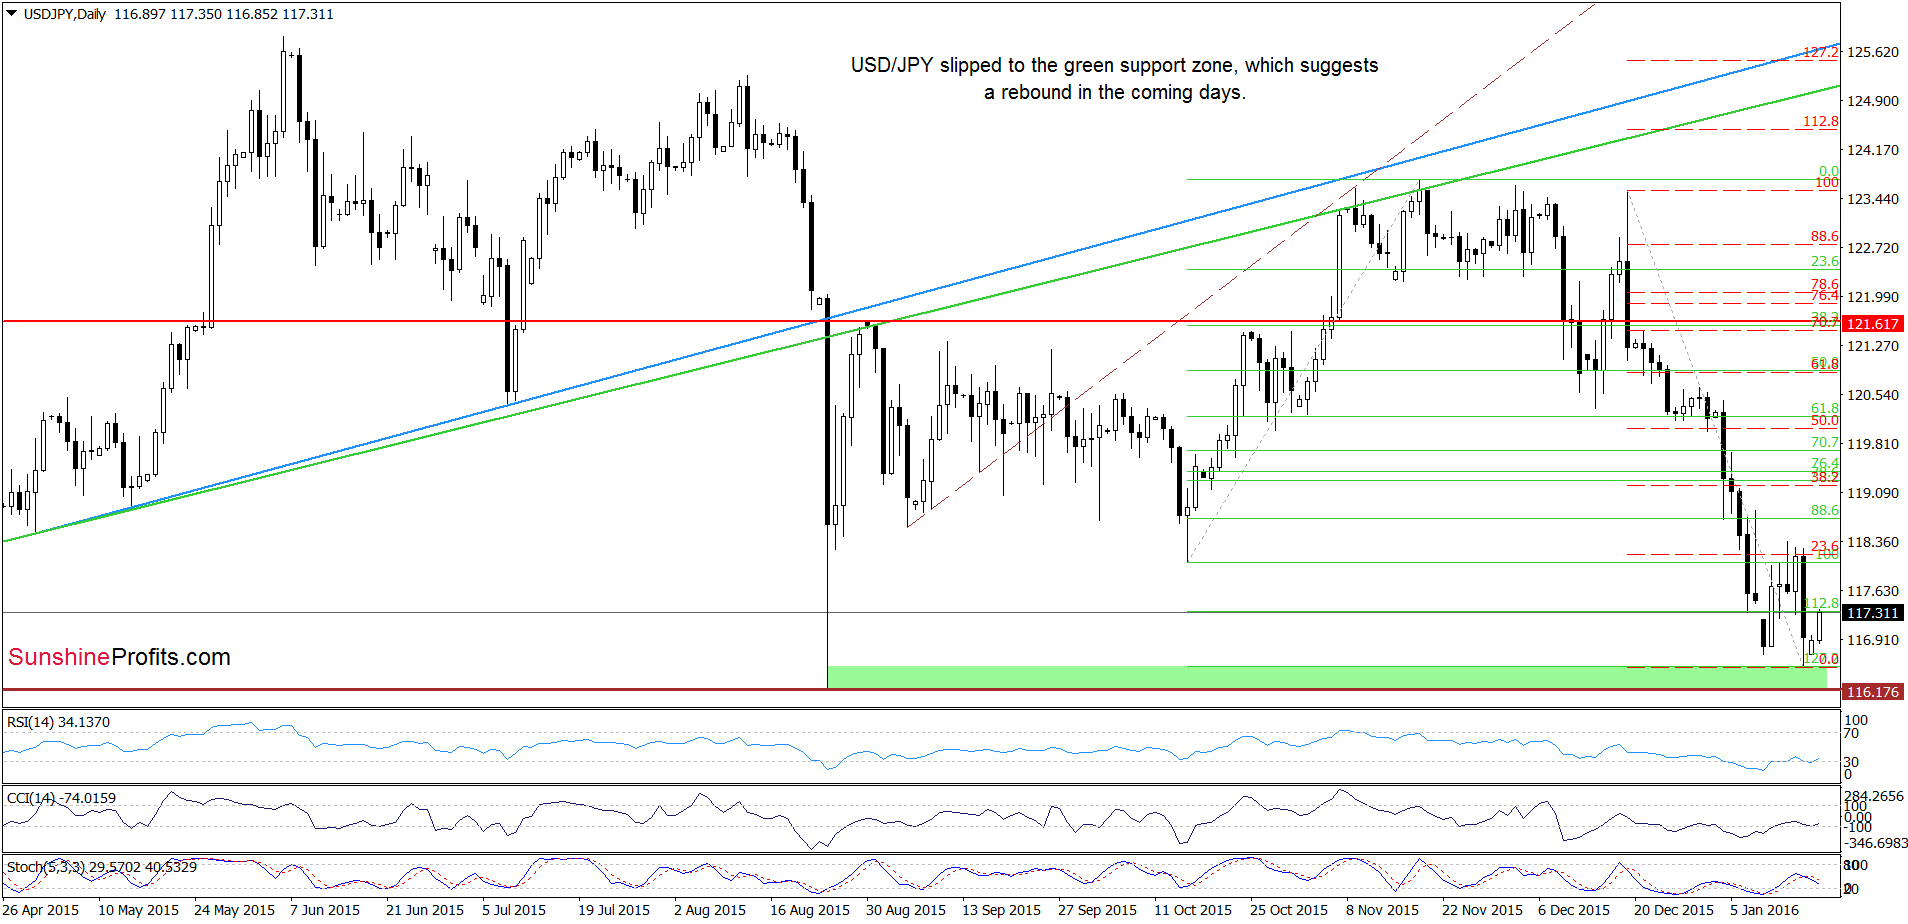
On the above charts, we see that USD/JPY extended losses and hit a fresh multi-month low. With this downswing, the pair reched the green support zone (created by the 127.2% Fibonacci extension and the Aug low), which suggests a rebound from here in the coming days. If we see such price action, the initial upside target would be around 118.18-118.36, where the recent highs and the 23.6% Fibonacci retracement (based on the Dec-Jan declines) are.
Very short-term outlook: mixed
Short-term outlook: mixed
MT outlook: mixed
LT outlook: mixed
Trading position (short-term; our opinion): No positions are justified from the risk/reward perspective at the moment. We will keep you informed should anything change, or should we see a confirmation/invalidation of the above.
USD/CAD
In our Forex Trading Alert posted on Jan 13, we wrote:
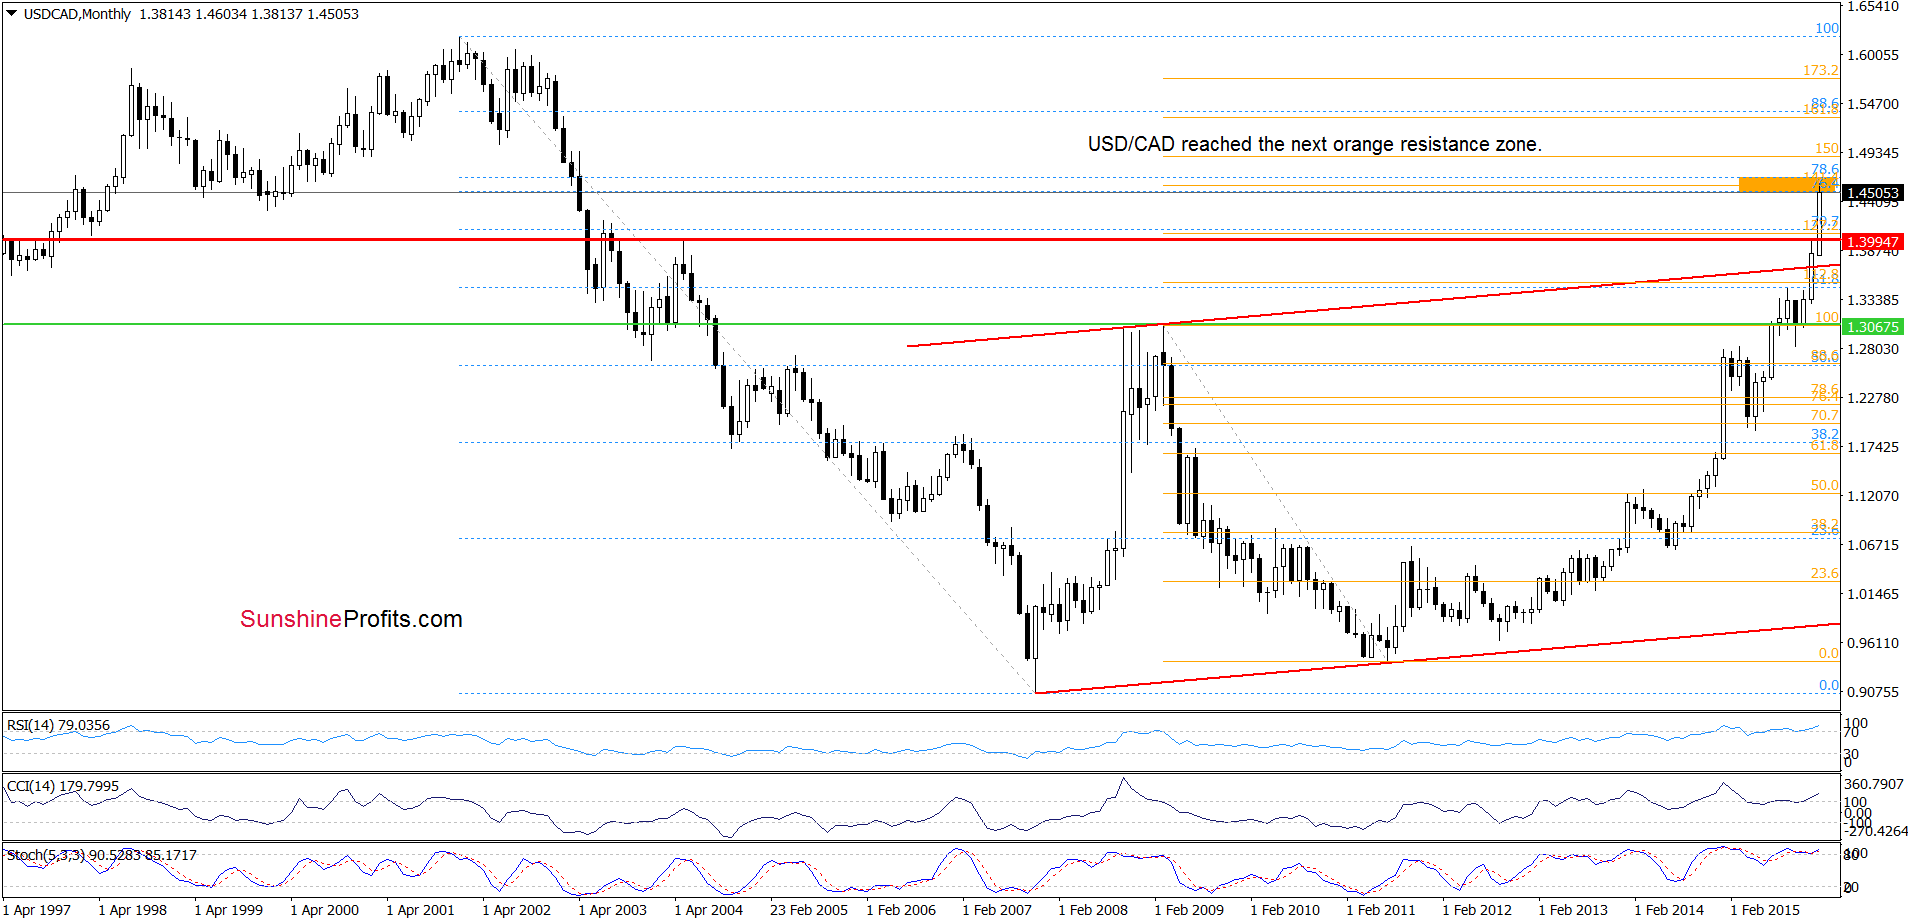
The first thing that catches the eye on the above chart is a breakout above the orange resistance zone, which is a positive signal that suggests further improvement and an increase to around 1.4509-1.4658, where the next resistance area is.
Looking at the above chart, we see that currency bulls pushed the exchange to our upside target. As you see, this resistance area triggered a small pullback. What impact did it have on the very short-term picture? Let’s check.
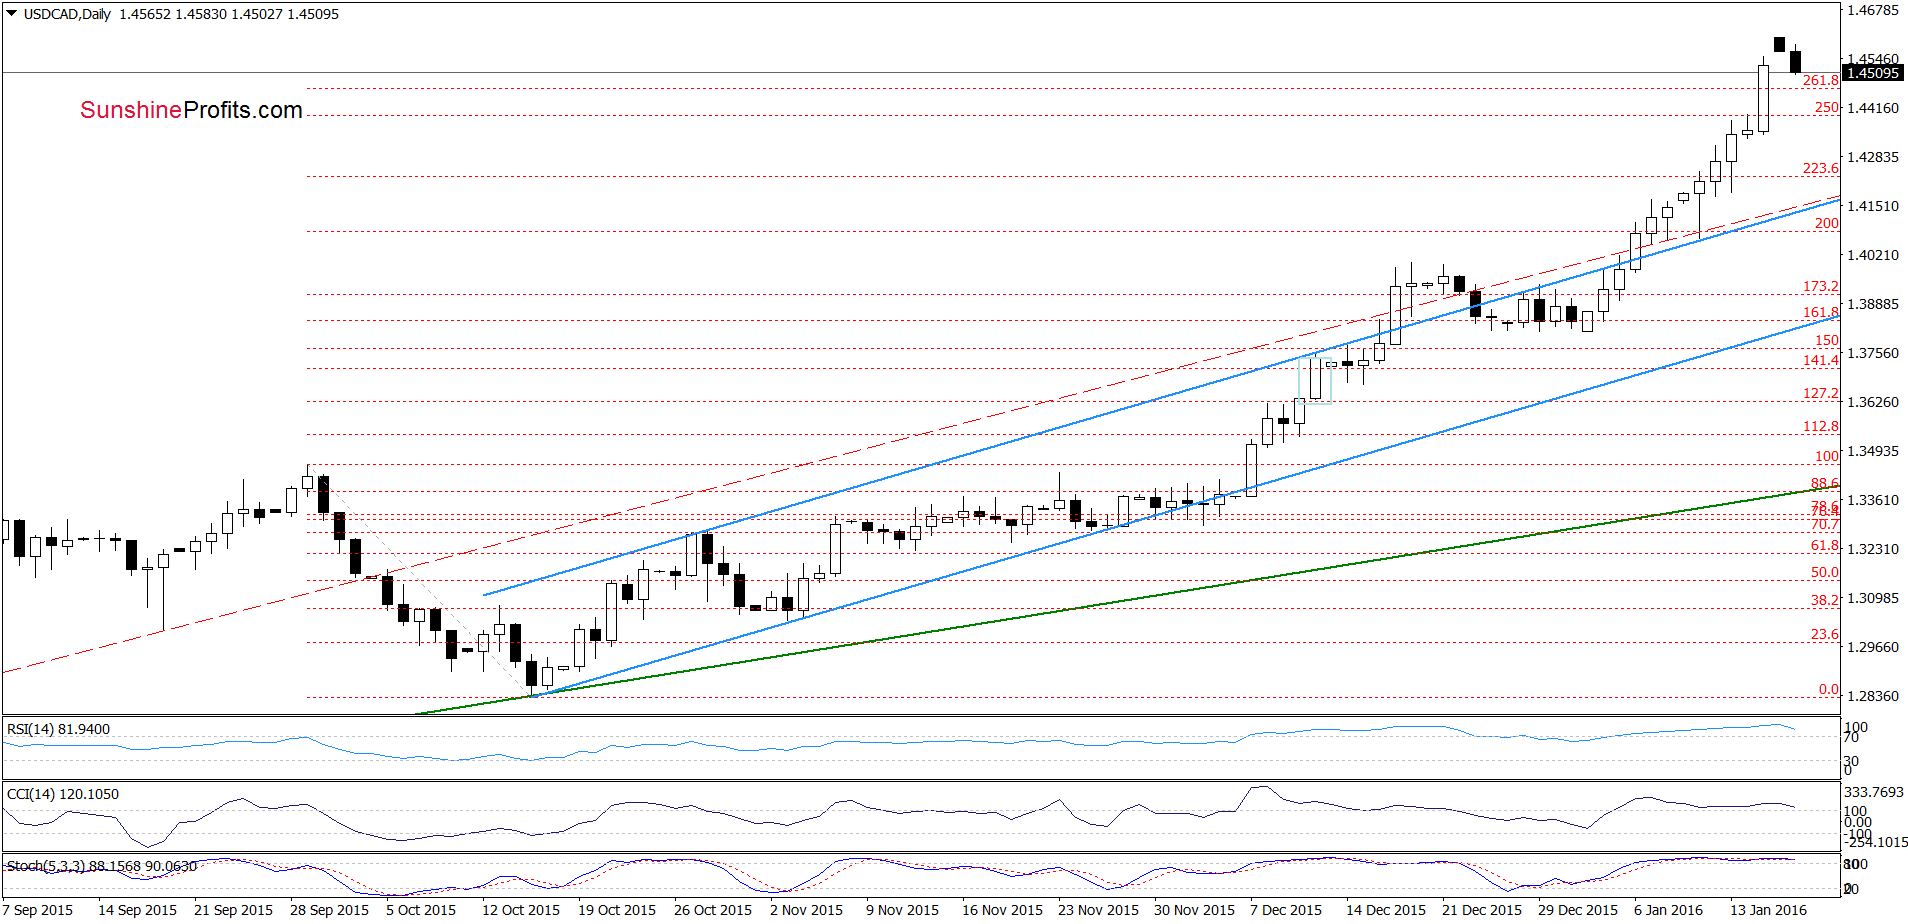
On the daily chart, we see that the recent upward move took USD/CAD above the 261.8% Fibonacci extension. Earlier today, the pair gave up some gains, which in combination with the current position of the indicators (they are very close to generating sell signals) and the log-term picture suggests that correction of the recent rally is just around the corner. If this is the case, and the pair declines from here, the initial downside target would be around1.4300, where the 38.2% Fibonacci retracement (based on the Jan upward move) is.
Very short-term outlook: mixed with bearish bias
Short-term outlook: mixed
MT outlook: mixed
LT outlook: mixed
Trading position (short-term; our opinion): No positions are justified from the risk/reward perspective at the moment. We will keep you informed should anything change, or should we see a confirmation/invalidation of the above.
USD/CHF
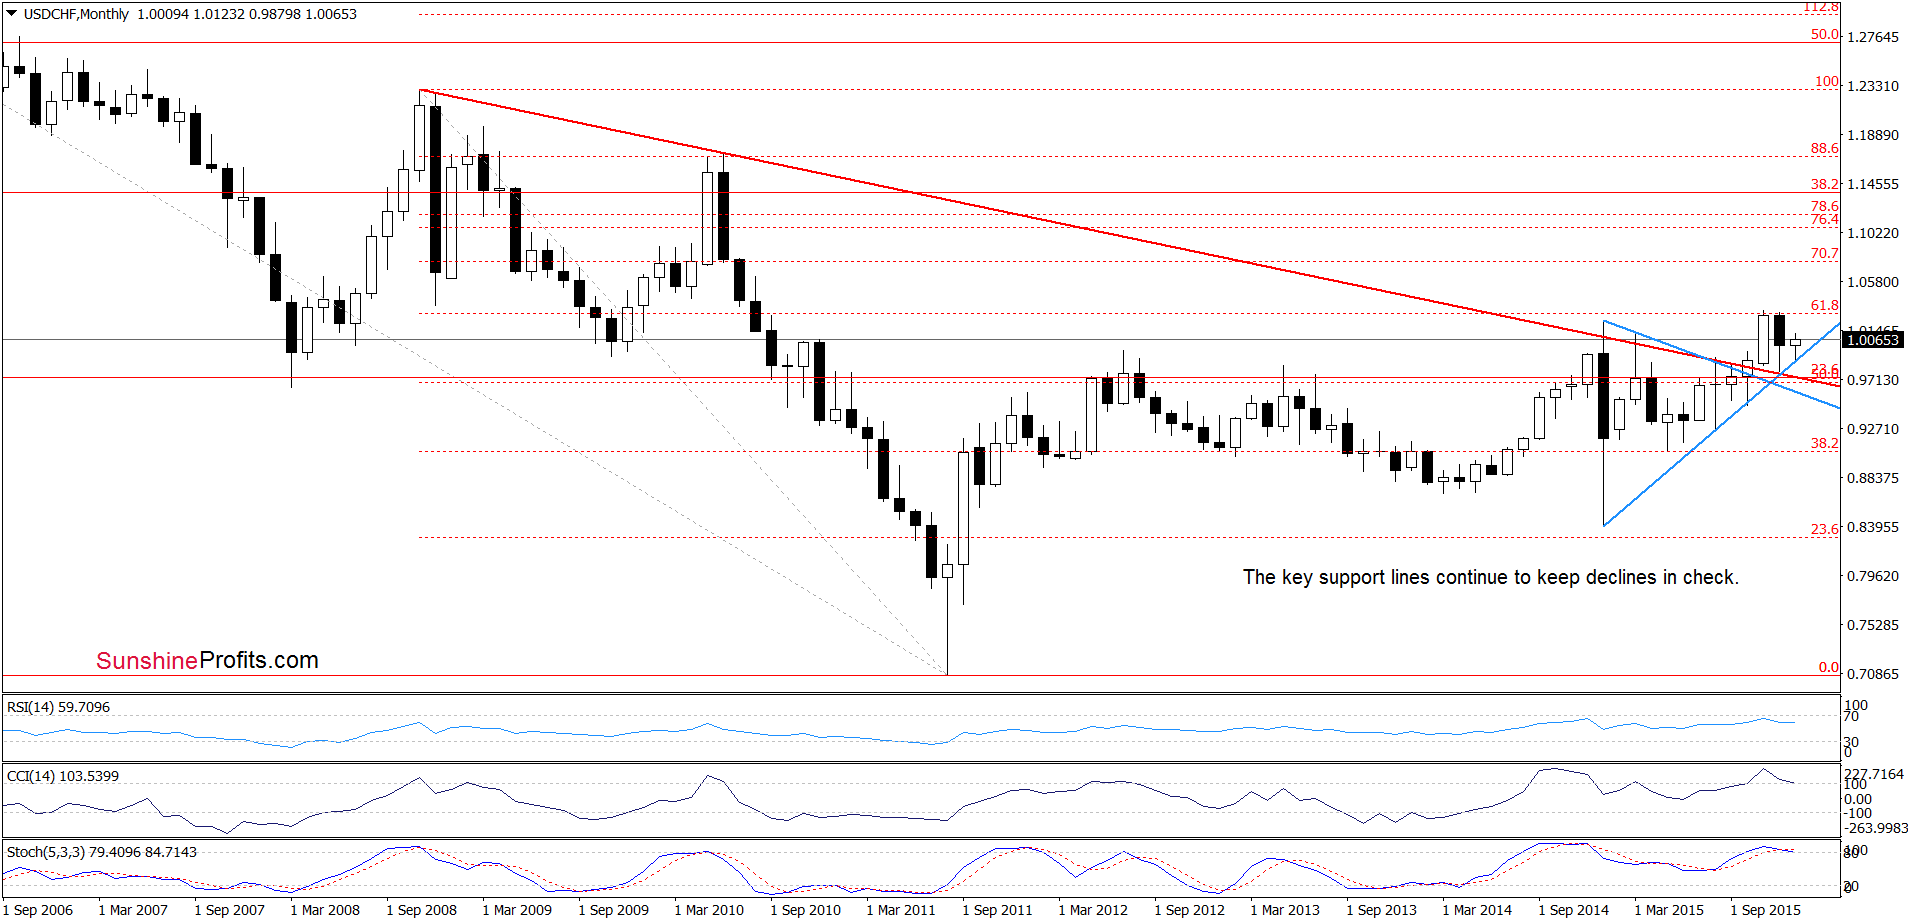
Looking at the long-term chart, we see that the recent downward move took USD/CHF to the blue support line, which triggered a rebound.
How did this increase affect the medium-term picture? Let’s take a look at the weekly chart and find out.
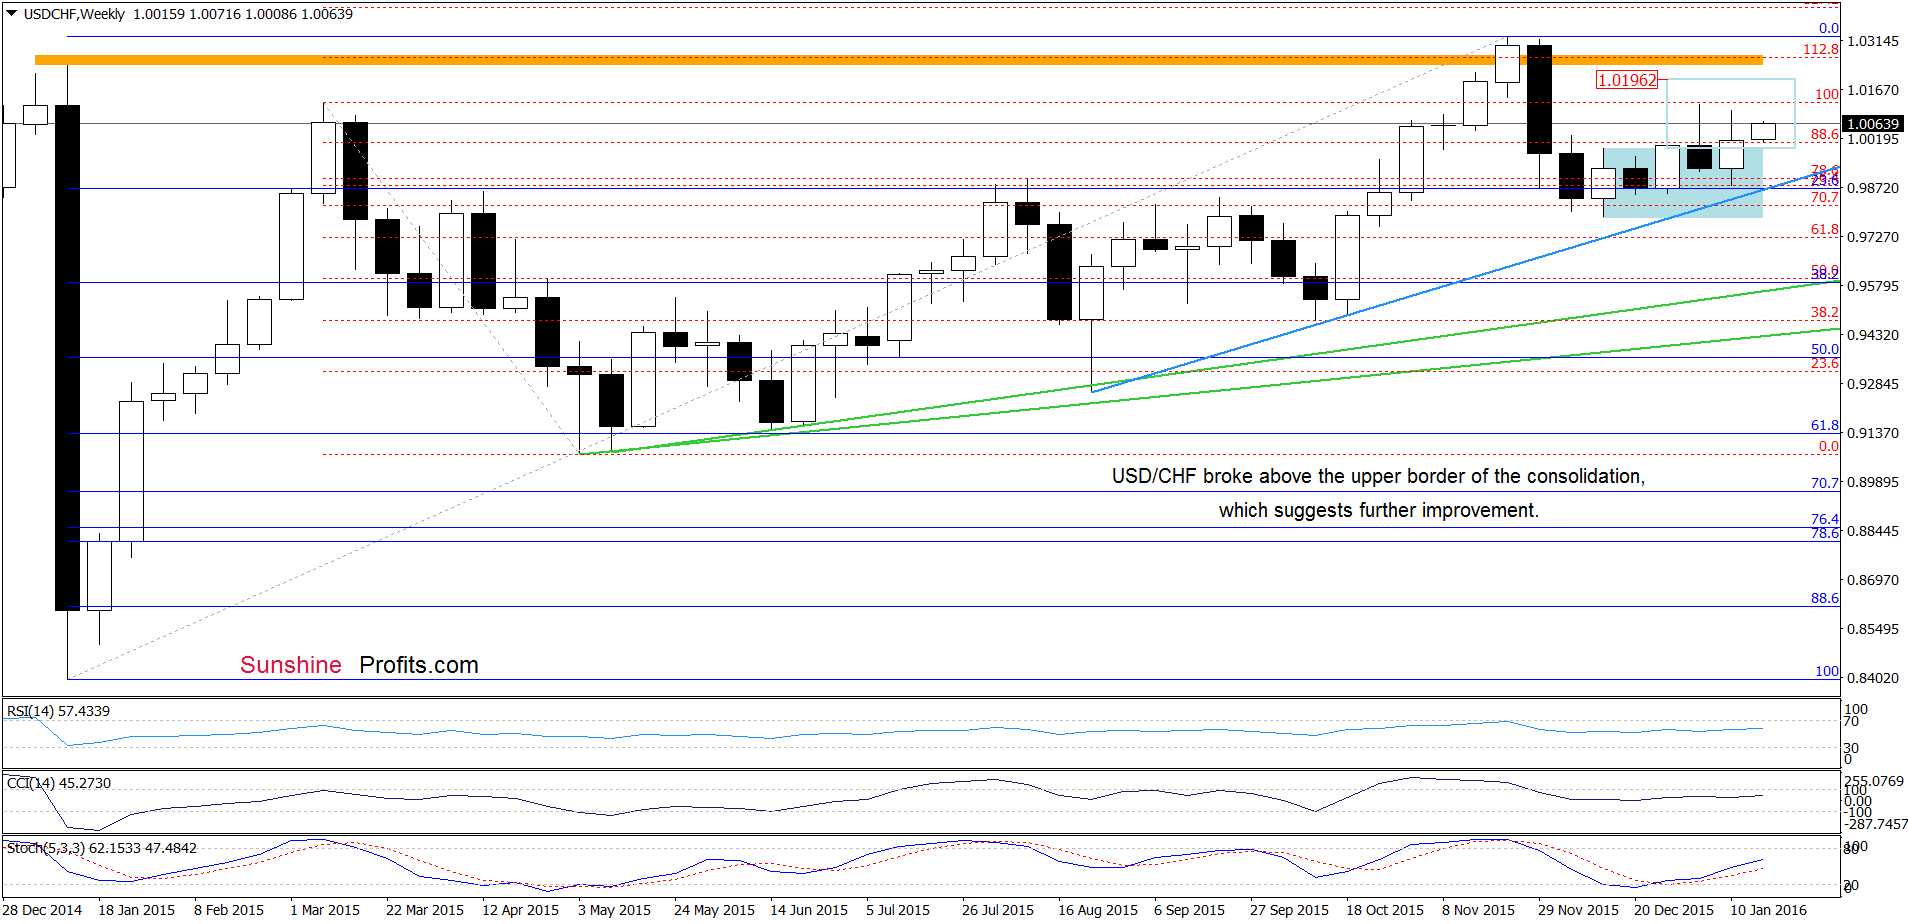
From this perspective, we see that USD/CHF climbed above the upper border of the blue consolidation once again, which in combination with buy signal generated by the Stochastic Oscillator suggests further improvement and an increase to around 1.0196, where the size of the upward move will correspond to the height of the formation.
Very short-term outlook: mixed with bullish bias
Short-term outlook: mixed with bullish bias
MT outlook: mixed
LT outlook: mixed
Trading position (short-term; our opinion): No positions are justified from the risk/reward perspective at the moment. We will keep you informed should anything change, or should we see a confirmation/invalidation of the above.
AUD/USD
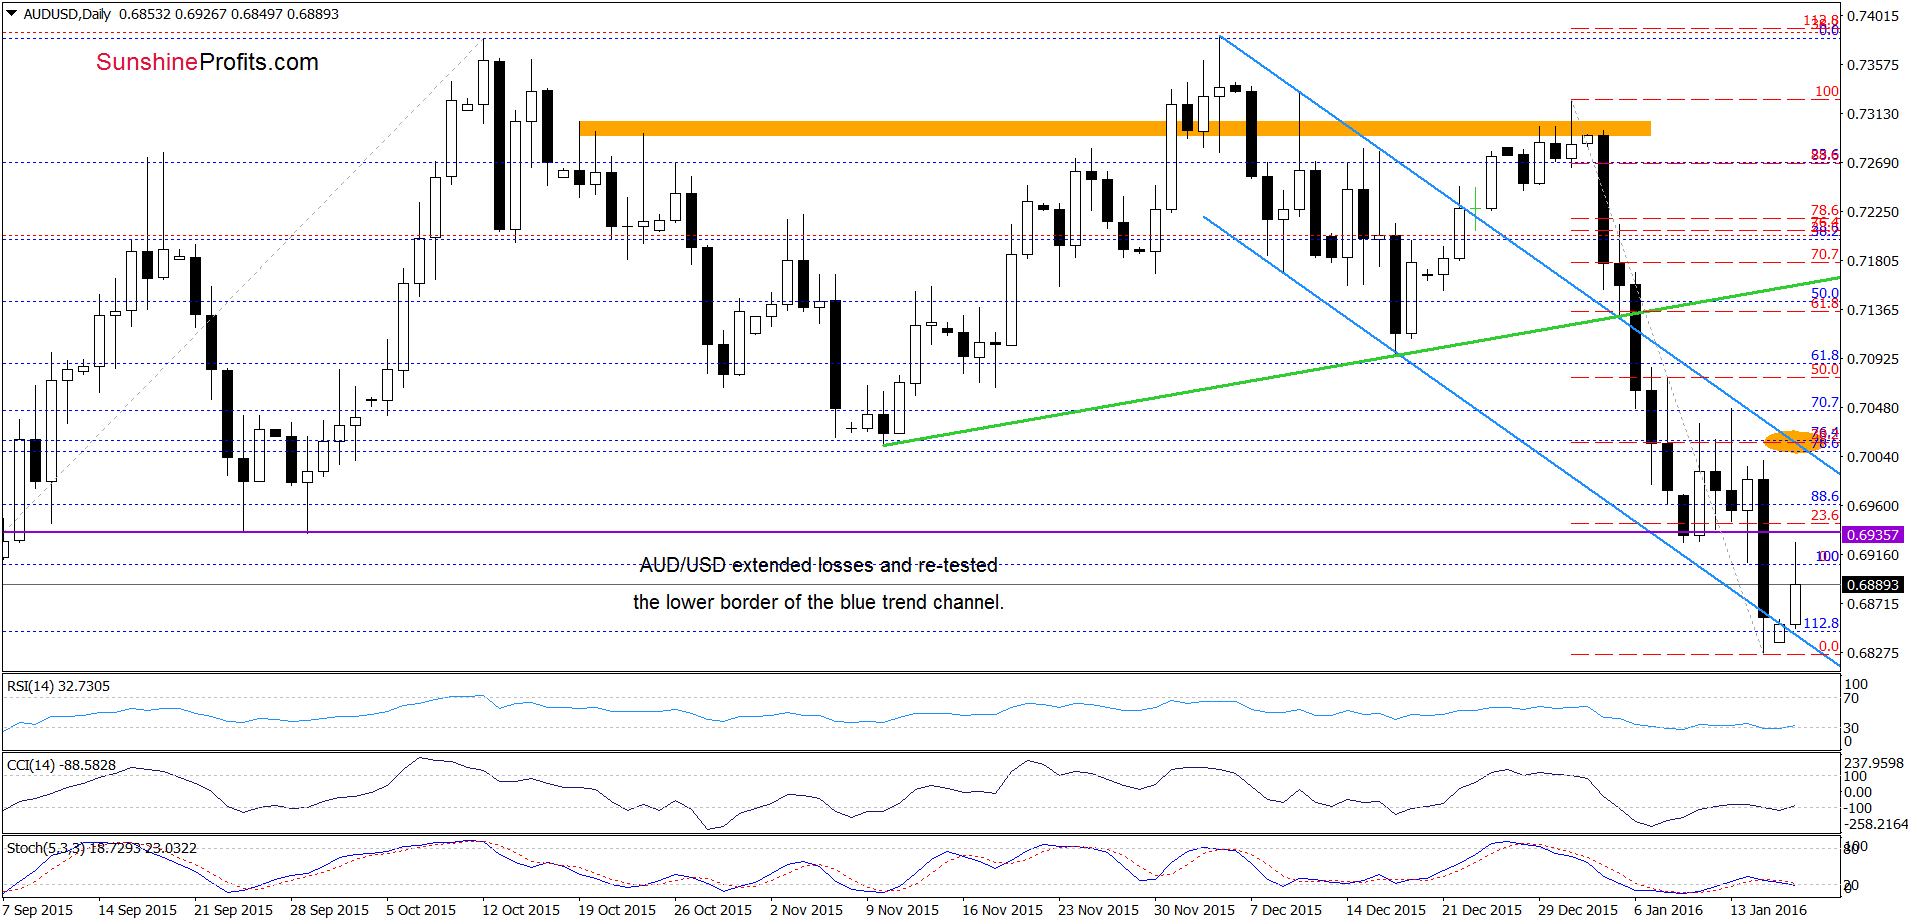
On Friday, AUD/USD extended losses and slipped under the lower border of the blue declining trend channel and the 112.8% Fibonacci extension. Earlier today, the exchange rate invalidated these small breakdowns, which triggered a rebound to the Jan 10 low. Although today’s move is a positive signal, we think that as long as there is no comeback above the horizontal purple resistance line, all upswings will be nothing more than a verification of earlier breakdown. If this is the case, another downswing should not surprise us – especially when we factor in the medium-term picture.
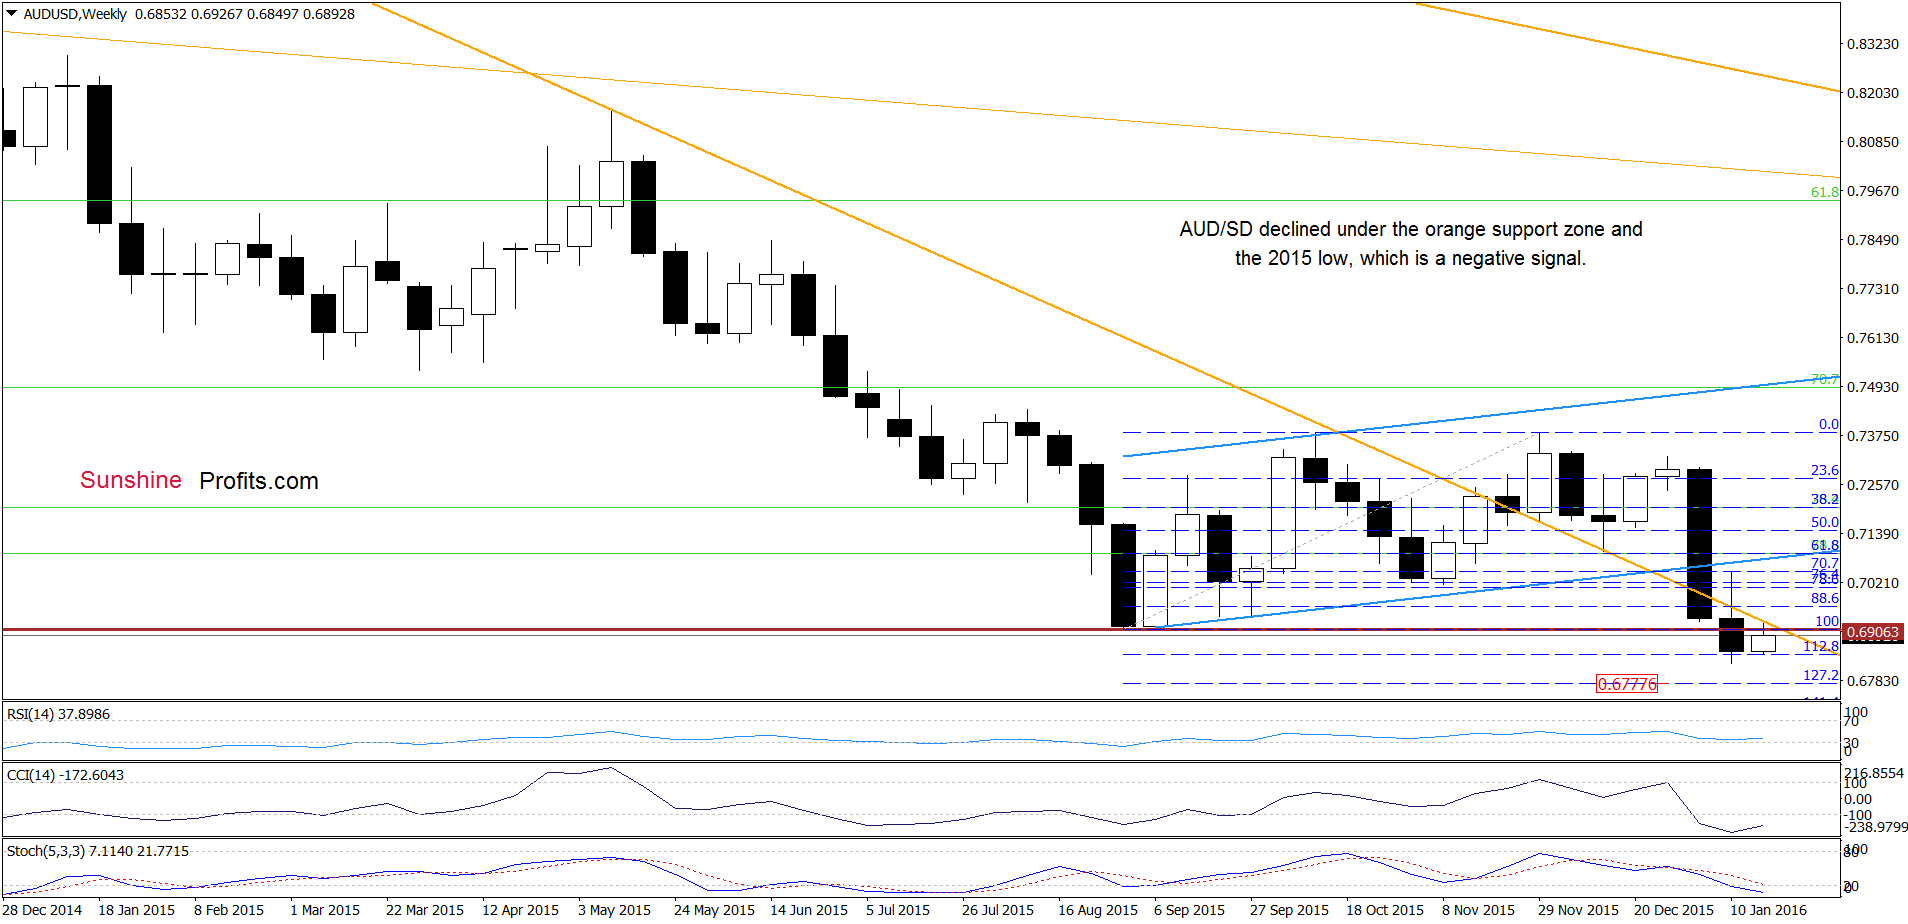
From this perspective, we see that AUD/USD declined not only below the Aug low, but also dropped under the long-term orange support line. As you see, this week’s upward move looks like a verification of earlier breakdown, which suggests lower values of the exchange rate and a re-test of the last week’s low.
Very short-term outlook: mixed with bearish bias
Short-term outlook: mixed
MT outlook: mixed
LT outlook: mixed
Trading position (short-term; our opinion): No positions are justified from the risk/reward perspective. We will keep you informed should anything change, or should we see a confirmation/invalidation of the above.
Thank you.
Nadia Simmons
Forex & Oil Trading Strategist
Przemyslaw Radomski, CFA
Founder, Editor-in-chief
Gold & Silver Trading Alerts
Forex Trading Alerts
Oil Investment Updates
Oil Trading Alerts

